Chainlink [LINK] moved closer to erasing its 2026 losses after reaching $12.60, its highest price in seven months.
However, LINK quickly retraced from that level. At press time, Chainlink traded near $11.76, marking a 1.47% daily gain. Trading Volume climbed 84% to $1.2 billion, reflecting elevated market activity during the volatile move.
Why did Chainlink fall from $12?
Chainlink’s retreat coincided with considerable capital leaving the futures market.
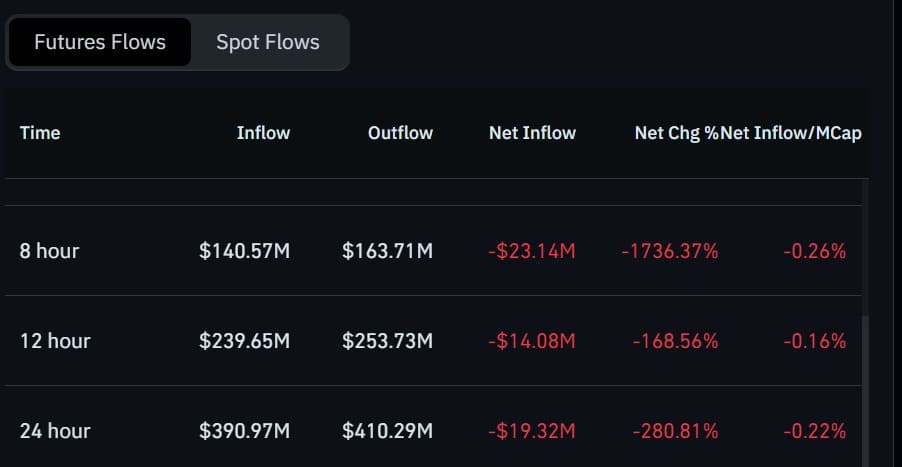
CoinGlass recorded $410.29 million in Futures Outflows, compared with $390.9 million in Futures Inflows.
Consequently, Futures Netflow fell 280% to -$19.3 million. The negative reading showed that more capital exited futures than entered them.
However, Futures Netflow alone could not confirm whether traders closed Long Positions or added selling pressure. While derivatives exposure weakened, institutional demand moved in the opposite direction.
Are Chainlink ETFs buying LINK?
Chainlink Spot ETFs recorded five consecutive days of Net Inflows as LINK approached its seven-month high.
Onchain Lens reported that Grayscale received 132,950 LINK worth $1.53 million from Coinbase Prime. Grayscale was the only Chainlink fund recording Net Inflows that day. Its Daily Net Inflows reached $5.16 million, lifting Cumulative Net Inflows to $109 million.
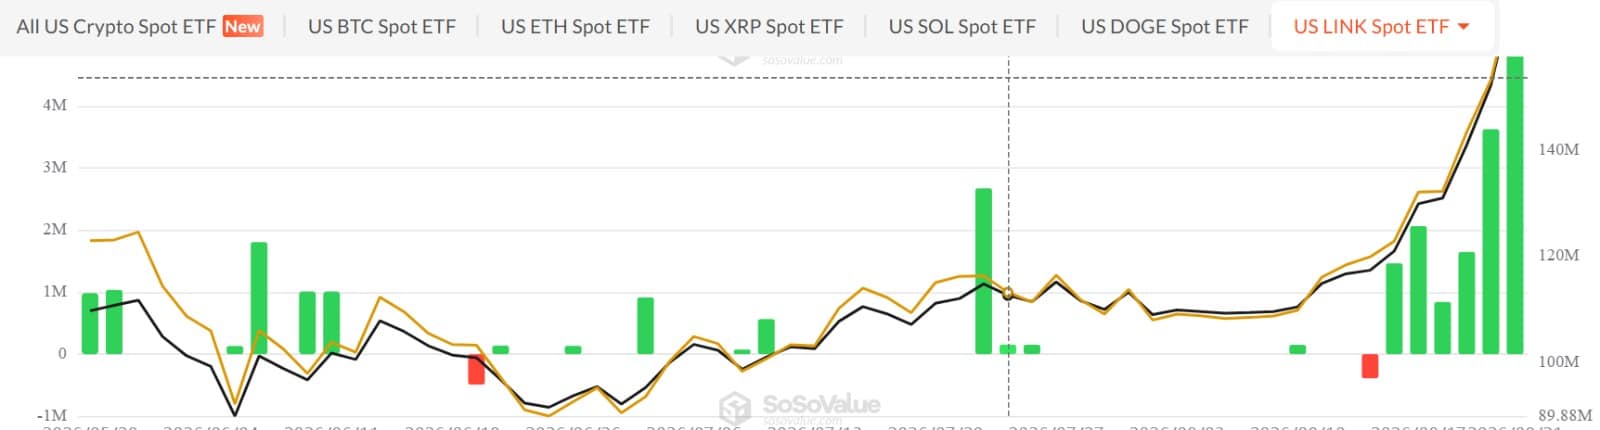
The previous day, Bitwise’s Chainlink ETF added 163,379 LINK worth $1.85 million.
These purchases suggested that institutional demand continued despite LINK’s rejection from $12.60. That demand now faces a test from the wider Spot market.
Is Spot demand supporting Chainlink?
CoinAnk data showed that Market Delta remained positive for three consecutive days.
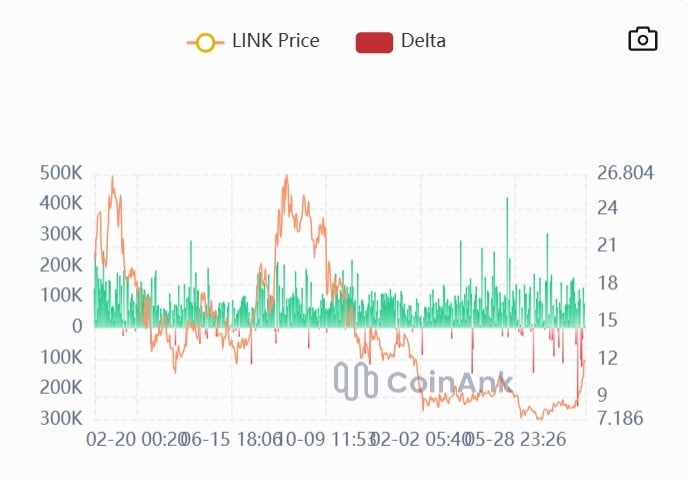
At press time, Market Delta stood near 64,000, reflecting stronger Spot buying than selling.
Meanwhile, Spot Netflow turned negative after previously reaching $15 million. That earlier spike coincided with increased profit-taking after LINK crossed $10.
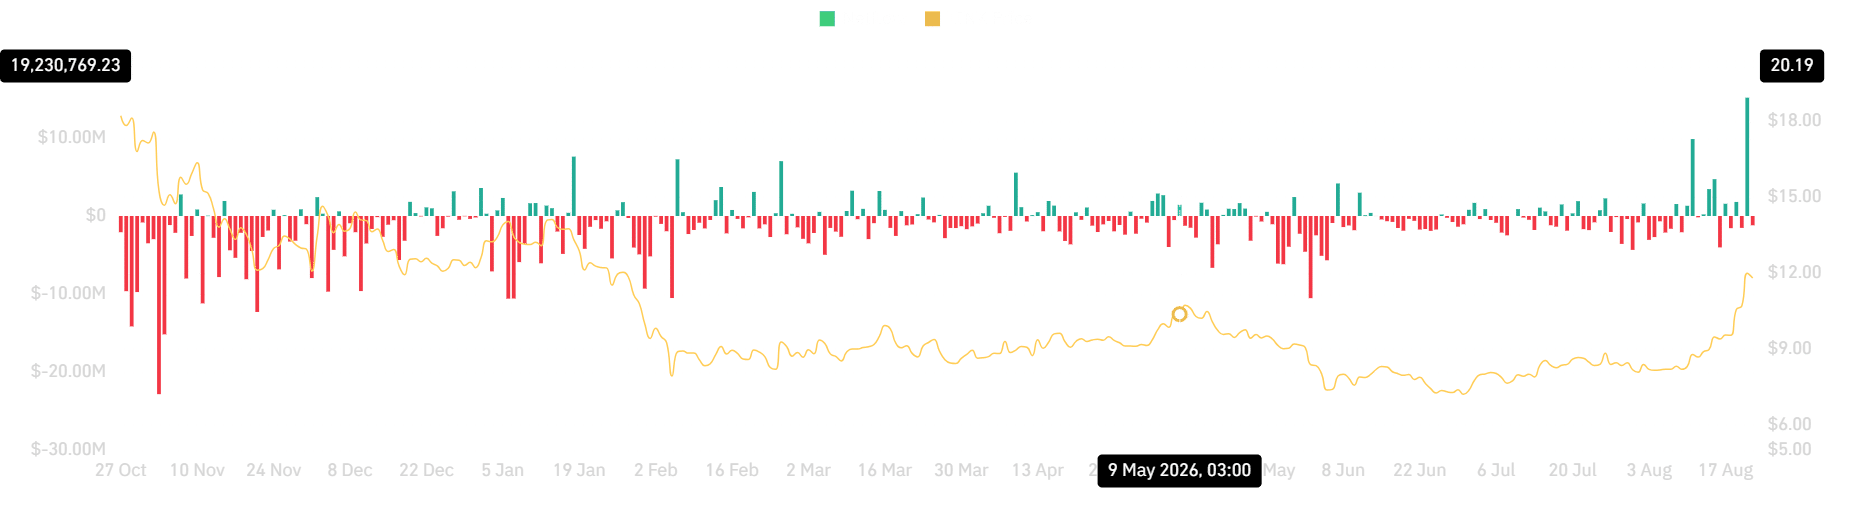
At press time, Spot Netflow stood near -$1.19 million, indicating that more LINK left exchanges than entered them. This reduced immediate sell-side pressure but did not independently confirm fresh purchases.
Can Chainlink reach $14?
Chainlink’s bullish structure remained intact despite the rejection. The Positive Directional Indicator climbed to 55, while the Negative Directional Indicator fell to 3.
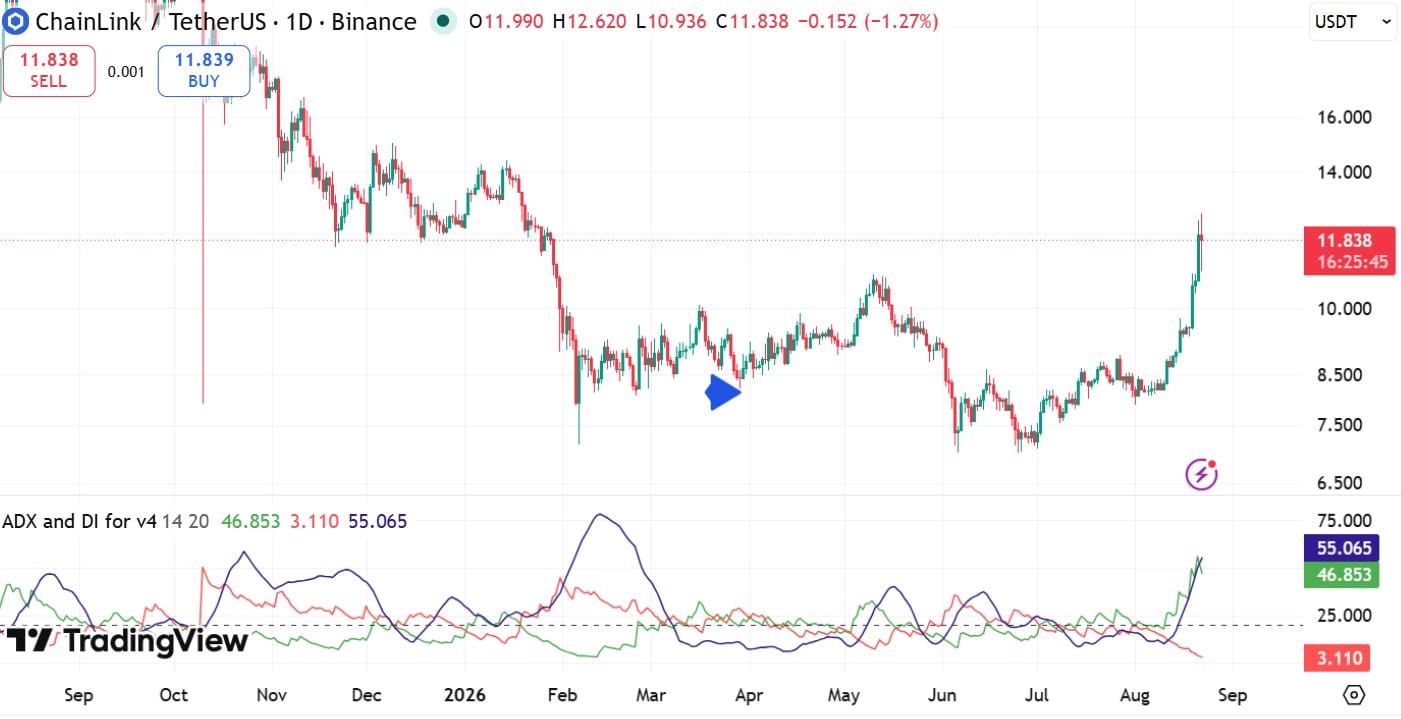
A rising Average Directional Index and Positive Directional Indicator reflected a strong prevailing trend.
If institutional and Spot demand continue, Chainlink [LINK] could reclaim $12 before targeting $14. However, continued Futures Outflows could weaken momentum and expose the $10 support.
Final Summary
- Chainlink reached a seven-month high of $12.60 before retracing to $11.76.
- LINK Trading Volume rose 84% to $1.2 billion during the volatile move.