This week, XRP broke its summer lull and jumped nearly 20%, rising toward $1.2124. The current momentum, fueled by a wave of Washington “hopium,” has brought the token close to the main price divide on the weekly chart — the 1.21–1.23 range as per TradingView.
However, technical indicators are sending a clear signal that the asset is approaching a zone of heavy profit-taking. XRP has not risen above this threshold since the catastrophic crash of Oct. 10, 2025, when $19 billion in forced liquidations of leveraged positions locked the crypto market into a year-long bearish trend.
You Might Also Like

Crypto Giant OKX Bans Claude Use
What’s First For Bitcoin (BTC): $70,000 or $60,000? XRP Fights For $1 Threshold, Shiba Inu (SHIB) Billion Flows Gone: Crypto Market Review
Since June, the XRP chart had been sliding toward the psychologically important $1 level while the daily RSI formed a hidden bullish divergence — a sign of seller exhaustion. A strong wave of news from the U.S. became the key fundamental trigger for the breakout:
- The Treasury launched yield curve control (YCC), which traditionally weakens the dollar.
- The SEC released its long-awaited crypto asset regulation framework, Regulation Crypto Assets.
- The presidential administration held a closed-door meeting with top industry executives, including Ripple’s leadership, to discuss real-world asset (RWA) tokenization and the Clarity Act.
Official statements from the White House added a powerful dose of optimism to the market. Amid a cascade of short liquidations, XRP’s daily candle immediately broke above the 23-day SMA at $1.04 and the 50-day SMA at $1.07 before surging beyond the upper Bollinger Band at $1.13.
An ironclad wall lies ahead for XRP
Despite the political catalyst, the higher weekly timeframe points to an approaching technical dead end. The current rebound is running into a massive cluster of long-term resistance levels:
- Bollinger Bands midline (20-week MA): currently sits precisely at $1.2172.
- Heavy 200-week SMA: stands at $1.2277, tightly intertwined with the 23-week moving average.
Right now, the daily RSI is above 71.59, signaling strong short-term overbought conditions. Attempting to buy the asset beneath heavy moving averages at the peak of this momentum carries elevated risk.
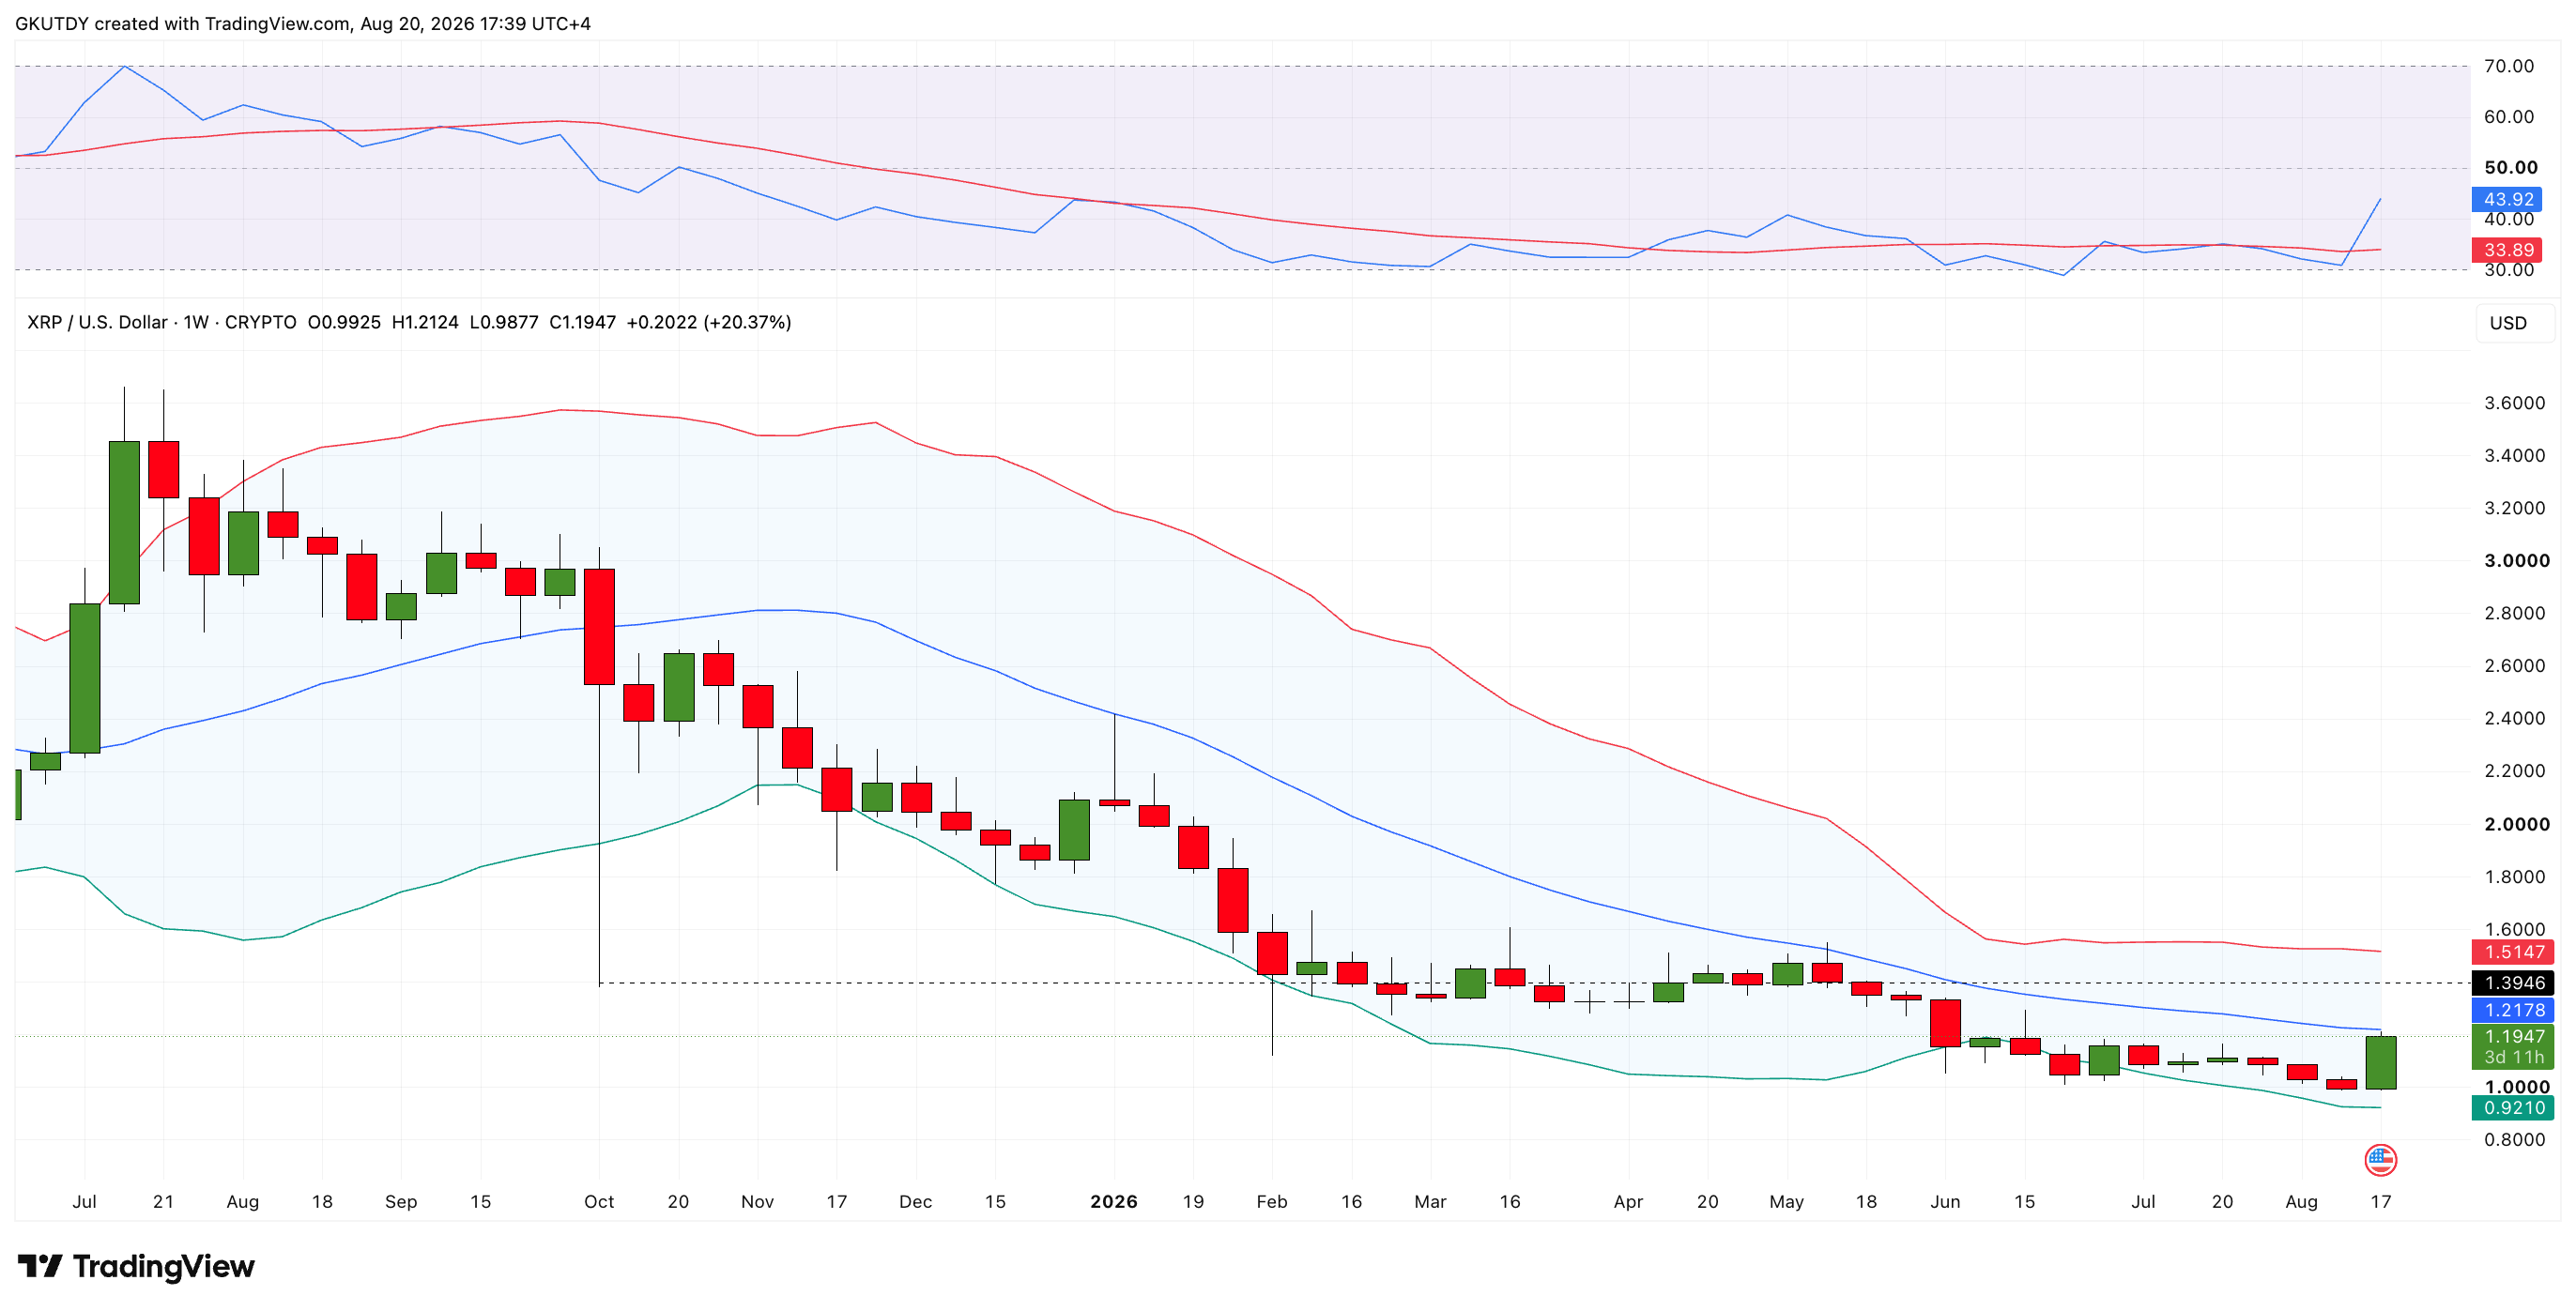
The rally has overheated not only the short-term charts but also overall market sentiment. The Crypto Fear and Greed Index has surged to 60, entering clear Greed territory.
Against this backdrop, the $1.21–$1.23 range activates a dense block of sell orders. This is where the interests of short-term buyers locking in quick profits from $1, spot holders hoping to break even after a year of waiting, and large short sellers defending the long-term trend all converge.
You Might Also Like

Considering all the fundamental and technical factors, the argument that it is time to take profits is a pragmatic calculation. Taking profits near the heavy weekly moving averages is psychologically difficult because of the “hopium” pouring out of Washington and the crowd’s growing greed, but it is strategically justified.
A full trend reversal will begin only after XRP closes the week above $1.2340. Until then, the risk of a rapid pullback toward the $1.07 and $1 support levels remains high.