 Take Back alt=")
- Shiba Inu trying to stabilize
- Solana approaches recovery threshold
XRP has spent the last several weeks fighting to stabilize after a painful breakdown below its multi-month trading range. Recent events indicate that expectations for a move toward $1.50 are not wholly unrealistic, even though the asset is still stuck in a larger bearish structure. The resumption of trading activity is one of the most promising indicators.
XRP’s volume recently increased by over 20%, suggesting that market players are once again paying attention. Though significant rallies seldom occur without it, rising volume by itself does not ensure a breakout. When traders start positioning for a bigger move, there is often an increase in participation.
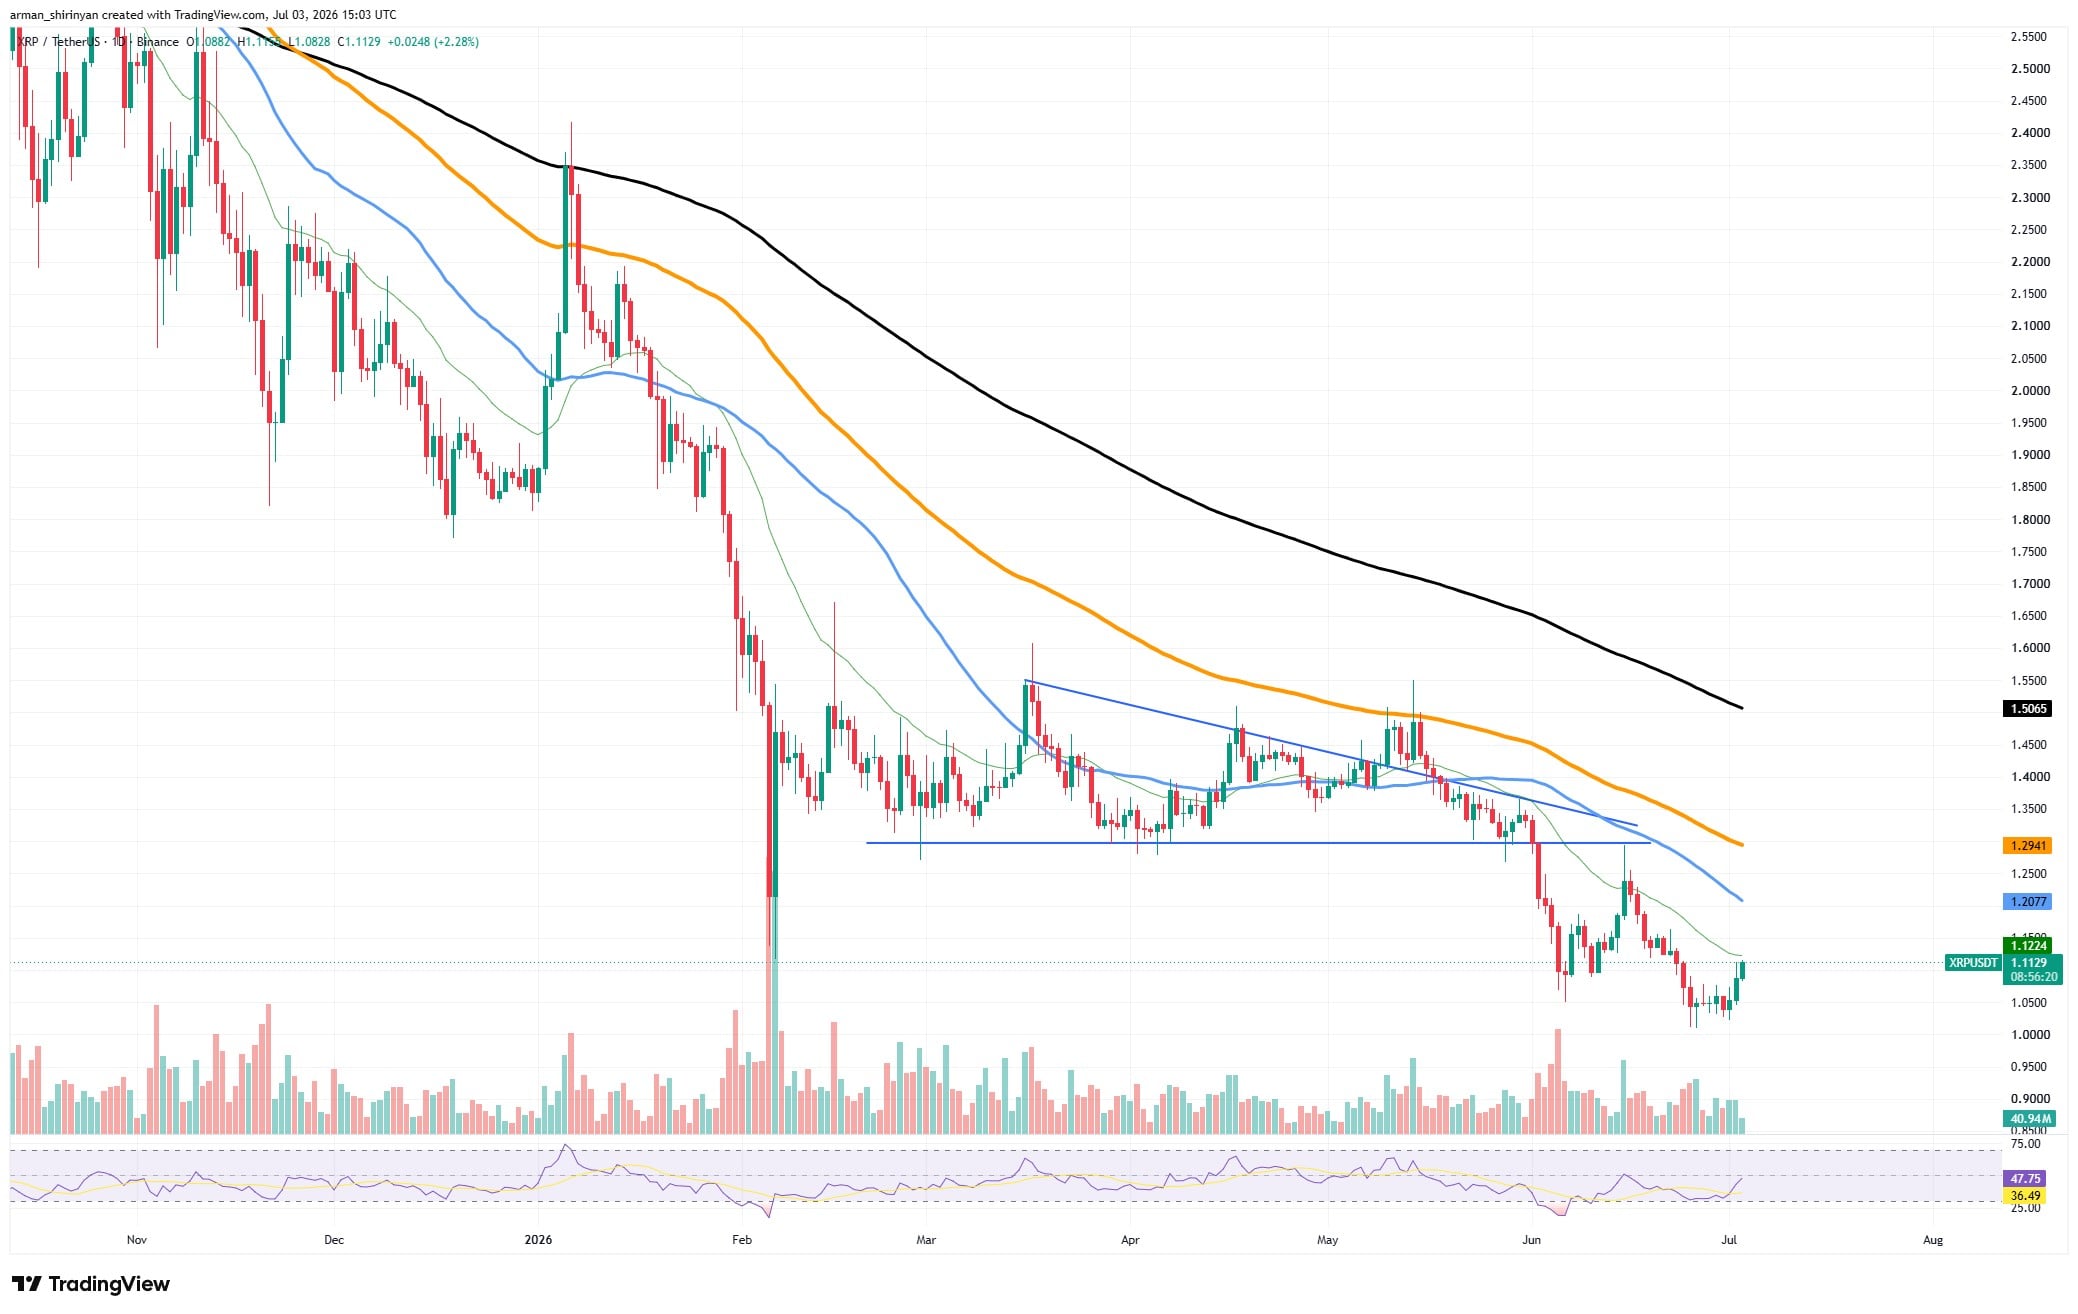
From a technical standpoint, XRP is beginning to improve. The asset has recovered its short-term moving average and is moving toward the $1.12 resistance zone after finding support close to the psychologically significant $1 level. Additionally, the RSI has recovered from oversold conditions and is steadily rising, indicating strengthening momentum.
XRP’s Hopes for $1.5 Are Not Empty: Can Shiba Inu (SHIB) Take Back $0.000005? Solana (SOL) on Verge of Breakthrough: Crypto Market Review
XRP Scam Alert: Fake Ripple Payout Tokens Used to Drain Crypto Wallets
The cluster of resistance levels between $1.12 and $1.29 continues to be the bulls’ immediate obstacle. The 50-day and 100-day moving averages, which have served as dynamic resistance during the current decline, are located in this region. The technical outlook for XRP would be greatly improved by a successful breakout above these levels. If buyers are able to recover $1.29, the route to $1.50 becomes much more feasible.
You Might Also Like

The long-term 200-day moving average, which is presently above the market and serves as one of the most significant resistance levels on the chart, is located in the $1.50 area. The seeming exhaustion of selling pressure is another element bolstering the bullish case. XRP has already completed a major breakdown and subsequent capitulation phase, meaning many weak hands have likely exited the market. The fact that the price has recently stabilized above $1 indicates that demand is starting to absorb the remaining supply.
Shiba Inu trying to stabilize
After one of its most trying periods this year, Shiba Inu is making an effort to stabilize, but returning to $0.000005 will still be difficult. Although the meme coin has somewhat recovered from recent lows, price action is still being influenced by a larger bearish structure. After bouncing from the $0.0000041–$0.0000042 support zone, SHIB has shown signs of life and is currently trading around $0.00000436.
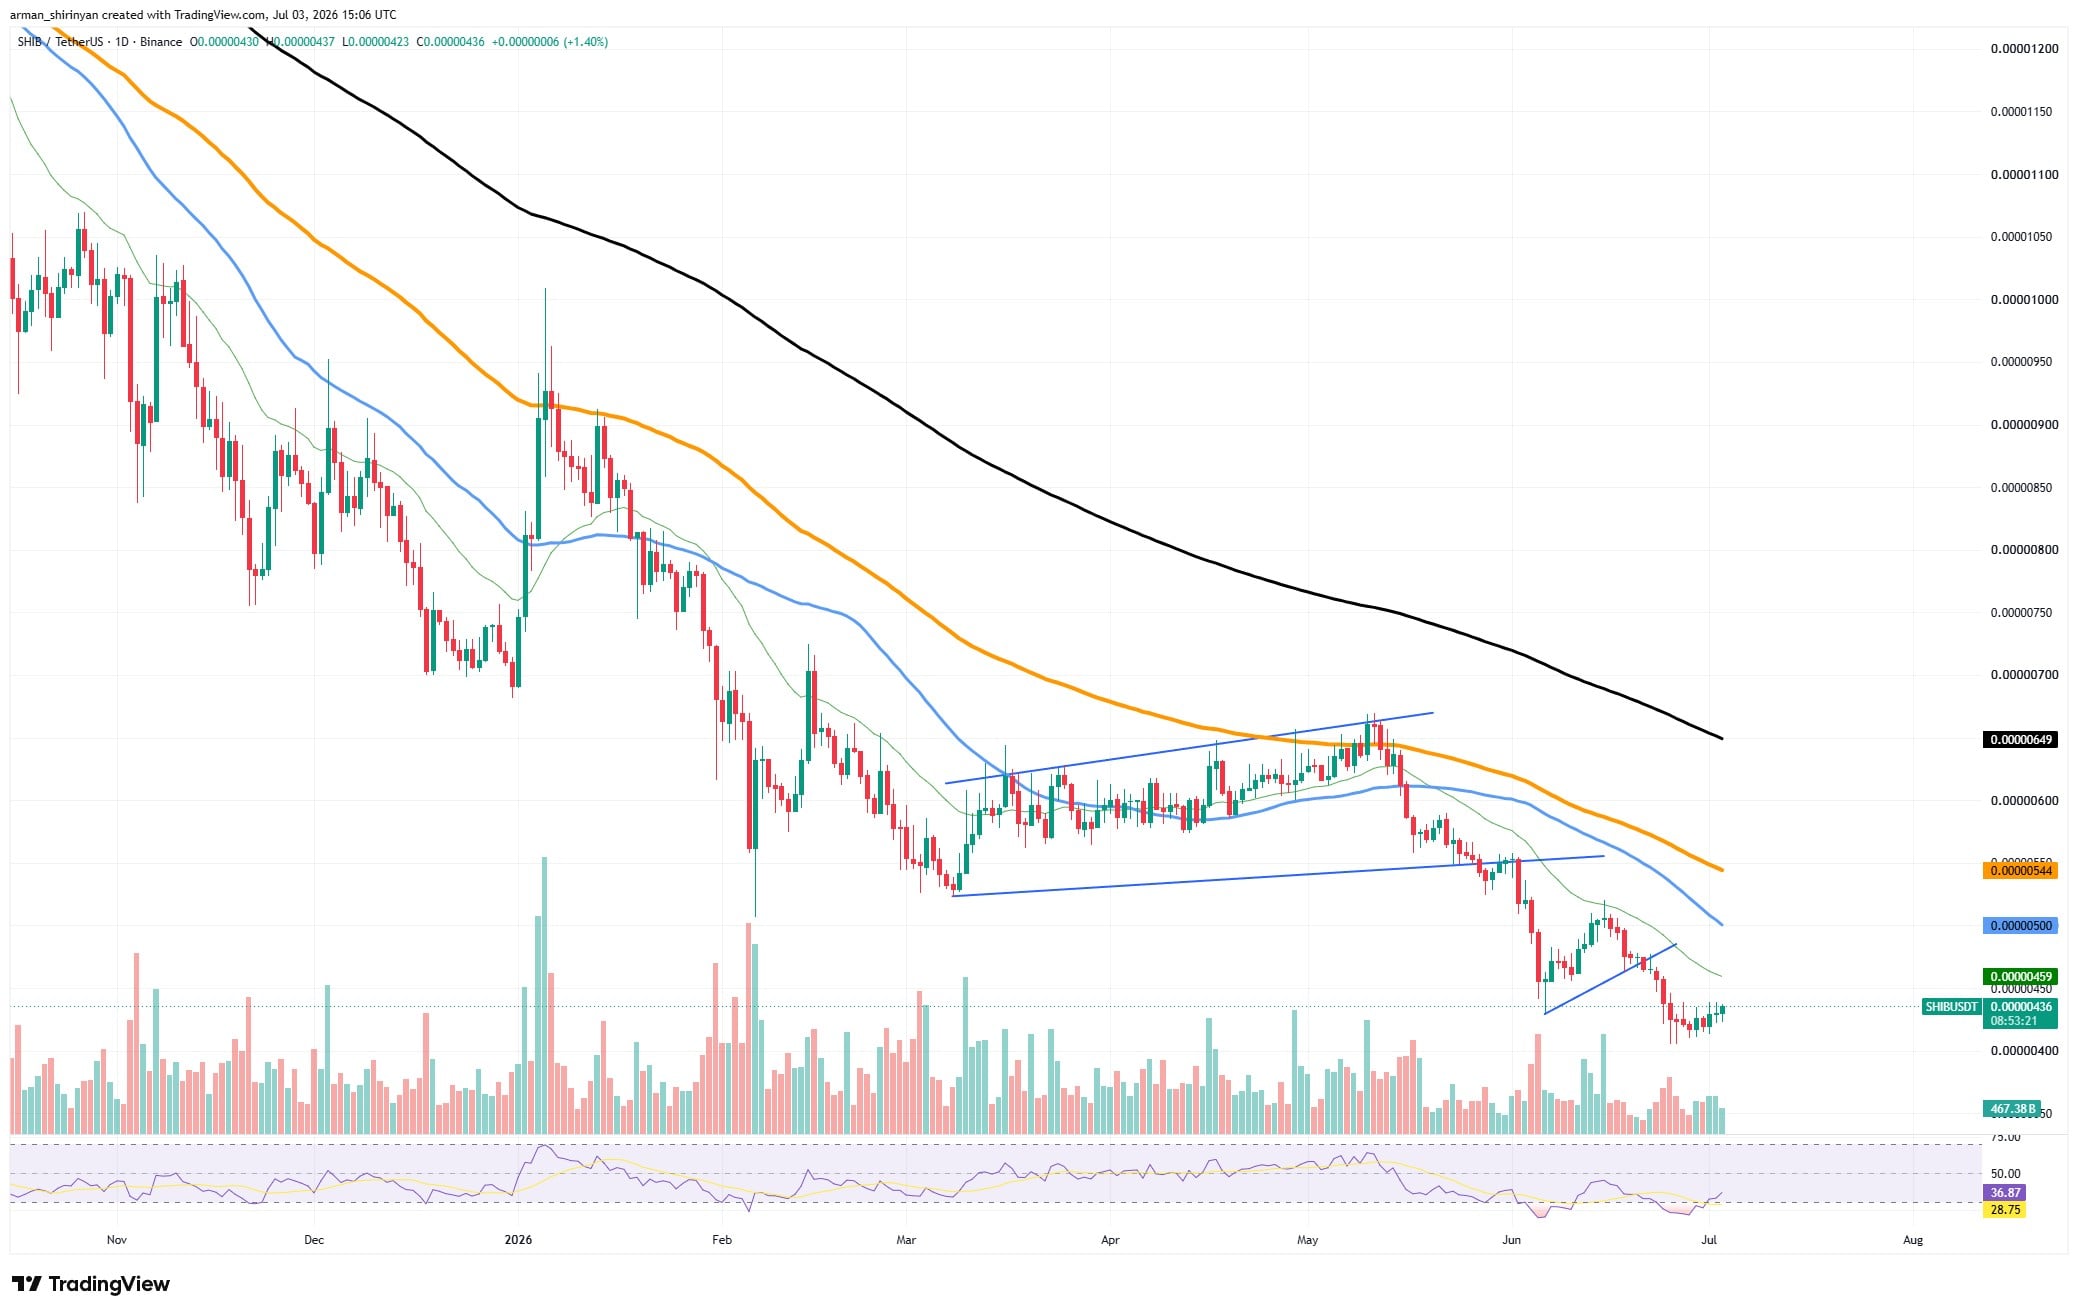
Following weeks of unrelenting pressure, sellers may be losing some momentum as the RSI rises from oversold territory, which coincides with the recovery. Whether that rebound is strong enough to push SHIB back above the psychologically significant $0.000005 level is the crucial question. The short-term moving average is currently at $0.00000459, which is technically the first barrier.
SHIB has struggled to maintain momentum above this level during previous recovery attempts. If bulls manage to clear it, the next major target becomes the 100-day moving average near $0.0000050. Because it serves as both a technical resistance zone and a psychological threshold, that level is especially significant. Reclaiming it would signal that buyers are finally regaining some control after months of decline.
You Might Also Like

All three indicators are still in a bearish alignment, and SHIB is still trading below its 50-, 100-, and 200-day moving averages. The longer-term resistance around $0.00000544 and $0.00000649 remains far above current prices, showing just how much ground bulls still need to recover.
Volume has also failed to show the kind of explosive accumulation that typically accompanies major trend reversals. While recent sessions have seen increased activity, the market has not yet produced a convincing breakout signal.
Solana approaches recovery threshold
One of Solana’s most significant technical moments in recent weeks is quickly approaching. The asset is currently testing a significant resistance cluster that may indicate whether a more significant recovery is about to begin after being stuck in a protracted downtrend for months. SOL has made a remarkable comeback from the June lows near $65, and it is currently trading around the $81 level.
More significantly, the asset has returned above its short-term and medium-term moving averages as a result of the recovery, something that has not happened for the majority of the recent correction. The most significant battleground now sits directly ahead. Solana is testing the area around $82-$85, where the 100-day moving average and previous support levels converge. This zone acted as a floor for months before the market breakdown earlier this year.
You Might Also Like
As often happens in technical analysis, former support has now become resistance. What makes the current setup particularly interesting is the improvement in momentum. The RSI has climbed toward 65, showing strong buying interest without yet entering extreme overbought territory. This leaves room for additional upside if buyers can maintain control. Volume has also expanded during the recovery phase.
Unlike many recent rallies that occurred on declining participation, Solana’s move higher has attracted increasing market activity. That is generally considered a healthier signal and suggests that investors are becoming more confident in the asset’s recovery prospects.
That area coincides with the descending 200-day moving average, which remains the most important long-term resistance on the chart. The broader market environment is also becoming more supportive.
Bitcoin and Ethereum have stabilized, reducing pressure on major altcoins and allowing assets such as Solana to focus on their own technical recoveries rather than reacting exclusively to market-wide selling.
But traders should not declare victory too soon. For now, Solana is showing one of the strongest recovery structures among major cryptocurrencies. The chart suggests a breakthrough is within reach, but bulls still need to prove they can convert resistance into support before a larger rally can truly begin. Rejection at current levels could send SOL back toward support around $75, where the 50-day moving average is currently positioned.