
Jito [JTO] may be up by less than a percentage, but at press time, it was trading at a critical point of the trend channel pattern. On the other hand, its daily trading volume was significant for a token of its kind, up about 14% and averaging around $61 million.
Basically, a breach of the pattern to the upside would hint at an uptrend continuation. However, respecting the resistance would mean a decline to at least the slanting support level.
Jito’s price was rejected at the trendline resistance
On the charts, the price action seemed to be pulling back in a descending trend channel after a sharp upthrust from $0.53 to $0.88. If looked at optimistically, JTO appeared to be correcting in a bull flag pattern. However, the force to move the price down to the support of the channel was slowly declining.
At press time, it was rejecting the upper resistance, which could mean JTO might fall to around $0.53 with Chaikin Money Flow (CMF) in support. The CMF showed money exiting JTO’s spot market on Binance with a reading of – 0.07.
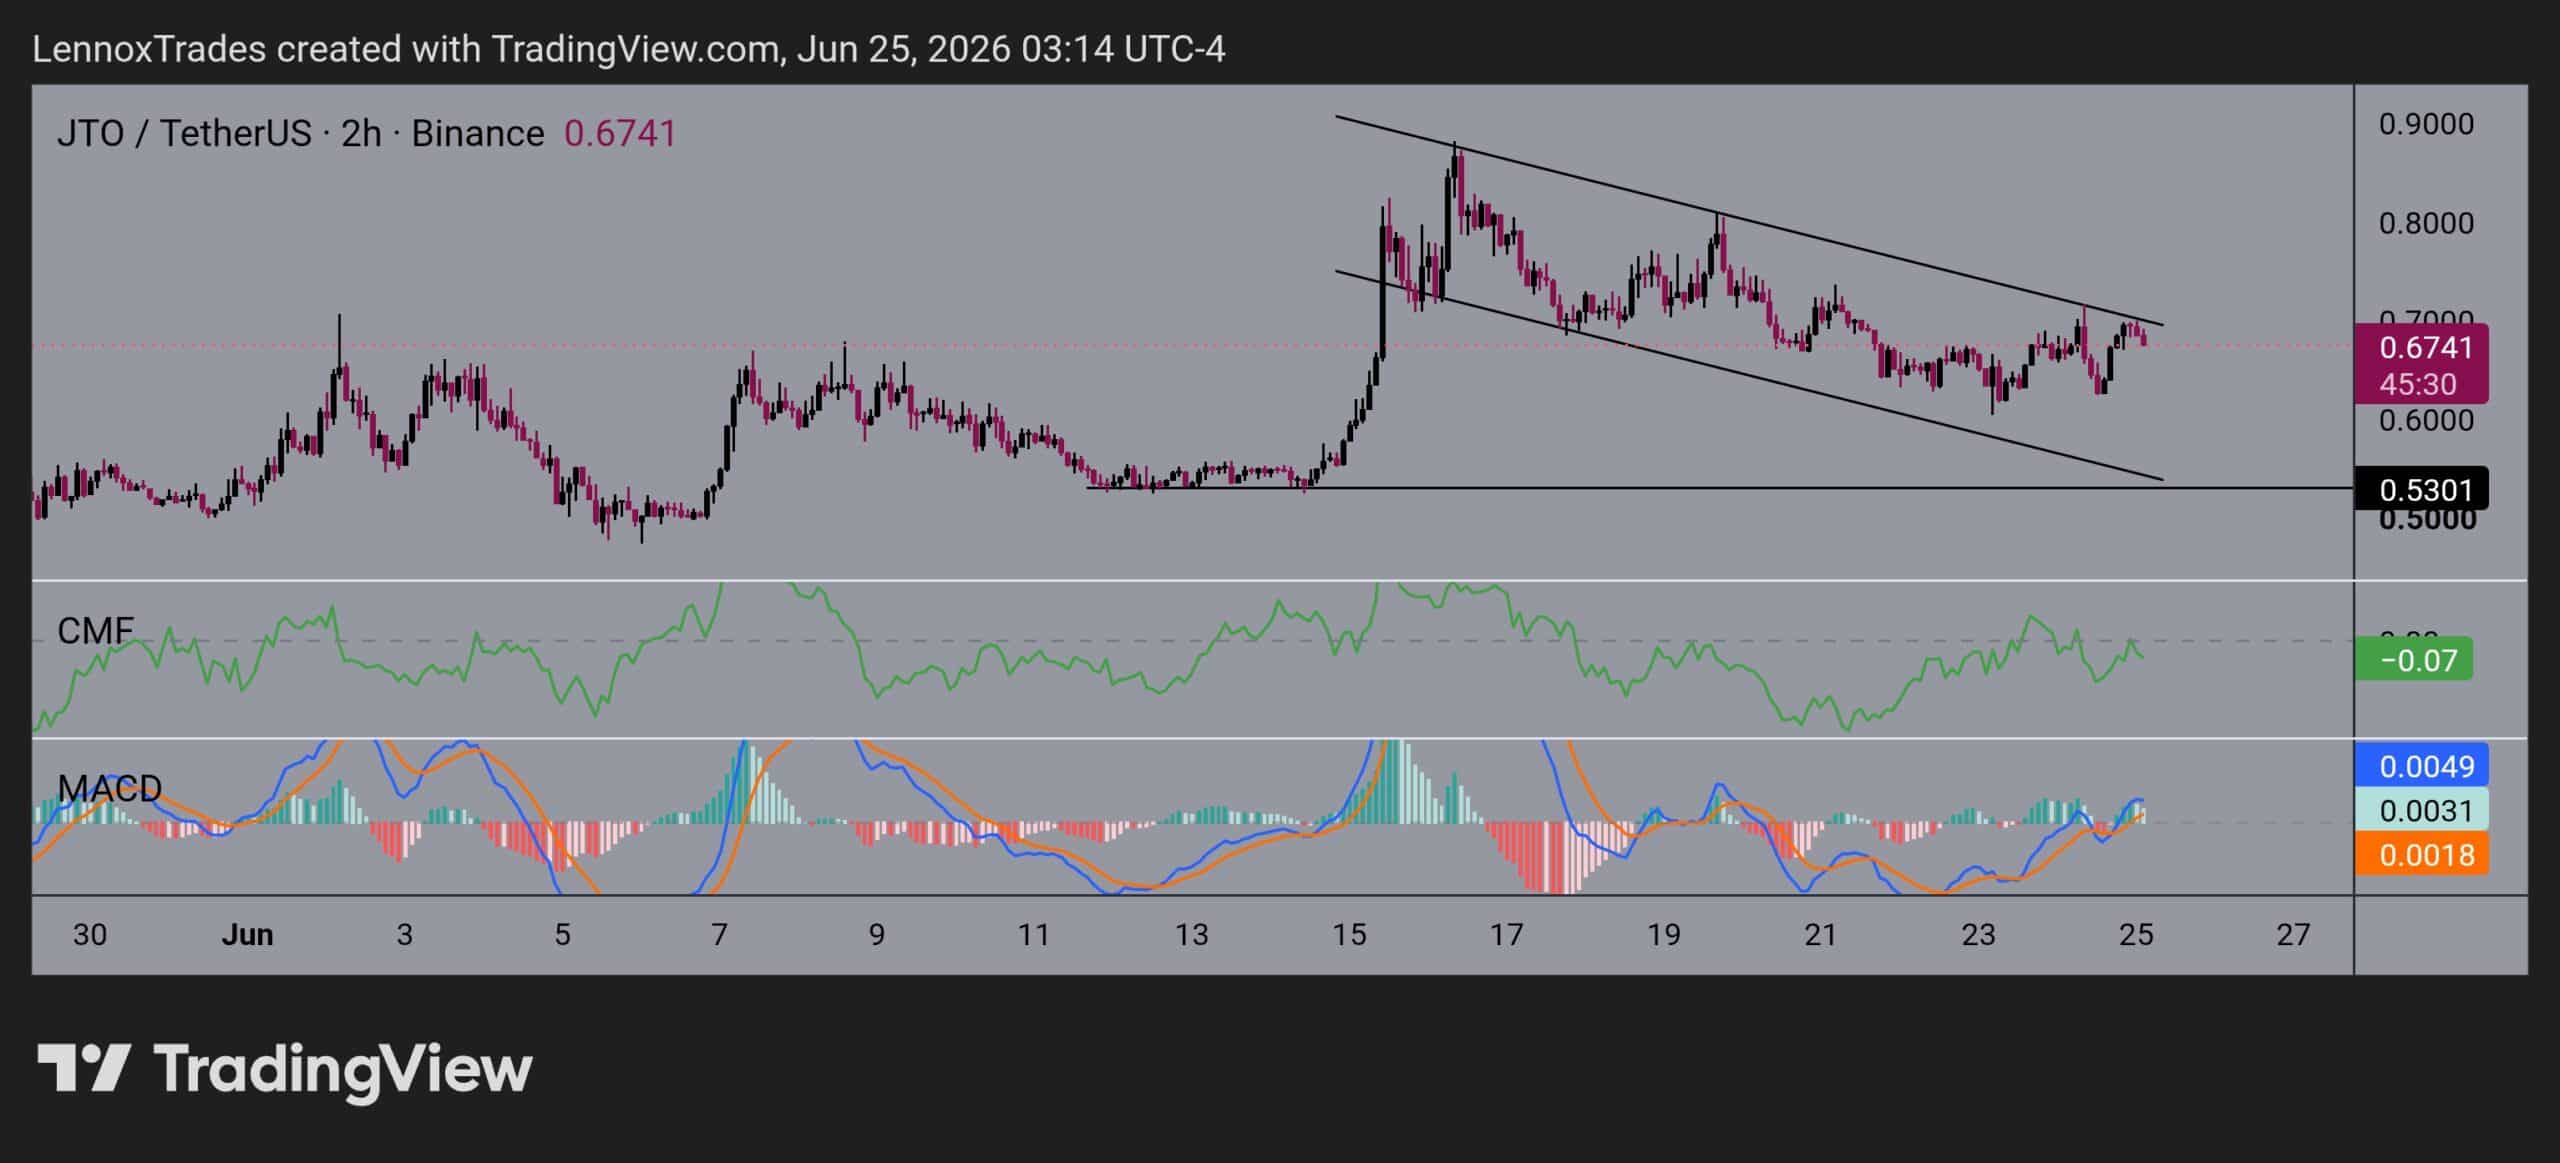
A break above the $0.70-zone and, in particular, the trendline would signal the start of JTO’s next leg up. That might be supported by a bullish MACD, even though the bars showed a fall in momentum.
Still, JTO appeared to be bullish on the 2-hour chart since it was yet to shift the market structure. Only trading and holding below $0.53 would invalidate a potential bullish continuation.
A look into OI, volume & liquidations!
More analysis revealed that Open Interest (OI) had climbed above $50 million. Put simply, the OI was less than $20 million below its peak value of slightly above $70 million since April.
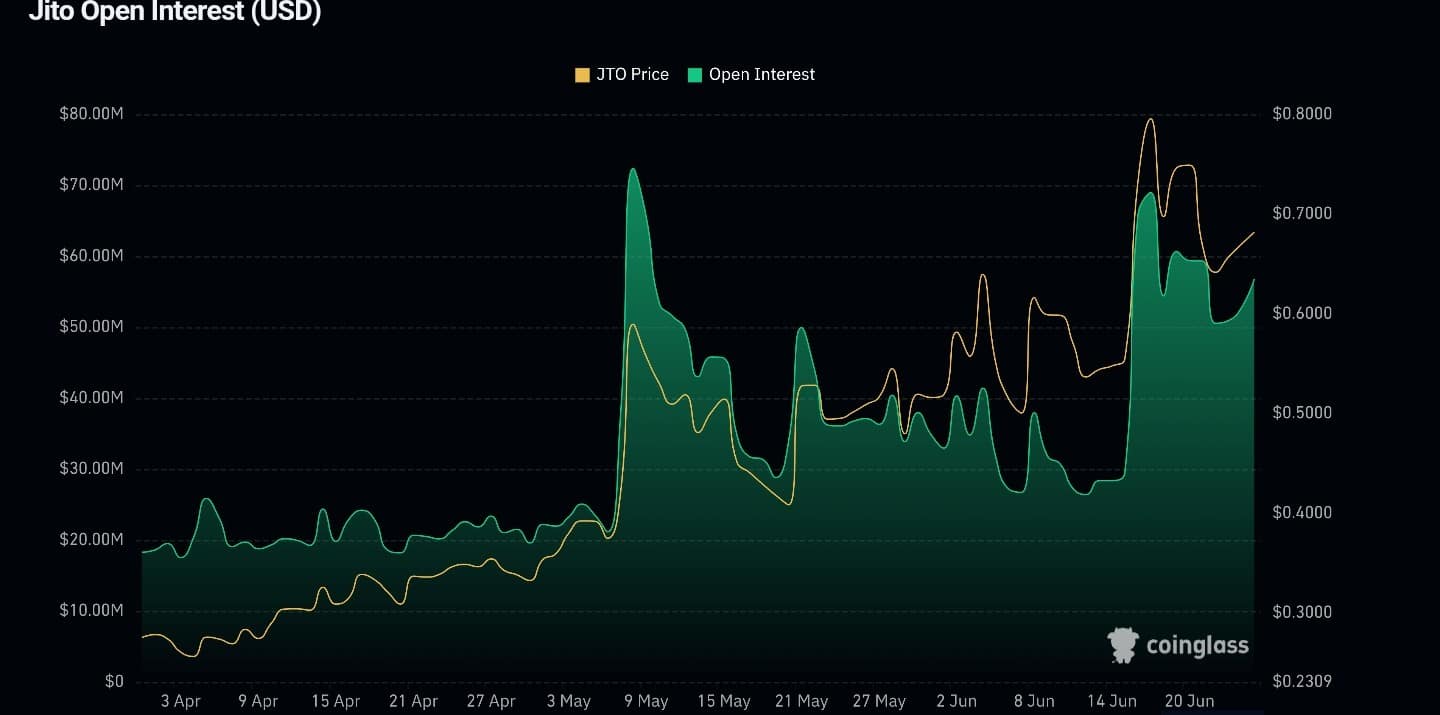
Since mid-June, the total trading volume has fallen by more than 3x from around $650 million across the perps and spot markets. It’s now trading below the $200 million mark, affirming the consolidation in a trend channel pattern.
Even the amount of liquidation cascades seemed to have dropped, alluding to a reduction in explosive moves in either direction.
What of Jito’s chain activity?
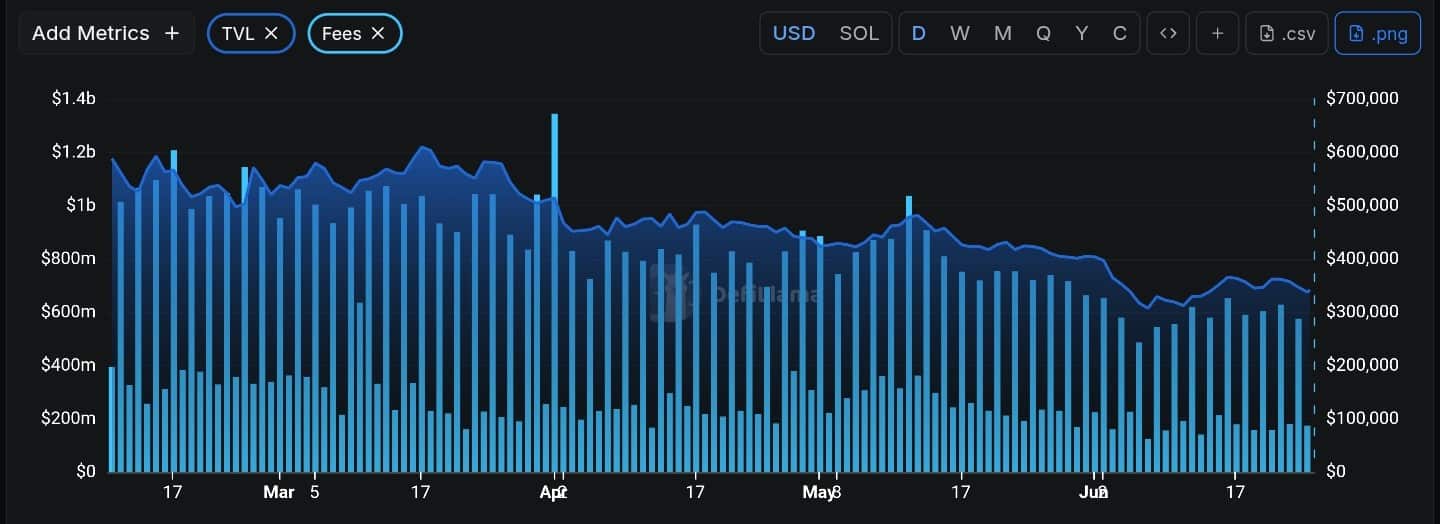
Well, it fell alongside the price too. At the time of writing, the Total Value Locked (TVL) was down about 20% to around $671 million. Similarly, assets staked were down by the same proportion too.
The amount of revenue generated through fees has dropped more than the TVL though. In fact, it was down 31% to around $2.60 million.
To conclude, JTO may be trading in a correction phase of the bullish move it had in the middle of this month. However, a potential continuation is uncertain, as most of the metrics were down significantly at press time, except the OI.
Final Summary
- JTO’s price has been trading around a critical level, where a break above would mean continuation while a breakdown would extend the correction.
- Most of JTO’s on-chain and derivative data have been declining, but traders remain interested.