, Bitcoin (BTC), XRP and Shiba Inu (SHIB) Price Analysis for June 16: Volatility Spike Brings Back Possibilities")
Despite the recent recovery from the June lows, BTC is still clearly in a medium-term downtrend.
A high-volume capitulation move resulted from the price’s abrupt breakdown from the $75,000-$78,000 range and rapid decline toward the $60,000 area. The current recovery doesn’t seem to be a confirmed trend reversal, but rather a relief rally.
The price is still below the downward-sloping 20-day, 50-day, 100-day, and 200-day moving averages. This alignment shows that the market structure is strongly bearish.
Solana (SOL), Bitcoin (BTC), XRP and Shiba Inu (SHIB) Price Analysis for June 16: Volatility Spike Brings Back Possibilities
Whales Go on XRP Buying Spree
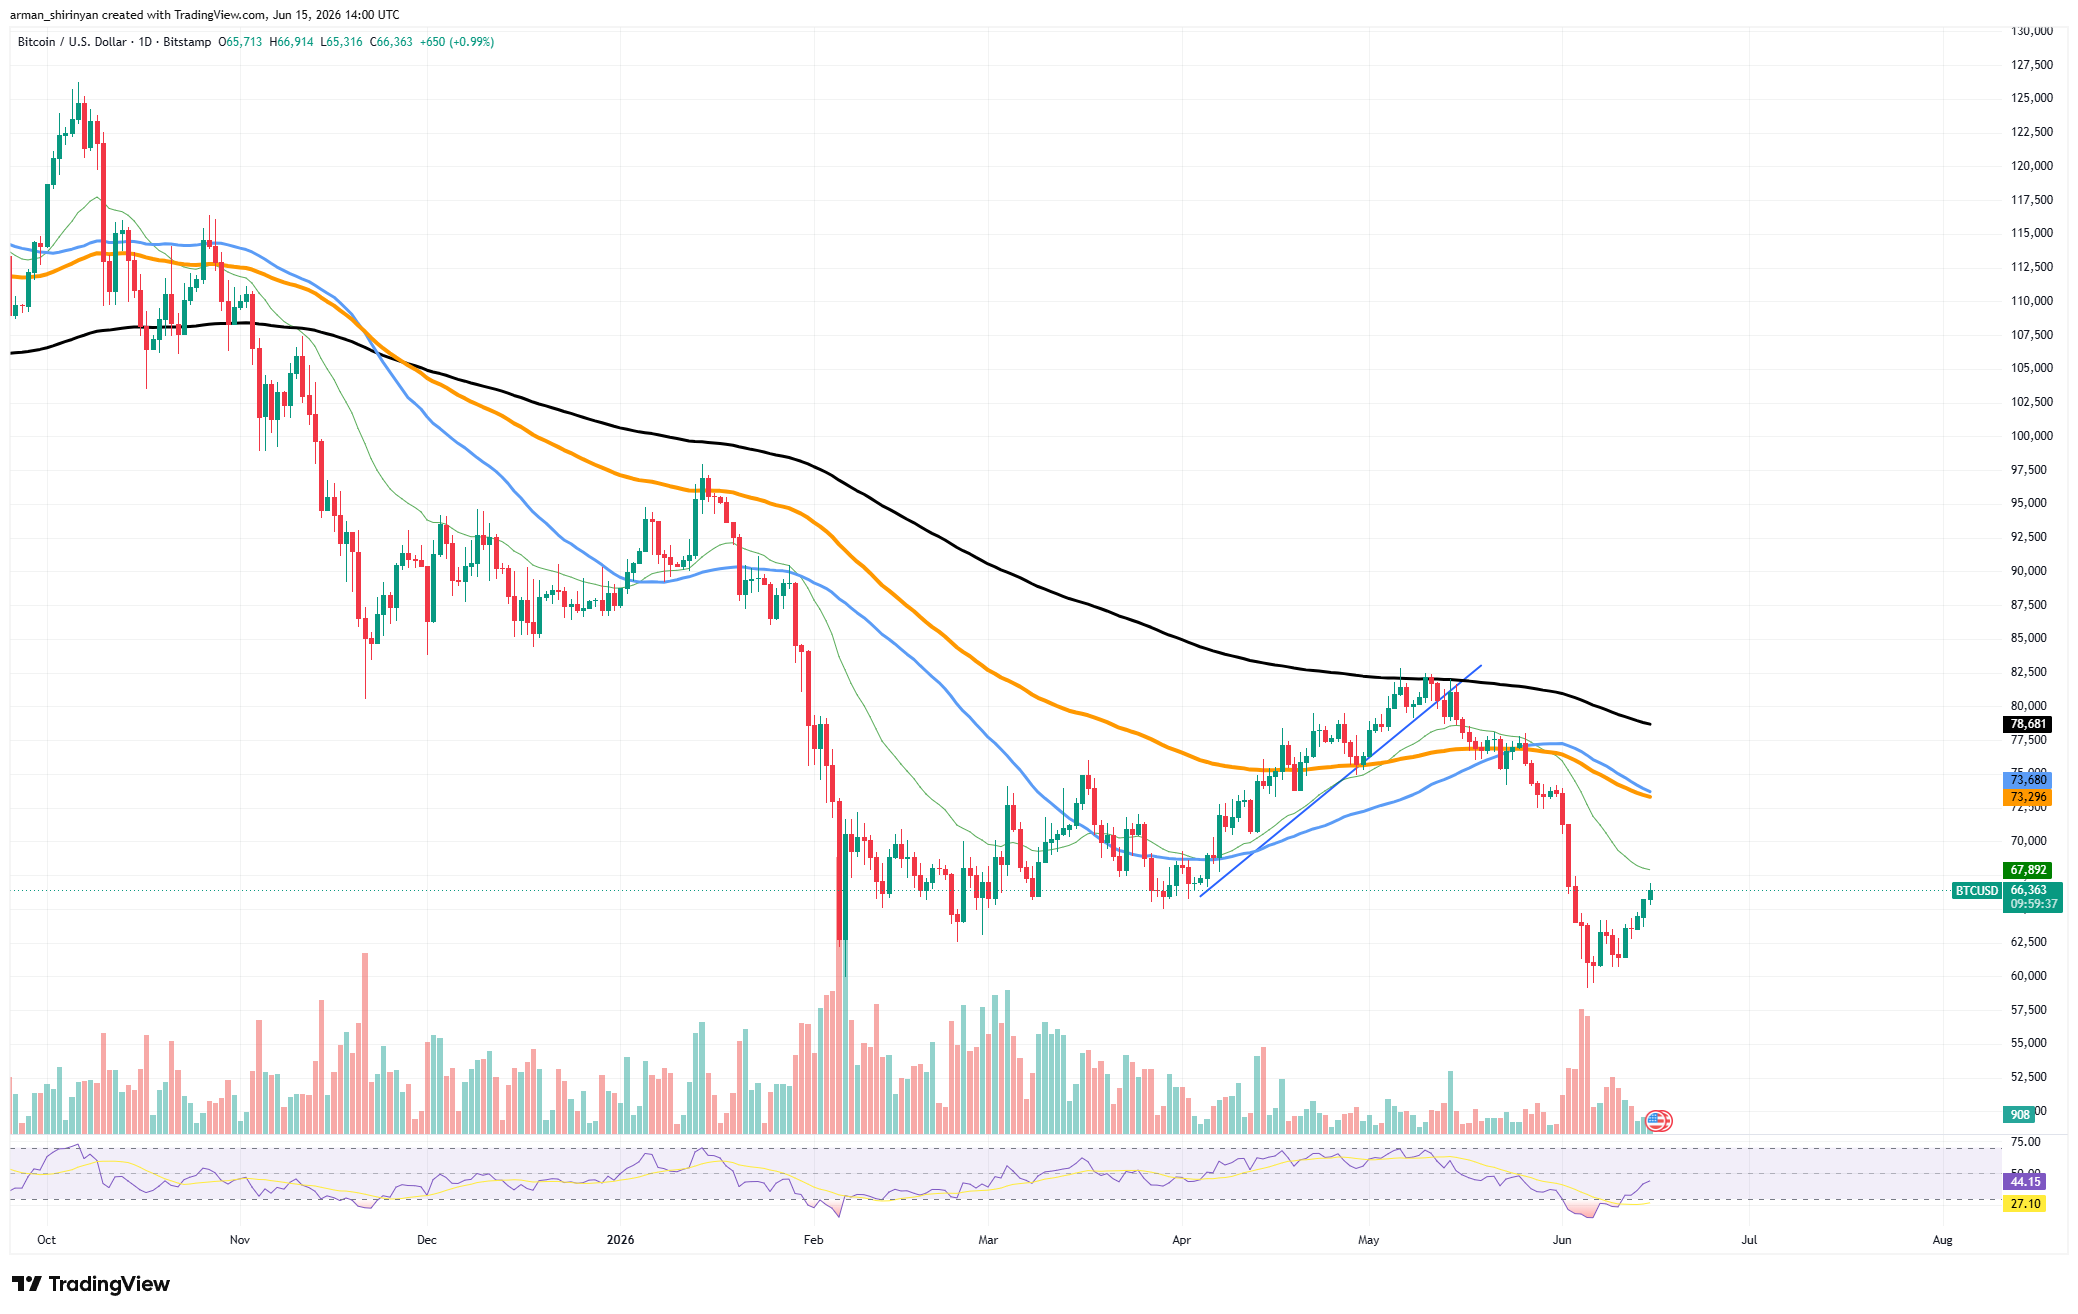
The most significant resistance zone is located between the 20-day EMA at $67,000 and the 50-day SMA at $74,000. To indicate that buyers are regaining control, there would need to be a consistent move above these levels. Until then, sellers wishing to sell their positions might be drawn to rallies.
Although bullish momentum has not yet been established, the RSI has recovered from oversold territory and is getting closer to the neutral 50 level, suggesting that downward momentum has subsided.
The recent low of about $60,000 continues to be the primary support on the downside. Losing that level would probably result in another leg lower and expose deeper support zones.
All things considered, Bitcoin seems to be in a countertrend bounce within a larger bearish trend. Before a more optimistic outlook is warranted, bulls must recover the moving-average cluster.
Solana’s progress
Due to its strong correlation with the broader cryptocurrency market, SOL’s structure is strikingly similar to that of Bitcoin.
SOL experienced a major breakdown that drove the price from the upper-$80s into the low-$60s after months of lower highs and lower lows. Although the price has recently increased and is now closer to $74, the recovery is still technically risky.
The price is still below all major moving averages, and the 20-day EMA, which is located between $74 and $75, is serving as immediate resistance. Above that, a dense resistance zone is created by the 50-day SMA at $81 and the 100-day SMA at $85, which may restrict upward movement.
You Might Also Like

The distance between SOL and the restoration of a long-term bullish structure is highlighted by the declining 200-day moving average near $102.
The RSI is approaching the midpoint and has recovered significantly from oversold conditions, indicating that sellers may have lost some short-term control. Still, momentum is neither bullish nor bearish.
A move toward the low-$80s is conceivable if SOL can recover and maintain its position above the $75 mark. The likelihood of another test of the recent lows around $63-$65 would increase if resistance is not broken.
For the time being, SOL is still in a bearish primary trend, with a short-term recovery attempt underway.
XRP’s breakthrough attempts
After breaking below a multi-month declining triangle, XRP is trying to rebound.
Before sellers forced a breakdown, the chart displayed a lengthy period of compression between a declining resistance trendline and about $1.25 support. Buyers eventually intervened after that move pushed XRP toward the $1.05-$1.10 range.
The price has recently recovered to the previous support area around $1.22-$1.25, which is encouraging. The general trend is still negative, though.
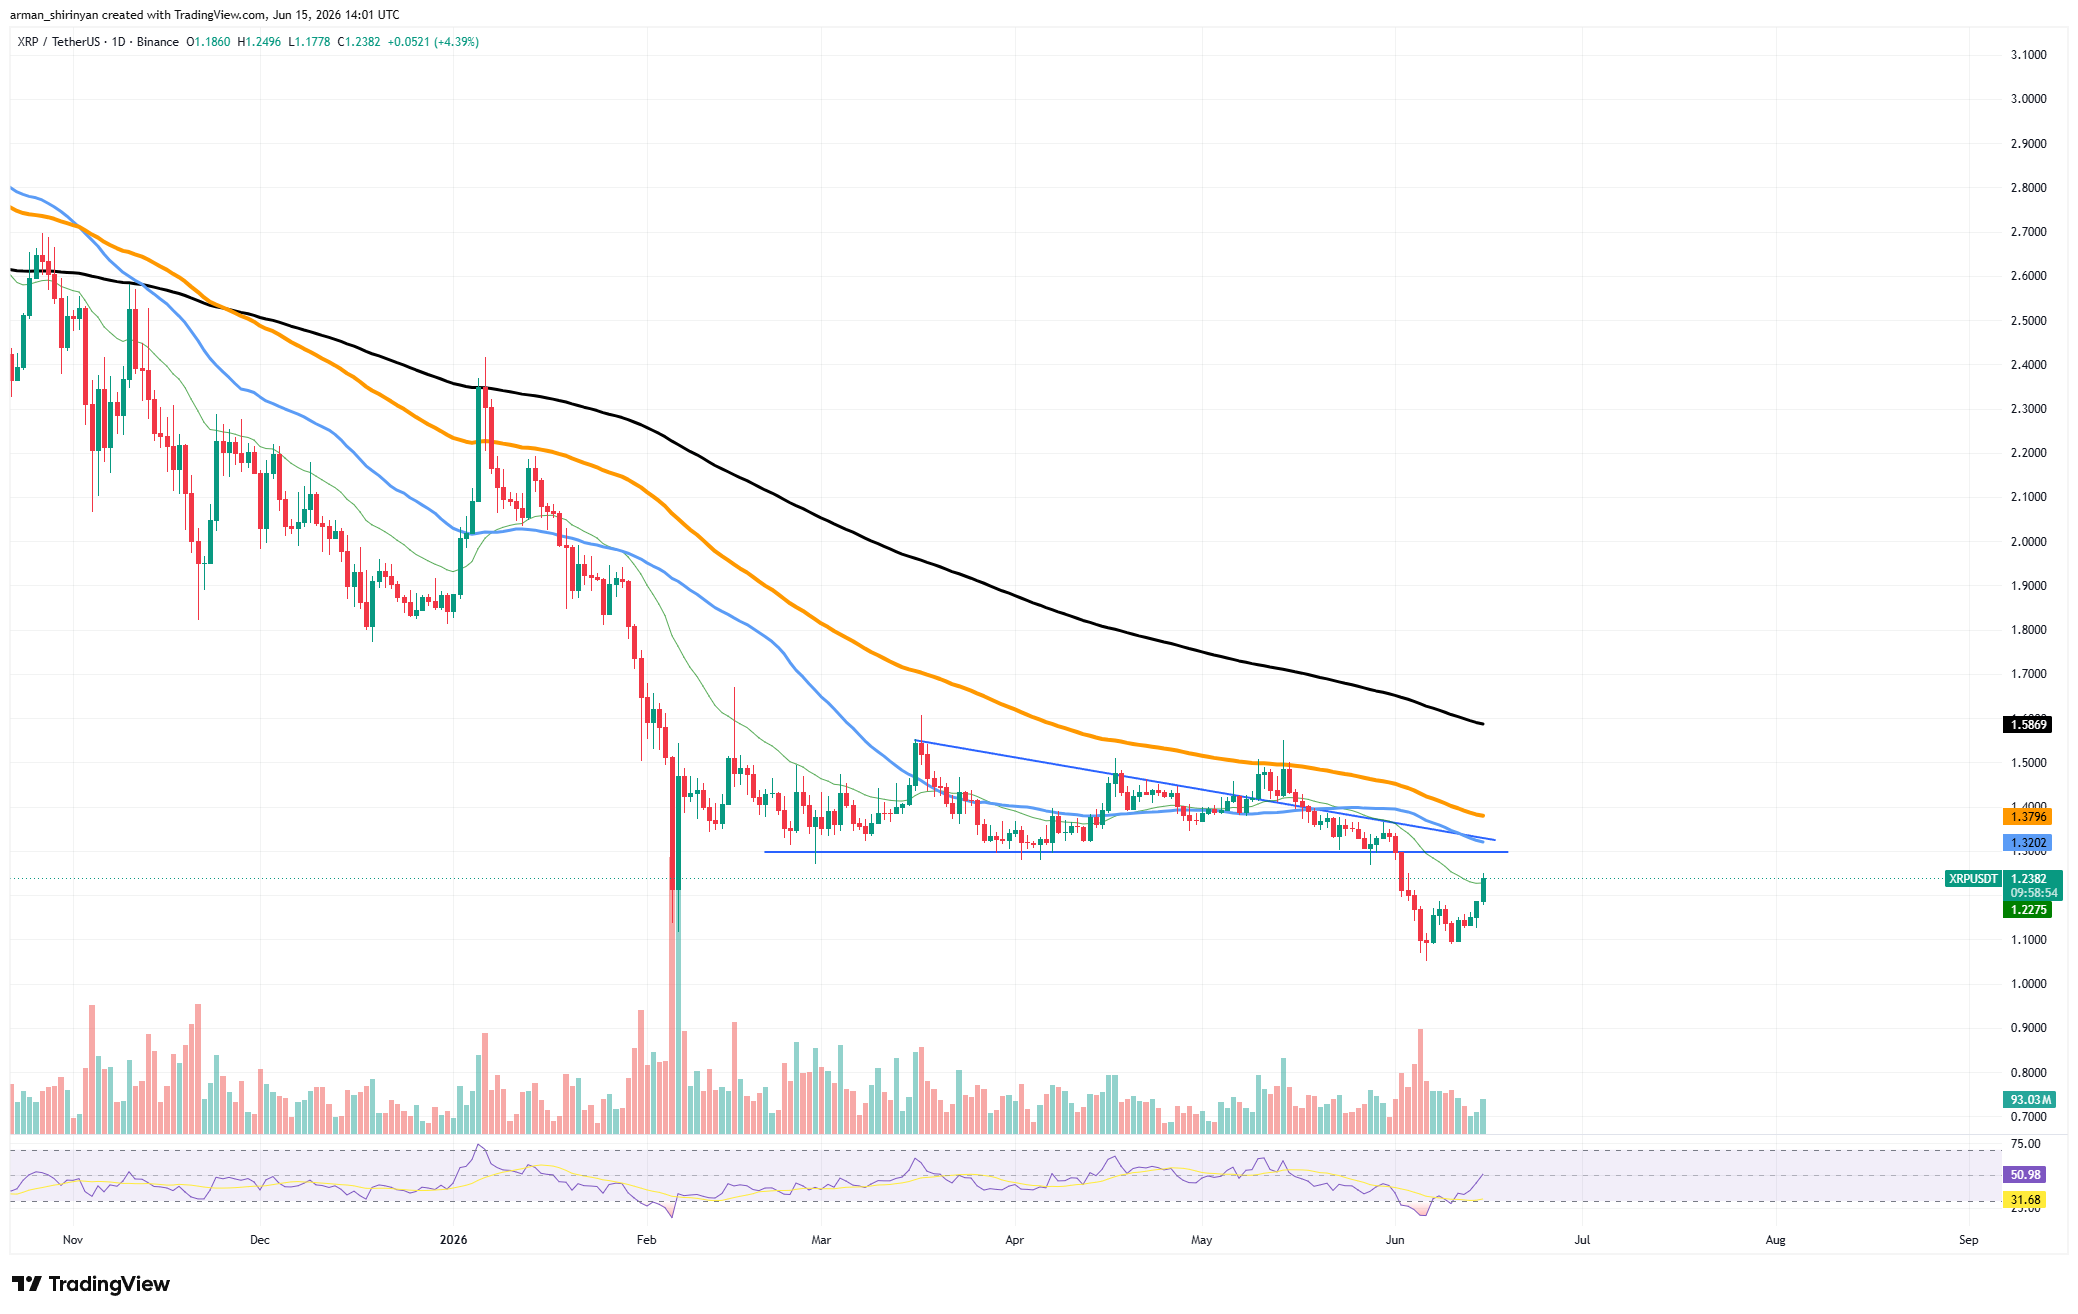
XRP continues to trade below its 20-day, 50-day, 100-day, and 200-day moving averages, all of which are still declining. The 20-day EMA is currently the first significant test for bulls, while the 50-day SMA around $1.32-$1.38 represents stronger resistance.
Volume increased during the selloff and continued to rise during the recovery, indicating genuine involvement as opposed to a purely technical rebound.
After entering oversold territory, the RSI has risen above 50, suggesting increasing momentum. However, to verify a longer-lasting trend reversal, a move above the 50-day moving average would be required.
The rebound may reach $1.35-$1.40 as long as XRP stays above the previous triangle support at $1.22. The possibility of a return to the recent lows would increase if that level is not maintained.
Rather than the beginning of a new bull phase, the current structure supports a brief recovery within a longer downtrend.
Will SHIB attempt a recovery
Among the assets examined, SHIB has one of the weakest structures. For several months, the price formed a rising wedge with convergent upward-sloping trendlines. The pattern was validated by the subsequent breakdown, which also caused a precipitous drop toward the most recent lows at 0.0000045.
Although SHIB has returned to 0.0000051 after the most recent bounce, the recovery is still premature and unproven.
The 20-day EMA serves as immediate resistance, and the price is still below the entire moving-average stack. Beyond that, further obstacles are created by the 50-day and 100-day averages, which may limit upside growth.
You Might Also Like

Momentum is an advantage. The RSI is approaching the neutral 50 area after making a significant recovery from oversold conditions. This indicates a significant decline in bearish momentum.
Additionally, volume increased during the capitulation move and the recovery that followed, suggesting that buyers are trying to set a floor.
Reclaiming the broken wedge support near $0.0000055-$0.0000057 is the main goal for bulls. A more extensive retracement in the direction of the moving-average cluster might be possible with a successful recovery above that range.
SHIB may return to its recent lows if volume declines and the price stalls below resistance.
Although the chart is still favoring a bearish primary trend overall, it is beginning to show indications of a technical rebound following a protracted decline.