 Reach Bottom? Hyperliquid (HYPE) Price Bounce Begins, Bitcoin (BTC) Stabilizes at ,000: Crypto Market Review")
- Hyperliquid isn’t done yet
- Bitcoin finds a foundation
Shiba Inu has experienced yet another notable sell-off, pushing toward new local lows and breaking below a multi-month ascending channel. The meme coin finally gave up after weeks of steady decline, prompting many investors to wonder if SHIB has finally reached its lowest point.
Technically speaking, there are indications that the market might be getting close to an exhaustion point. The Relative Strength Index (RSI), which has dropped below the crucial 30 threshold and is presently in oversold territory, is the most prominent indicator. These readings have historically suggested that bearish sentiment may be waning and that selling pressure has grown excessive. Though not always complete trend reversals, relief rallies have frequently preceded previous oversold conditions on SHIB.
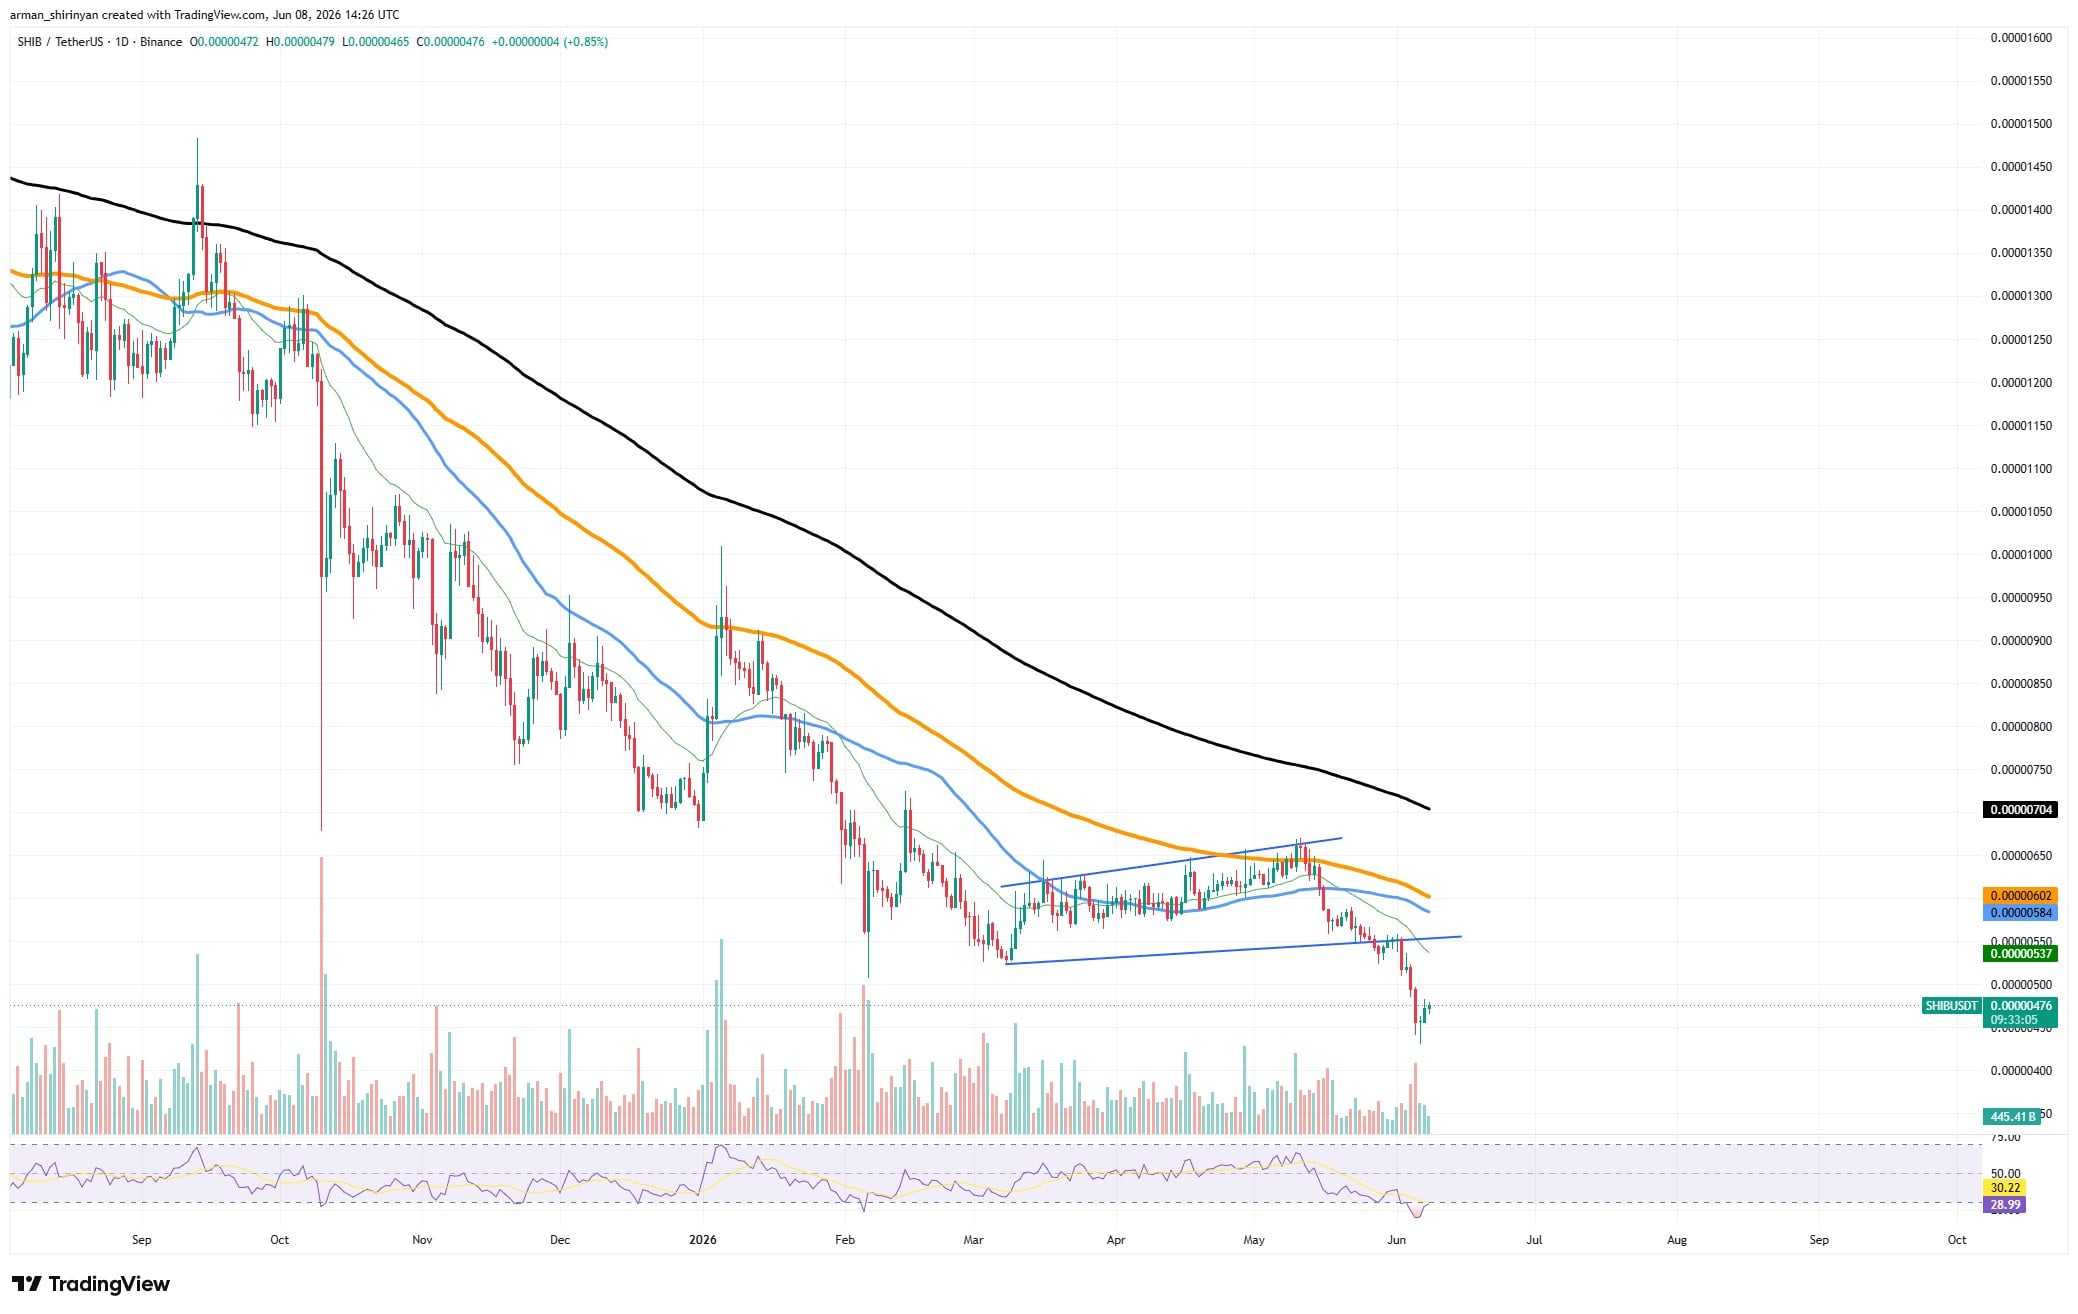
A significant percentage of weak hands may have already left the market, according to price action. A wave of liquidation-driven selling was sparked by SHIB’s recent break beneath the lower boundary of its ascending channel, which accelerated losses. Instead of signaling the start of a decline, such breakdowns often indicate its end.
Did Shiba Inu (SHIB) Reach Bottom? Hyperliquid (HYPE) Price Bounce Begins, Bitcoin (BTC) Stabilizes at $60,000: Crypto Market Review
Pew Research: 1 in 5 Americans Now Uses Crypto
However, oversold conditions should not be interpreted by investors as proof that a bottom has already been reached. Volume is a major concern. Although there was a spike in activity due to the breakdown itself, the first attempt at recovery was made with comparatively low participation.
Strong buying volume is usually necessary for sustainable recoveries in order to verify that fresh demand is entering the market. Any recovery without that confirmation runs the risk of turning into a short-term relief rally rather than the beginning of a long-term uptrend.
Also, the general trend is still negative. The 50-day, 100-day, and 200-day moving averages are all sloping downward, and SHIB is still trading below them. Bulls are still at a disadvantage until the asset regains at least the 50-day moving average in the vicinity of $0.0000054-$0.0000055.
Hyperliquid isn’t done yet
After a significant decline from its recent all-time high area around $76, Hyperliquid’s native token HYPE is exhibiting signs of renewed strength. Buyers have returned to the market after an aggressive sell-off that momentarily drove the asset below $60. This has led to a significant recovery. As of this writing, HYPE has shown one of the best daily performances among the major cryptocurrency assets, recovering toward the $65 range.
After an incredible rally that saw HYPE rise from below $30 in February to more than $75 in early June, there was a recent correction. The most recent decline seems to be the first significant test of bullish conviction since the trend accelerated, and such swift advances seldom happen without periods of profit-taking.
You Might Also Like

Technically speaking, the rebound is taking place in a key area. Buyers are still active on weakness, as evidenced by the asset’s quick recovery from a brief dip below its 21-day moving average. More significantly, HYPE keeps trading well above its 50-, 100-, and 200-day moving averages. Shorter-term averages are positioned above longer-term ones, and their alignment is still very bullish.
Additionally, the overall uptrend is still in place. HYPE has adhered to an upward trendline since late February, which keeps pushing the market higher. Although that structure was briefly threatened by the recent correction, buyers were able to protect the trend before a more serious breakdown could occur.
Additionally, momentum indicators lend credence to the recovery story. The Relative Strength Index is currently in the mid-50s after cooling from earlier overheated levels. Compared to the overbought readings observed during the run toward all-time highs, this position is better for the market because it leaves room for another leg higher without experiencing momentum exhaustion right away.
Right now, the $65-$66 range is the crucial level that traders should keep an eye on. A clear breakout above this area might pave the way for a retest of $70 and, ultimately, the most recent peak, which was close to $76.
Bitcoin finds a foundation
After one of the biggest drops of the current market cycle, Bitcoin seems to be regaining its footing. The biggest cryptocurrency is currently trying to stabilize around the psychologically significant $60,000 level after a sharp decline that sent Bitcoin from above $80,000 to almost $60,000 in a matter of days.
It appears that sellers may finally be losing momentum based on the recent price action. Bitcoin has started to establish a base around $60,000-$63,000 after a series of liquidations and panic-driven sales. The market has at least been able to stop the freefall that dominated trading during the previous week, even though it is too early to declare a clear bottom.
You Might Also Like
Momentum indicators provide one of the most compelling arguments for stabilization. The Relative Strength Index (RSI) has reached levels not seen in months, plunging far into oversold territory. In the past, readings below 30 have frequently shown that the market is open to a relief rally and that selling pressure has run out.
The stabilization thesis is further supported by volume behavior. A significant increase in trading volume coincided with the breakdown toward $60,000, indicating widespread market participant capitulation. Near local bottoms, these volume explosions often happen as weaker holders scramble to get out of positions. Before choosing their next major course, markets frequently go through a consolidation phase after this supply is absorbed.
Bitcoin is still in a technically precarious situation despite the new indications of stability. The asset is trading below its 50-, 100-, and 200-day moving averages, all of which are still pointing downward. Furthermore, BTC recently broke below an upward trendline that had sustained price movement since March, indicating a decline in market structure. Any attempt at recovery will therefore encounter significant overhead resistance.