
Bitcoin, the largest cryptocurrency by market capitalization, is down 0.54% on Monday to trade at $76,991. Despite the initial downtick, the Bitcoin price reflected underlying demand near $76,000 level, evidenced by a long-wick rejection candle. The buying pressure can be linked with continued accumulation of BTC from major market buyers and recent comment from U.S. president Donald Trump as he called off the the scheduled attack on Iran.
Bitcoin Rebounds After Trump Halts Iran Strike
Earlier today, the crypto market witnessed a notable selling pressure which pushed Bitcoin price to its intraday loss of $76,000. The drop occurred as U.S.-Iran tensions continue to intensify and Trump has previously threatened Iran, “the clock is ticking.
The sentiment shifted dramatically when Trump posted that the Emir of Qatar, the Crown Prince of Saudi Arabia, and the President of the UAE personally requested he stand down from a military strike on Iran that was scheduled for today.
Citing respect for these allied leaders and the fact that serious negotiations are now underway, Trump confirmed he has called off the attack — but with a sharp warning attached: U.S. forces under Defense Secretary Pete Hegseth and Joint Chiefs Chairman General Daniel Caine remain on standby for a full, large-scale assault at a moment’s notice should talks fail. A firm condition on the table is that any deal must guarantee no nuclear weapons for Iran.
The news caused a relief rally in all the risk assets, with BTC regaining its momentum and rising above $76,800.
Bitcoin’s Biggest Holders Keep Growing Despite Market Chaos
Data from Santiment shows that the number of Bitcoin addresses with triple-digit holdings has been rising steadily on-chain. The network has 20,229 wallets holding at least 100 BTC, which is equivalent to about $7.7 million at today’s Bitcoin price.
This number was 18,191 twelve months ago, representing around 2,000 new addresses on the heavy weight count in the last year, including Bitcoin’s all-time highs in the $127,000 area and its recent plunge in the $76,000 zone in response to geopolitical sell-offs.
The wallet count has surged in a fairly mild upward trend, while the price candles have a much noisier arc — with significant declines, rallies, and periods of renewed uncertainty stemming from macro and geopolitical events.
The reason the data is so visually clear is because price turbulence and wallet growth have been at odds, with large holders continuing to increase their holdings, rather than decreasing them, throughout the volatility.
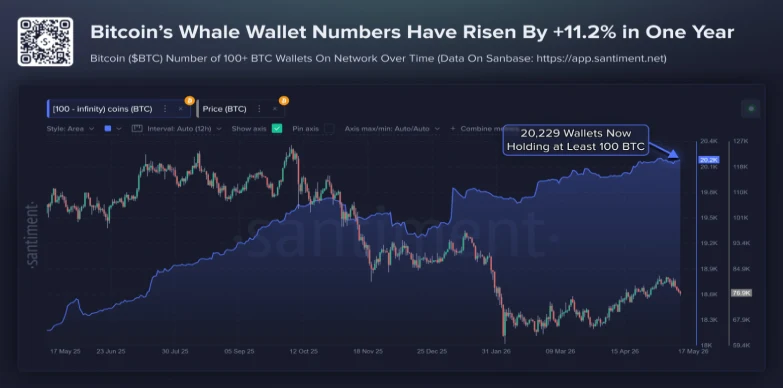
Historically, rising whale wallet counts are viewed as a sign that key stakeholders still have confidence in Bitcoin’s future value and scarcity.
Key Fibonacci Levels to Watch in Bitcoin Price Analysis
Over the past week, the Bitcoin price witnessed notable correction from $82,425 to current trading value of $76,901, registering a loss of 6.74%. Concerning the ongoing correction trend in BTC, this pullback shows a bearish reversal below the 38.2% retracement level of Fibonacci ratio, meaning the previous relief rally was shallow and likely replenished the selling pressure in market for next breakdown.
Theoretical, a retracement to the 50% and 61.8% FIB is considered healthy for a prevailing trend to maintain its dominant and a breakout beyond them could signal change in market direction. Therefore, any recovery in Bitcoin price must breach the $93,000 or $101,000 resistance level— coinciding with the aforementioned Fibonacci levels— to regain bullish momentum.
If the short-term market trend remains bearish, the Bitcoin price could breach below $75,000 support (23.6% FIB) to accelerate its selling pressure, and drive a deeper dive of roughly 4% to hit $72,300.
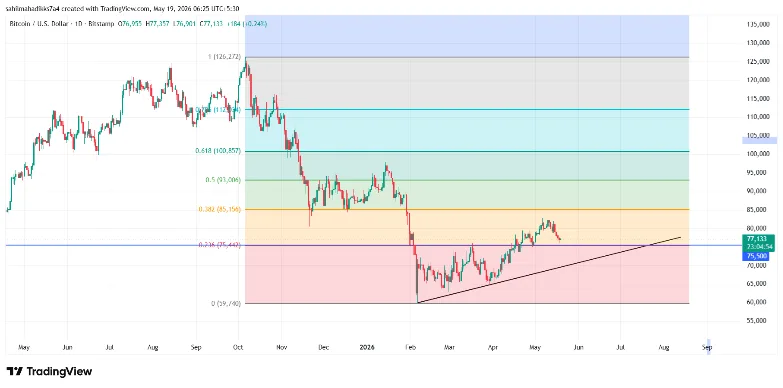
An emerging support trendline at this floor could bolster the next price trajectory of BTC.