
The pioneer cryptocurrency Bitcoin (BTC) plunged roughly 2.34% during Tuesday’s market hours to briefly plunge below the $80,000 mark. The primary catalyst to this downtick was higher-than-expected U.S. Consumer Price Index (CPI) for April and the persistent uncertainty regarding the U.S.-Iran conflict. Despite the overhead pressure, the high-networth investors continue to buy more BTC. will the Bitcoin price leap to $90,000 next or a fresh correction looming for market participants.
Bitcoin Whales Buy the Dip as Hot CPI Triggers BTC Sell-Off Below $81K
In the last two days, the Bitcoin price plunged from $82,361 to $80,762, registering a roughly 2% loss. This pullback marked BTC’s second reversal from the $82,500 region amid the escalating geopolitical tension in the middle east, as on May 11, Donald Trump hinted at a failed peace proposal with Iran. In the oval office he described the fragile ceasefire between the U.S. and Iran as being on “massive life support,” renewing market uncertainty around geopolitical outlook.
However, the selling pressure accelerated today following the disappointing inflation data the U.S. Consumer Price Index (CPI) for April came in higher than forecast, showing a 3.8% annual increase. This “ugly” inflation print dampened hopes for Federal Reserve rate cuts, causing a sell-off in risk assets like BTC and tech stocks.
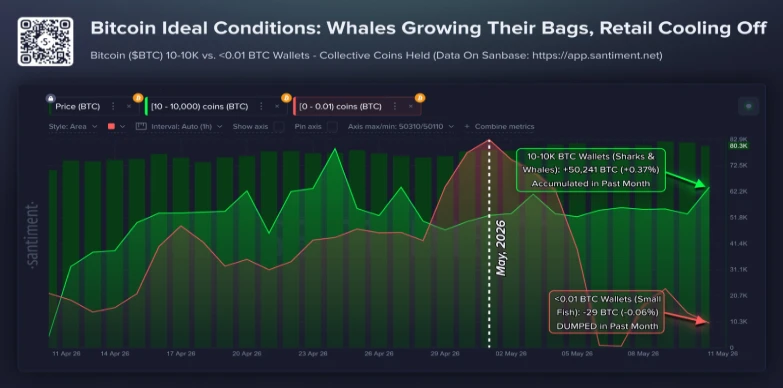
However, the Bitcoin price held steady above $80,000 on Wednesday after April’s CPI data came in hotter than expected. The on-chain data from Sanbase tells of a clear disparity of wallet activity throughout the month.
The addresses with 10 to 10,000 BTC in their wallets gained 50241 more, which is a 0.37% increase of their total. The smallest wallets, which had under 0.01 BTC, sold out 29 coins, leading to a decline of 0.06%.
The mid-tier group has its positions growing consistently in its charts on collective balances during late April and early May 2026. The smallest cohort saw a decrease in exposure during this time, and there was a significant decrease in exposure around early May. The data, which is also shown alongside price changes, reveals that bigger wallets continued to buy through the hotter than expected inflation reading, while smaller wallets withdrew.
This wallet size imbalance—where big wallets grow bigger and retail addresses shrink—has been observed in several stages of Bitcoin’s market cycles, signaling a potential rebound in price.
Here’s Why Bitcoin Price Stands at Make-or-Break Floor
The daily chart analysis of Bitcoin shows that the price is constantly pushing against the resistance trendline of a rising channel pattern. Since early February, a retest to the overhead trendline has acted as a pivot moment for Bitcoin, as historically it bolstered renewed selling pressure in the market.
The ongoing consolidation around the $80,000 mark signals a similar situation that could trigger a decisive breakout or drive extended correction in price. With today’s price drop, the Bitcoin price currently trades at $80,644.
If the bearish momentum persists, the BTC price could plunge another 2% and challenge the 20-day exponential moving average at $79,000. A bearish breakdown below this support would further accelerate the selling pressure and possibly drag the price another 7.5% down to hit $73,200 mark to retest channel support.
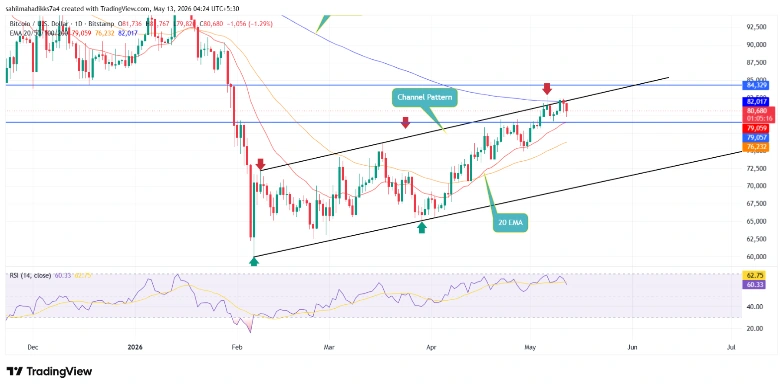
On the contrary, if the Bitcoin price continues to defend the $79,000 and 20-day EMA slope, the buyers could attempt a breakout above the 200-day EMA at $82,000 and strengthen buyers’ grip on the asset for a renewed recovery.