 Price Rally Might End at , Ethereum (ETH) Becomes Falling Star, Bitcoin (BTC) First ,000 Attempt in 380 Days: Crypto Market Review")
- Ethereum is falling behind
- Bitcoin’s attempt at $82,000
Over the past few days, Toncoin has produced one of the market’s biggest rallies, blowing through significant resistance zones and surprising traders with how quickly it moved. The price quickly recovered the 50, 100, and 200 EMAs after surging from a protracted accumulation range into a nearly vertical breakout.
Momentum is still very bullish on shorter timeframes as of right now. During the breakout, RSI moved far into overheated territory, while volume expanded rapidly. Technically speaking, the move represents a classic momentum squeeze, in which buyers flooded in at the same time that shorts became trapped.
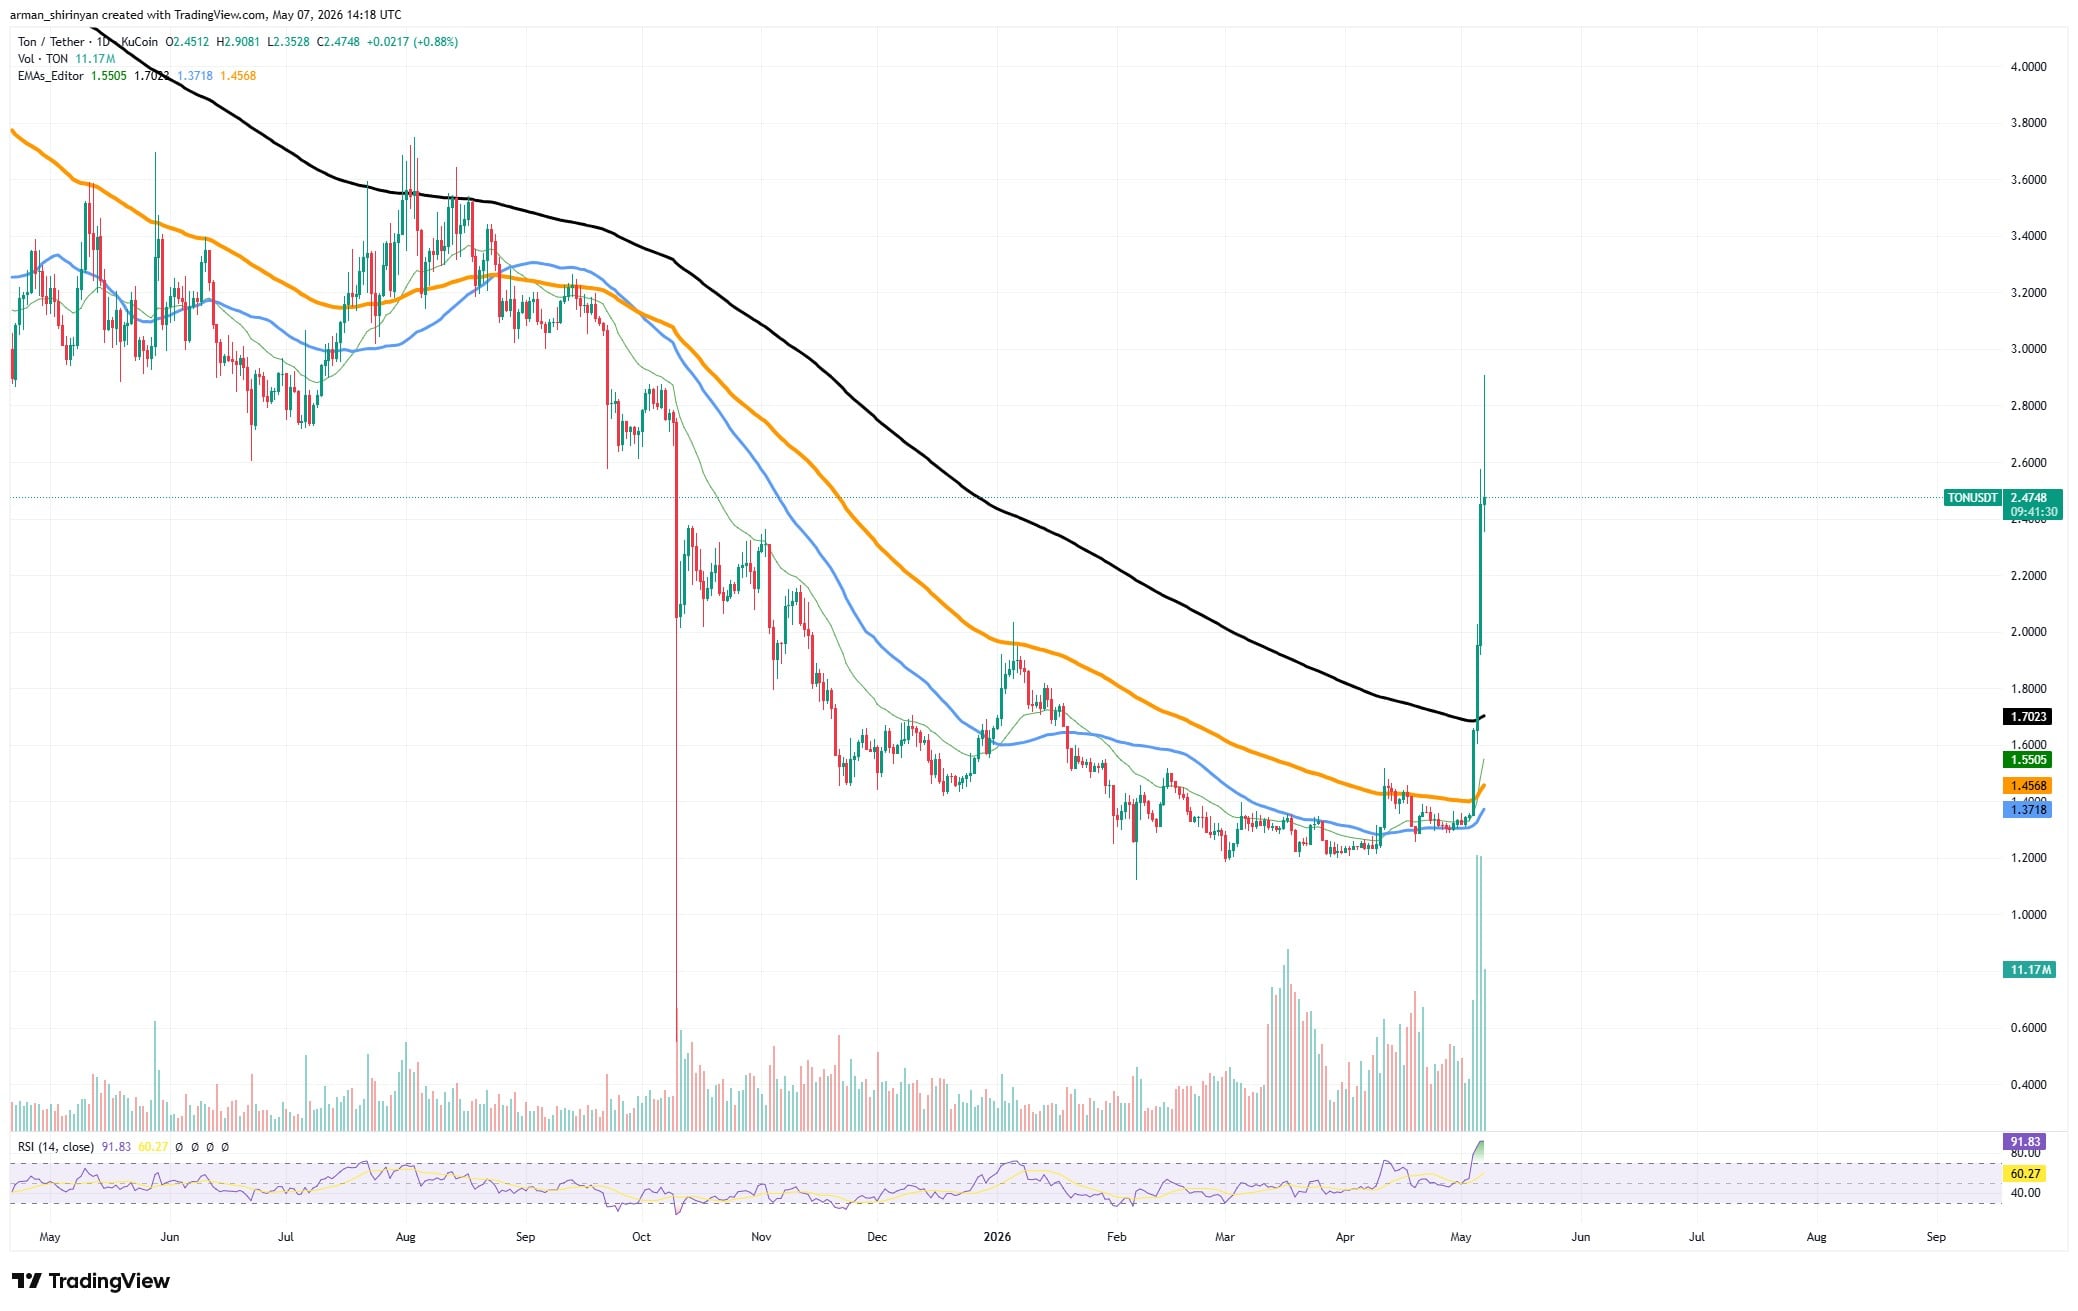
However, there are increasing indications that the rally may be nearing exhaustion in the vicinity of $3. The structure, as it is now, appears to be stretched. Rarely do vertical rallies last forever without significant corrections, particularly following such a rapid expansion from low levels. The likelihood of severe volatility and aggressive profit-taking is increased because TON is currently trading well above its recent average price range.
Toncoin (TON) Price Rally Might End at $3, Ethereum (ETH) Becomes Falling Star, Bitcoin (BTC) First $82,000 Attempt in 380 Days: Crypto Market Review
XRP Holdings Disclosed by World’s Leading Asset Manager
In fact, one of the main bullish factors driving the rally was this move toward more centralized coordination. Investors are no longer viewing TON as a completely autonomous blockchain experiment in reality. Rather, the market is beginning to perceive it as Telegram’s native infrastructure layer, connected directly to one of the biggest messaging platforms globally.
You Might Also Like

The story generated a lot of speculative interest and swiftly increased the amount of money invested in the asset. However, this also introduces new dangers. Once momentum slows, an ecosystem control-driven rally may become unstable. The Telegram narrative caused traders to enter the market aggressively, but speculative positioning can quickly reverse if sentiment declines.
Due to its alignment with a significant psychological resistance level, following an already prolonged move, the $3 area now stands out as a likely exhaustion zone. TON may aggressively retrace and return to earlier breakout zones much sooner than many anticipate if buying pressure wanes close to that area.
TON is still one of the most popular cryptocurrency assets at the moment. The issue is that, once momentum peaks, overheated markets often cool down violently.
Ethereum is falling behind
After a brief attempt at recovery, Ethereum losing steam agian. The chart now displays a bearish falling star setup, which may put fresh pressure on price action in the near future.
After a significant correction earlier this year, Ethereum has spent the last few weeks trying to stabilize. Short-term moving averages were regained by the price, which momentarily returned to the mid-$2,300 range. There was hope that ETH could eventually gain enough strength to take on higher resistance zones once more as a result of that recovery. Rather, momentum seems to be waning.
A falling star pattern can be seen forming directly beneath major resistance in the chart. This pattern typically emerges following an upward move, in which buyers push the price higher at first, but sellers eventually seize the initiative and force a rejection close to the top of the candle range. The outcome serves as a warning that bullish momentum may be waning prior to a successful breakout.
You Might Also Like

The overall structure of Ethereum still appears shaky. The 100 EMA overhead is still serving as resistance, and the price is still below the 200 EMA. Over the past few months, every significant rally attempt has failed to maintain follow-through, and ETH keeps printing lower highs on longer timeframes.
Additionally, the volume is still comparatively low in comparison to earlier stages of expansion. Ethereum currently appears to be more of a market trying to stabilize than one that is about to enter a strong bullish cycle.
Capital rotation within cryptocurrency itself is another issue. Meme coins, privacy assets, and Telegram-related ecosystems are examples of faster-moving sectors that traders are still pursuing, while Ethereum’s performance has appeared slower and less explosive in contrast. This reduces the short-term speculative momentum surrounding ETH.
However, sentiment could rapidly improve if ETH is able to reclaim resistance and disprove the pattern. But, for the time being, the market is being cautious.
Bitcoin’s attempt at $82,000
The price of Bitcoin is currently trying to recover the $82,000 range as it approaches one of its most significant resistance levels in over a year.
Following months of intense volatility and protracted weakness earlier this year, Bitcoin has been able to regain momentum and move back into a crucial region that may determine the market’s next stage. After plunging into the mid-$60,000 range during the February-March collapse, the current chart structure indicates a robust recovery.
A series of higher lows and higher highs has resulted from buyers gradually regaining control since then. Additionally, Bitcoin recovered the 50 and 100 EMAs, which reversed the short-term momentum in favor of bulls. The 200 EMA is currently being tested by the market close to the $82,000 mark.
You Might Also Like

That level is significant because, during the larger correction phase, it served as a significant dynamic resistance. Traders are keeping a close eye on whether Bitcoin finally has enough strength to break through, because previous rallies failed once the price got close to this zone.
At the moment, momentum indicators lean bullish. Volume improved during the most recent upward push, but RSI is still high without going into extreme exhaustion territory. This implies that participation is higher than it was during earlier unsuccessful recoveries. Resistance levels like this, however, hardly ever break cleanly on the first try.
Volatility in the $82,000 range is what investors should anticipate. The market as a whole will probably take it as confirmation that the correction phase is coming to an end if Bitcoin is able to close above it and turn the level into support. In that case, as confidence in cryptocurrencies recovers, BTC may swiftly aim for higher zones.
If rejection occurs instead, there’s a chance of another short-term retreat. Some traders may decide to lock in profits close to a significant resistance level following such a robust recovery from the lows.
The strength of Bitcoin is already having an impact on the larger cryptocurrency market. Alongside Bitcoin, altcoins began to rise, and risk tolerance has significantly increased in comparison to previous months. That typically occurs when investors think Bitcoin is taking back structural market dominance.