Litecoin (LTC), once known as the “silver to Bitcoin’s gold,” has badly underperformed the broader altcoin market since the 2018 bottom. While LTC is up over 300% in the past seven years, that pales compared to Ethereum and XRP, which gained more than 3,300% and 750%, respectively, in the same period.

Now, that may be set to change. A new Bloomberg Intelligence update shows Litecoin has the highest odds of winning spot ETF approval among major altcoins — potentially reviving interest in one of crypto’s longest-standing assets.
Litecoin is Leading Altcoin ETF Race with 90% Approval Odds
LTC, alongside the layer-1 blockchain, Solana (SOL), holds a 90% probability of gaining spot ETF approval in the US by the end of 2025, according to Bloomberg Intelligence’s crypto ETF dashboard. That places them ahead of XRP (85%), Dogecoin (80%), Cardano (75%), and Polkadot (75%).
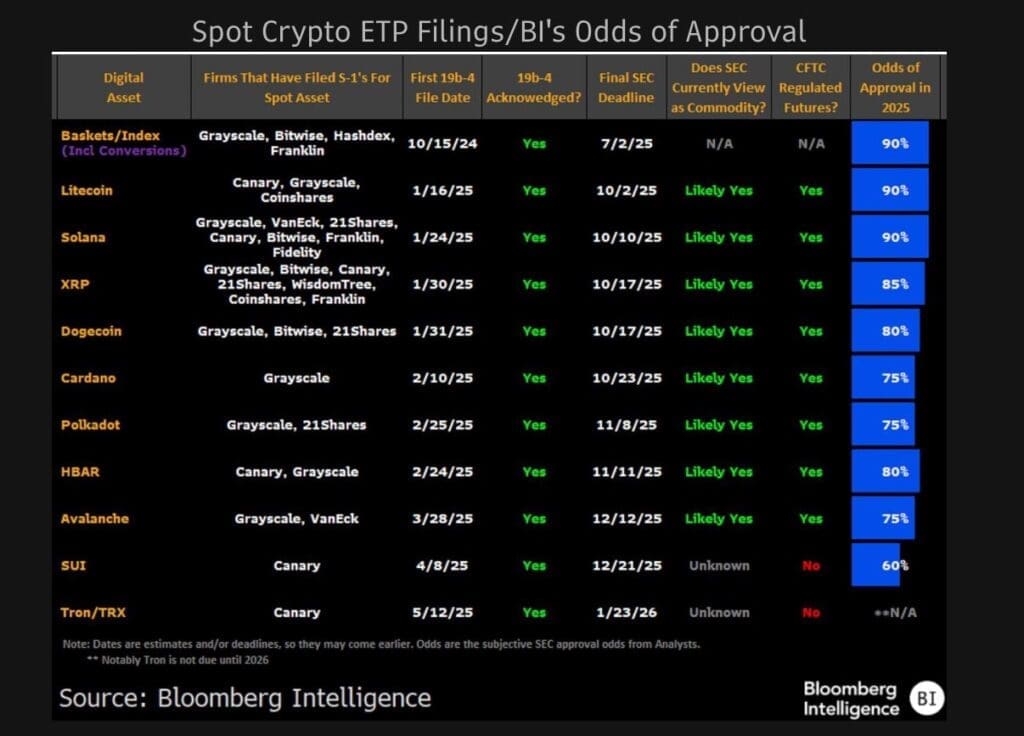
Litecoin enjoys a regulatory edge. The SEC likely classifies it as a commodity due to a proof-of-work consensus mechanism like Bitcoin, and the CFTC already regulates its futures. These key factors simplify the path to a spot ETF.
Grayscale, Canary, and CoinShares have all filed applications, with the SEC set to decide by Oct. 2, 2025.
Solana, although it shares the same 90% approval odds, faces a more complicated process. It lacks CFTC-regulated futures and hasn’t received a clear commodity designation from the SEC.
LTC Price Holds Key Support, Eyes $150 as Next Target
Litecoin is showing early signs of a bullish reversal after defending a critical multiyear ascending trendline support. The latest bounce also came just above the 0.786 Fibonacci retracement level (~$84.83), reinforcing this zone as a strong accumulation area.
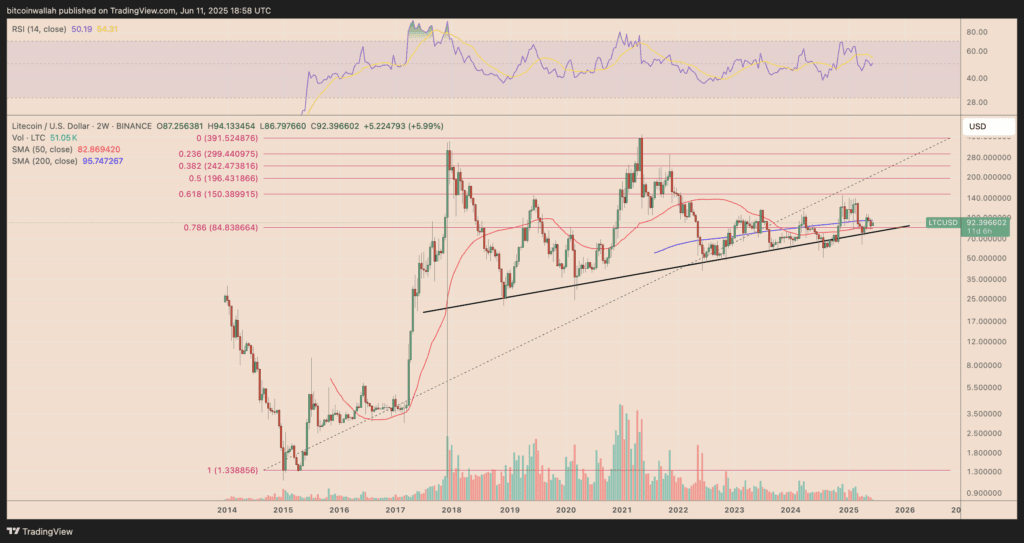
If the trendline holds, LTC could be setting up for a move toward the 0.618 Fib level near $150, which also coincides with a previous resistance range from mid-2023. This would mark a roughly 60% gain from current price levels near $92.
The 50-week and 200-week moving averages — currently near $83 and $95, respectively — are converging, forming a long-term decision point. A decisive breakout above this compression zone could fuel a larger upside push, especially if ETF speculation intensifies in Q3.
The relative strength index (RSI) on the two-week chart remains neutral around 50, suggesting room for price expansion without triggering overbought conditions.