
A recent report by Artemis confirmed that Tron leads stablecoin transaction volumes across key regions, including Latin America, Africa, North America, Europe, and Asia.
According to the report,
“The most popular blockchains employed to settle customer flows, as a share of value sent, were Tron, followed by Ethereum, Polygon (Ethereum L2), and Binance Smart Chain.”
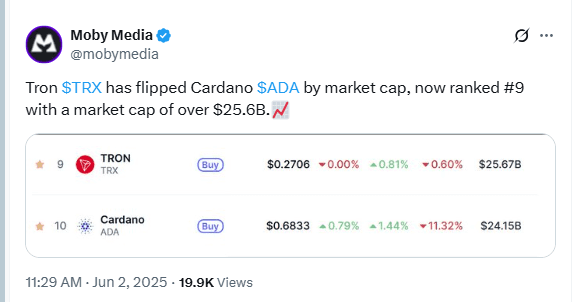
Alongside rising transaction volumes, Tron also gained ground in market rankings. It has now surpassed Cardano to become the ninth-largest cryptocurrency. As of the latest data, Tron’s market capitalization reached $25.6 billion, slightly ahead of Cardano’s $24.1 billion.
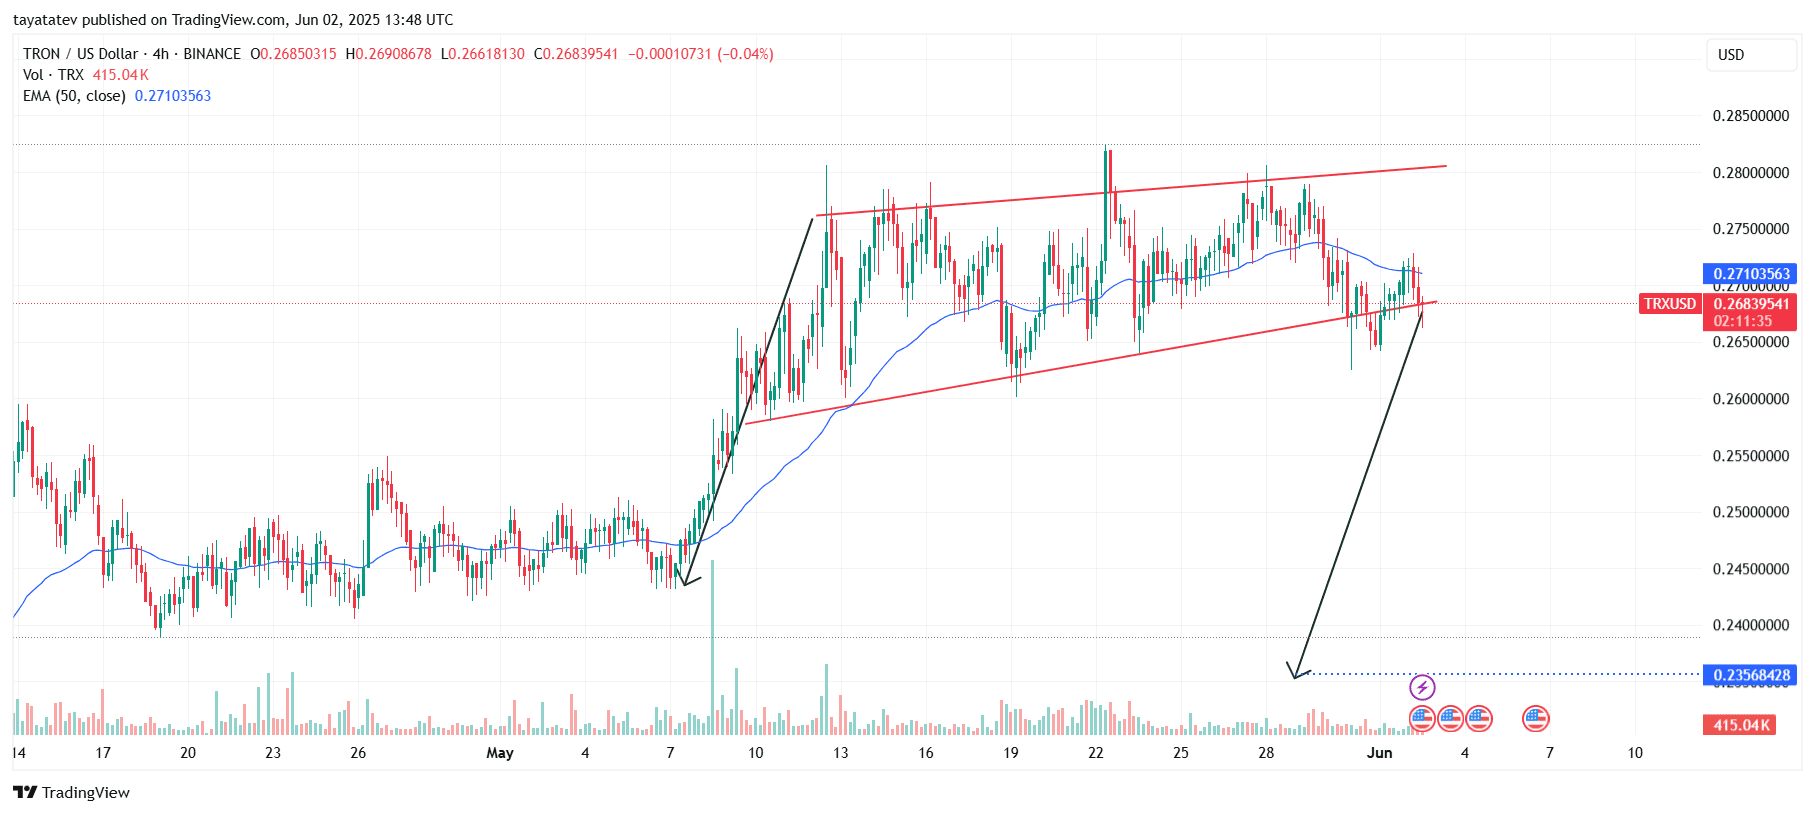
On June 2, 2025, the 4-hour TRON (TRX/USDT) chart on Binance formed a bearish rising wedge pattern.
A bearish rising wedge appears when price moves between two converging upward-sloping trendlines. It often signals weakening momentum and a potential downside reversal. In this chart, the structure developed after a strong rally, followed by narrowing upward moves.
TRX is now trading at $0.2683. If this pattern confirms with a clean breakdown below the lower trendline, the price could drop approximately 12%, targeting the $0.2356 level. The projected target is marked on the chart with a downward arrow.
The price has already broken below the 50-period Exponential Moving Average (EMA), which currently sits at $0.2710. This breakdown adds further pressure. Volume shows no major spike yet, but continuation could accelerate if sellers gain control.
In short, if the bearish wedge confirms, TRX risks a move toward $0.2356 in the short term.
TRON RSI Dips Below Midline, Bearish Pressure Builds
As of June 2, 2025, the 4-hour RSI for TRON (TRX) sits at 43.19, with its moving average at 44.24. This places the RSI below the neutral 50 mark, signaling growing bearish momentum.
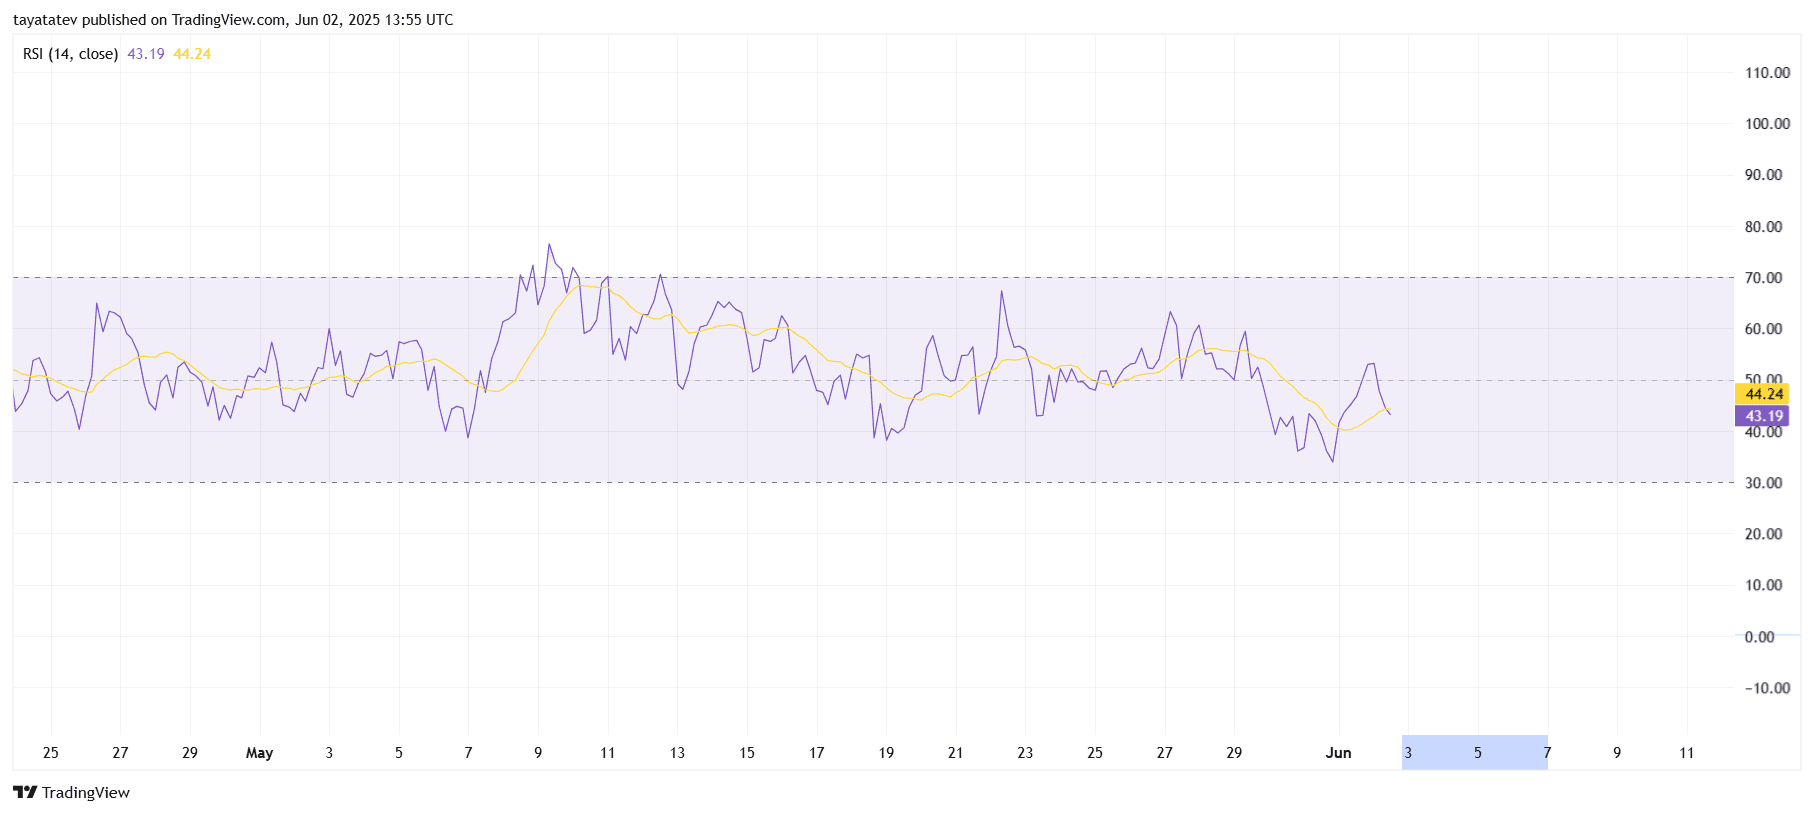
The RSI has trended sideways throughout May but consistently failed to reclaim strong bullish territory above 60. Each rally attempt faced resistance, while the most recent rejection near 50 reinforces the current weakness.
Since the RSI remains in the lower half of the channel and stays under its moving average, TRX may continue facing downward pressure unless bulls regain strength. If the RSI drops closer to 30, it could indicate oversold conditions.
TRON BBTrend Signals Strong Bullish Momentum
As of June 2, 2025, the BBTrend indicator for TRON (TRX/USDT) reads 9.16, showing strong bullish momentum. The indicator has stayed above the zero line since mid-May and has continued climbing, reflecting sustained upward pressure.
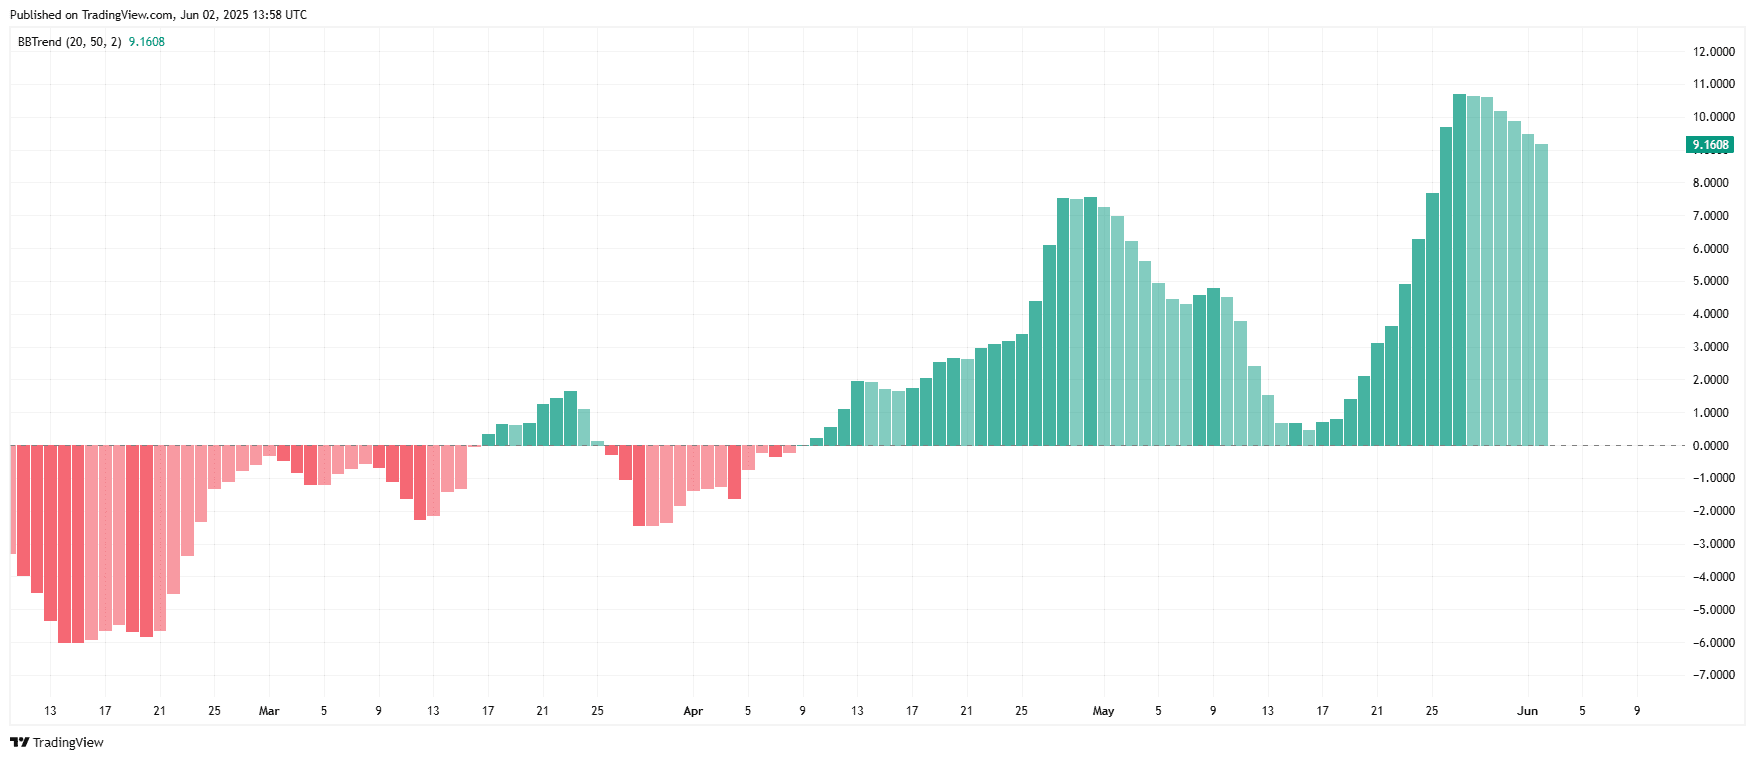
The recent uptrend began around May 23. The BBTrend bars grew sharply, peaking near 11 before slightly pulling back. Despite this minor drop, the bars remain tall and green, confirming that bulls are still in control.
Before this rally, the indicator had dipped below zero in early May but reversed direction quickly. The current structure suggests a healthy uptrend. However, if the bars shrink further or flip red, that would be an early sign of weakening momentum.