




TLDR
- US spot Bitcoin ETFs posted $462.7M in net outflows last week, ending three straight weeks of inflows
- Ether ETFs recorded $196.9M in net inflows over the same period, led by BlackRock’s $148.8M Friday surge
- The ETH/BTC ratio is up over 25% in Q3, its highest quarterly gain since Q3 2025
- Ethereum’s Q3 ROI is approaching 60%, close to its all-time Q3 record of over 66%
- Price action for both assets remains uncertain, with key moving averages acting as support and resistance levels
US spot Bitcoin ETFs recorded $462.7 million in net outflows last week, snapping a three-week inflow streak. At the same time, Ether ETFs pulled in $196.9 million, raising questions about where institutional money is heading.
Spot Bitcoin ETFs Saw $463 Million in Net Outflows Last Week, Ending a Three-Week Inflow Streak
From Sept. 7 to Sept. 11 (ET), spot Bitcoin ETFs recorded $463 million in net outflows, ending a three-week streak of net inflows. Spot Ethereum ETFs saw $197 million in net inflows,… pic.twitter.com/JbA8yLme2D
— Wu Blockchain (@WuBlockchain) September 14, 2026
The Bitcoin ETF outflows ran across four straight trading sessions, from Tuesday through Friday. Thursday was the worst day, with $282.7 million leaving Bitcoin funds in a single session, the largest daily outflow since July.
ARK 21Shares Bitcoin ETF led the withdrawals with $234.2 million in outflows. Grayscale’s Bitcoin Trust ETF followed with $129.1 million. BlackRock’s iShares Bitcoin Trust ETF shed $52.5 million, and Fidelity’s Wise Origin Bitcoin Fund lost $50.7 million.
Despite last week’s reversal, Bitcoin ETFs are still positive for September overall, sitting at around $307.3 million in net inflows month to date.
Ethereum ETFs Draw Steady Interest
On the Ethereum side, flows were mixed early in the week before turning sharply positive on Friday. BlackRock’s iShares Ethereum Trust ETF led that day with $148.8 million in inflows, followed by the 21Shares Core Ethereum ETF with $29.1 million.
The Ethereum ETF data lines up with a broader Q3 trend. The ETH/BTC ratio is up over 25% this quarter, its highest quarterly increase since Q3 2025. Ethereum’s Q3 return on investment is approaching 60%, just short of its all-time Q3 record of over 66% set last year.

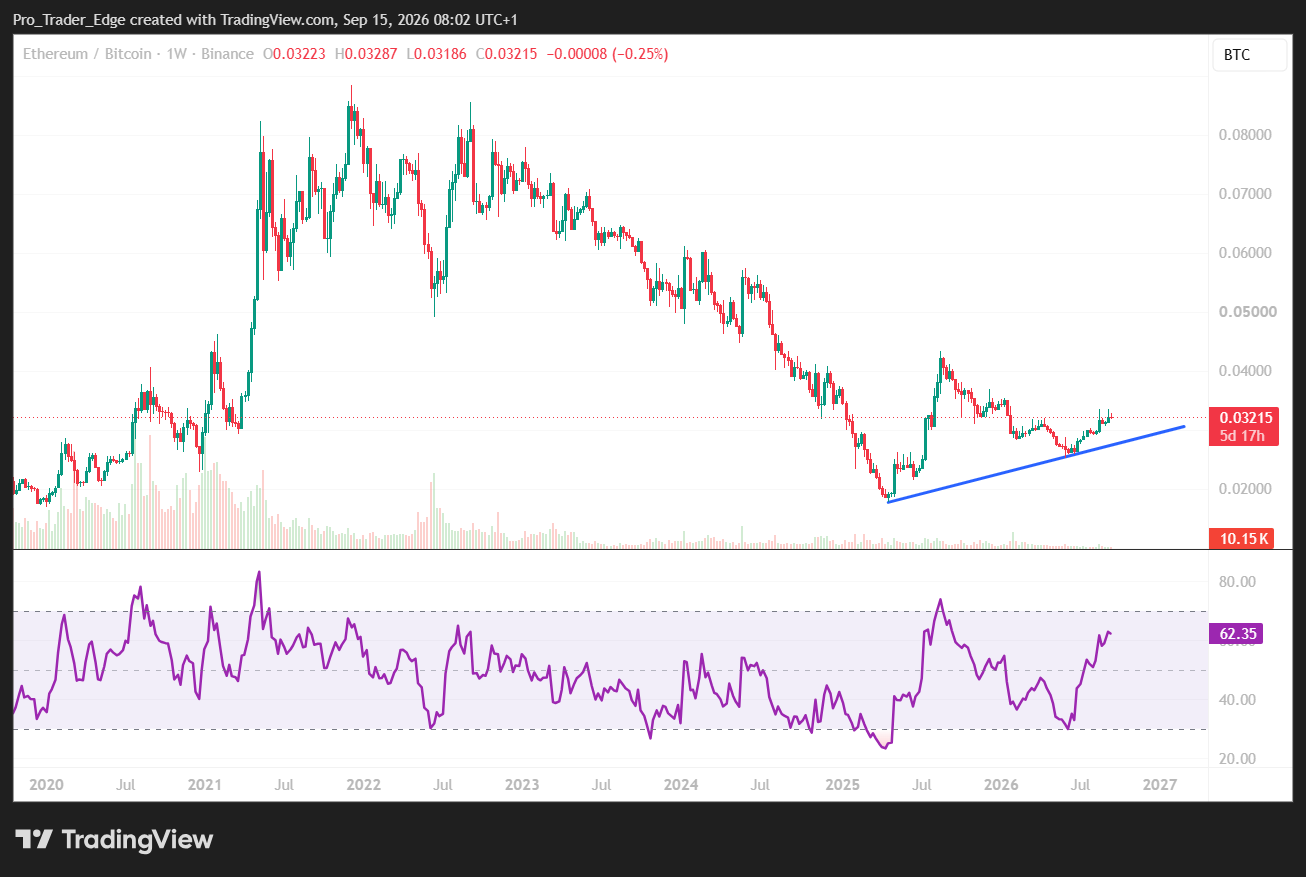
Ethereum’s market dominance is also up over 25% on a quarter-over-quarter basis, while Bitcoin’s dominance grew by just 1.5% over the same period.
Price Action Still Uncertain
Despite the flow data, price action for both assets has not confirmed a clean rotation.
Bitcoin dipped to $76,370 during the week but found support above its 100-hour moving average at $77,290. It has since pushed toward its 200-hour moving average around $78,151, with the price sitting near $78,200 as of Monday morning.
Ethereum dropped to $2,402 before bouncing sharply to $2,666, a gain of roughly 7.75% in a few hours. However, that move has since been almost entirely reversed, with the price back near $2,510, just above its converged 100- and 200-hour moving averages at $2,494 and $2,497.
For Ethereum to show real strength, analysts say it needs to break and hold above the $2,531 to $2,567 resistance zone.
Analysts note that one week of ETF divergence could reflect portfolio rebalancing or profit-taking rather than a lasting shift. Several consecutive sessions of Ethereum inflows alongside Bitcoin outflows would be needed to confirm a true rotation.
Both assets are attempting to stabilize, but neither has broken key resistance levels convincingly.