


Every trading day for Ethereum [ETH] spot ETFs has resulted in net inflows since the 12th of August. Twelve trading days of inflows amounting to over $1.5 billion were a substantial amount of capital flow, helping explain the rapid price gains of the leading altcoin.
Analytics platform Arkham observed that BlackRock’s clients have purchased over $1 billion without any days of net selling. In 9 days, BlackRock’s ETHA spot ETF has purchased $1.02 billion of Ethereum.
ETF inflows of this scale showed demand was strong, but is it enough to send ETH prices sailing past $2.5k?
Aggressive Ethereum sell pressure is being absorbed above key onchain support
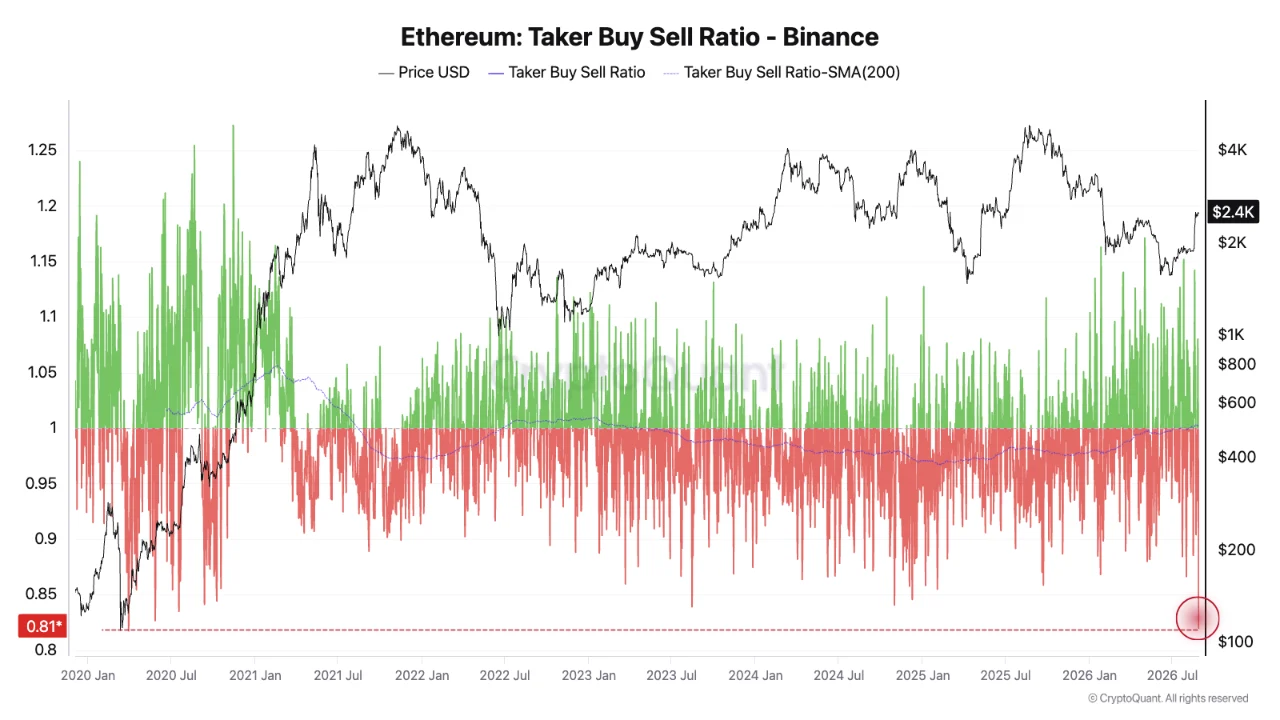
The Ethereum taker buy/sell ratio fell to 0.81 on Binance, one of the most extreme readings in history. It meant that the aggressive (market order) sell volume was roughly 23% higher than the taker buy volume, observed crypto analyst Moreno.
Despite high sell pressure on the derivatives front, ETH was trading just below the $2.5k round-number level. It would be a strong bullish sign if the ratio normalizes and the price remains around $2.5k.
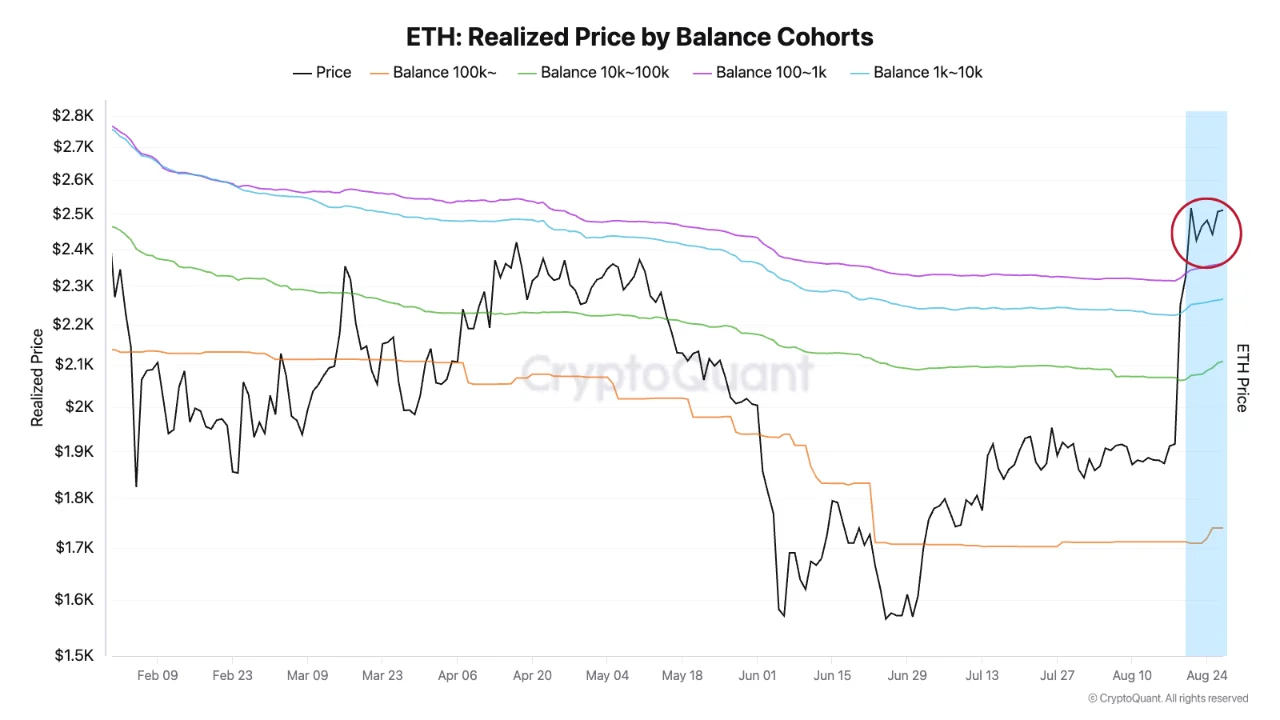
Looking at the realized price of various ETH balance cohorts, the analyst highlighted the $2.26k-$2.35k cluster as the cost basis of the largest wallets. The market price is above the aggregate cost basis of even these largest holders.
This meant that every displayed cohort held unrealized profits to varying degrees.
A price collapse below key cost basis levels would imply seller dominance. An uptick in Open Interest, alongside aggressive selling pressure, would mean a severely bearish scenario.
As long as the $2.3k area is defended, bulls can remain confident that selling pressure was being absorbed.
Short-term range formation brings worries of distribution
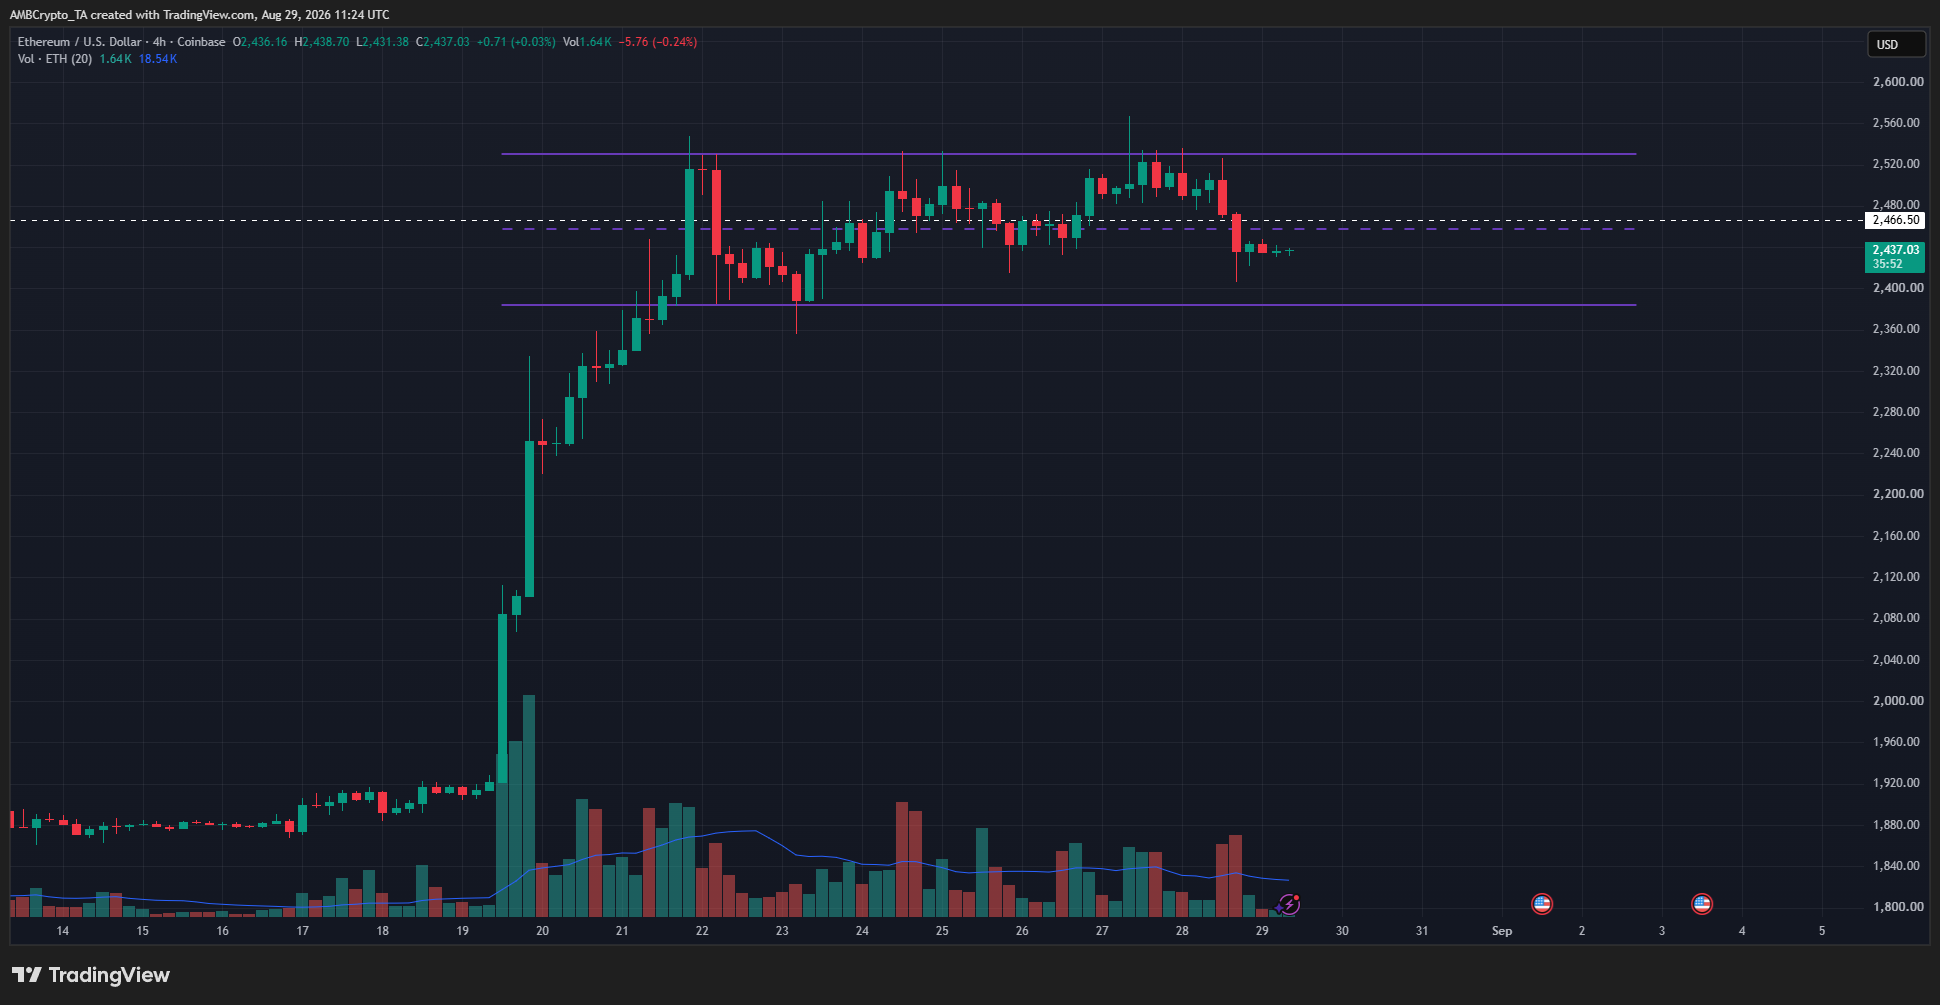
Ethereum has formed a range between $2,383 and $2,530. A consolidation phase after a period of explosive gains, especially right around the $2,466 swing high from June, was a worry of a distribution phase.
Options data showed that market participants were betting on an Ethereum price rally in September. A breakout past the $2,530 local range high would be the first sign for bulls to keep an eye on.
Final Summary
- The streak of Ethereum spot ETF inflows indicated firm demand, but derivatives data showed aggressive selling at the same time.
- A short-term consolidation phase has interrupted the upward momentum, and a breakout past $2,530 is needed to signal the next upward impulse move.