Hedera Hashgraph’s native HBAR token whipped up 5.25% gains on Friday during the broader crypto market bounce back. As Bitcoin (BTC) closely approaches $80,000 for the first time in months, major-cap alts are feeling the bullish energy: Ether (ETH) scorched near $2,400 while XRP emerged as the top gainer with a 18.9% daily spike.
Double-Bottom Breakout Crawls Toward This Neckline
For HBAR, the prolonged consolidation period concluded when the altcoin rose from $0.072 to $0.076, achieving a price trend break. That’s evident on the one-day charts, crypto analyst Gopal argues. The seasoned market technician spotted a juicy double bottom figure on HBAR’s one-day charts, with $0.07 acting as key support here.
Sponsored
Crypto Prediction Markets
18+ · Gambling involves risk. Play responsibly.
In the longer perspective, Gopal aims at $0.40 as the highest breakout target from this structure. To seek for confirmation, HBAR bulls are looking into the $0.21 – $0.22 range. If this neckline breaks, the $0.40 target remains intact, but Gopal says a price reversal to the late 2025 rally needs to happen first, potentially lifting HBAR up 300%.
Digging into the one-day candlestick charts, DailyCoin’s dedicated research team could confirm the price trend switch within the Parabolic Stop & reverse (SAR) metric. Typically, the SAR index, portrayed as blue dots in the HBAR price chart, gives out a ‘sell’ signal if they manifest above the realized price.
Parabolic SAR Delivers a ‘Buy’ Signal On HBAR Charts
In HBAR’s current case, the last day printed the Parabolic SAR below price – technically a ‘buy’ signal has been issued. However, here’s where the SuperTrend comes into play. This price monitoring tool places a ‘green label’ which HBAR bulls have to beat in order to get bullish confirmation.
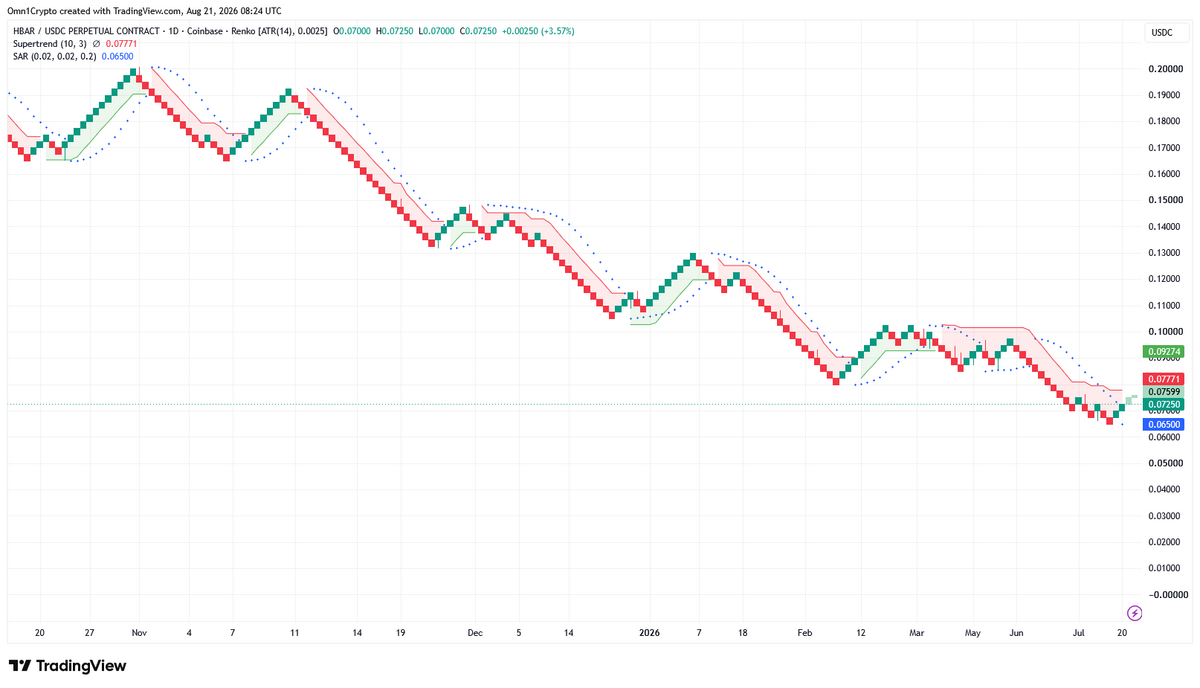
With the green line pointing to $0.092, this resistance level will be crucial before any solid attempts at the aforementioned $0.21 – $0.22 long-term confirmation zone. Another great indication for that is the Chaikin Money Flow (CMF), flashing positive levels in the nearer time-frames, while the one-day view still leans on bearish bias.
On The Flipside
- Hedera’s Spot market volumes kept below $150 million despite the 5% uptick on Friday.
- That’s considerably smaller than similar-ranking peers like Shiba Inu or Avalanche (AVAX).
Why This Matters
Technical analysis provides a rational perspective into the digital asset’s price movement without taking hype into consideration.
Check out DailyCoin’s hottest crypto scoops today:
Bitcoin Price Breakout: U.S. Treasury Pivot Sparks Rally Above $69K
Global Bond Yields Hit Multi-Decade Highs. What It Means for Bitcoin
DailyCoin’s Vibe Check: Which way are you leaning towards after reading this article?