

XRP is laying right on the edge of a classic liquidity setup. Chart watchers have flagged a clear imbalance on the heat-maps: almost all the visible resting liquidity near current prices is red, clustered just below the $1.00–$1.03 zone. In trader speak, that usually means the path of least resistance is way lower, at least in the short term.
Sponsored
Crypto Prediction Markets
18+ · Gambling involves risk. Play responsibly.
Price is hovering around $1.03–$1.04 after a multi-month grind lower. On both the hourly and daily charts, the green and blue buy-side pockets have thinned out, leaving a notable band of red liquidity underneath. When that happens, markets often “hunt” those levels to flush out leveraged longs before any meaningful rebound can take hold.
▸ Live tracker
Follow every XRP institutional move in real time
Bank pilots, ETF flows, ODL volume & more — all in one place.
Open XRP Live Hub →
Why The Red Liquidity Plays a Killer Role
Liquidity heatmaps typically don’t predict direction with certainty, but they do reveal where the stop orders and liquidation clusters are sitting. Right now the densest pocket sits below spot markets.
Analysts tracking these maps argue that XRP may still need to dip another 10–15% to clear that zone cleanly — potentially testing the high $0.80s or low $0.90s — before sellers run out of fuel.
The alternative is preferably less dramatic: a sharp rejection at current levels that leaves the red liquidity untested. That would be the cleaner bullish scenario, but it requires buyers to step in and absorb the remaining overhead supply.
Compression Meets Ultra-Thin Order Books
XRP has been coiling in a relatively tight range for weeks while broader crypto markets digest regulatory delays and security headlines. Thinning XRP liquidity on the upside combined with concentrated liquidity below creates the classic setup for a liquidity sweep.
Once those lower clusters are taken out, the same heatmaps often flip and start showing denser liquidity higher up — the kind of structure that can fuel a sharper recovery. Now, XRP’s price is standing right on the middle-tier Bollinger Band (BOLL), depicted in blue line in the price chart below.
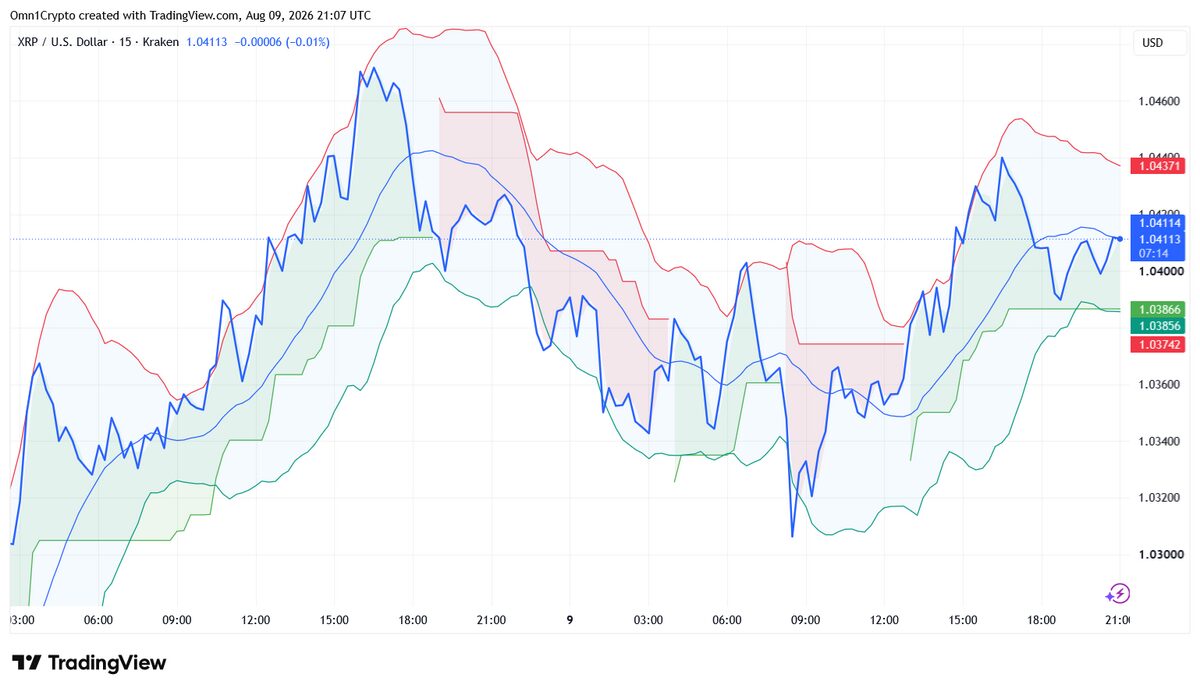
The SuperTrend indicator has flipped bullish for nearly 12 hours. However, for now the tape is still cautious. XRP remains well below its earlier 2026 highs near $1.40, and the $1.00 handle has become a psychological and technical battleground.
Whether the next move is a quick stop-hunt lower or a decisive hold here will likely set the tone for the rest of August.
Market aficionados watching the charts are treating the current levels as key decision time. The precise liquidity is mapped. The only question left is how aggressively the market decides to go hunting.
Liquidity hunts in crypto typically involve price sweeping clustered orders or stop losses before a potential reversal or continuation move.
Dive into DailyCoin’s hottest crypto news right now:
Wintermute Expands Into US Securities Markets With Broker-Dealer Registration
Clarity Act Vote Slips Again — Senate Punts Crypto Bill to September
DailyCoin’s Vibe Check: Which way are you leaning towards after reading this article?