
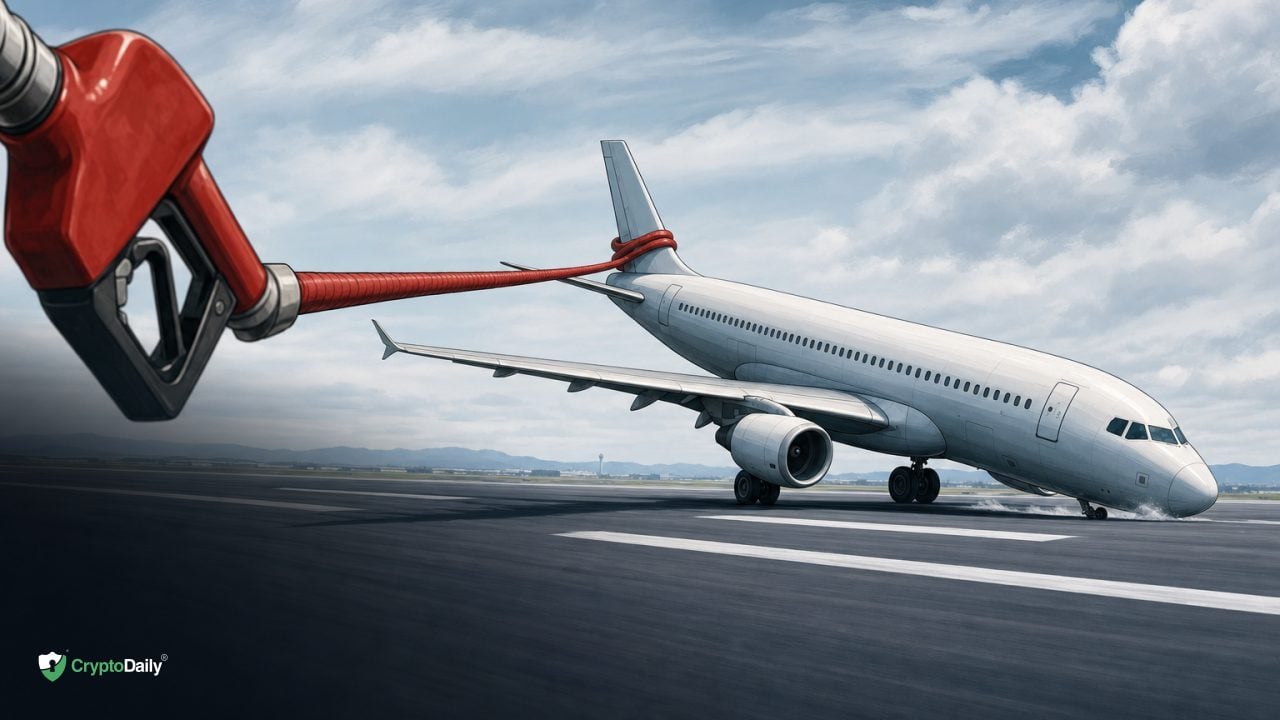
American Airlines cut its 2026 outlook and the stock slipped. The culprit isn’t demand, it’s the fuel bill. When jet prices jump, airline math gets tight fast, and American’s new guide shows just how quickly earnings can get compressed.
Investors woke up to a reset on July 23 and marked AAL lower in premarket trade after management narrowed the full-year range and flagged heavier fuel. The message was plain: higher jet prices are chewing through margins, and pricing alone won’t cover it immediately.
Let’s break down what actually changed, where the pressure is coming from, and what to watch into the back half of the year.
| Point | Details |
|---|---|
| 2026 earnings guide cut | Updated to ($0.65) to $0.65 adjusted EPS per diluted share on July 23, down from ($0.40) to $1.10 Reuters. |
| Fuel paid in Q2 | Average jet fuel purchase price of $4.05 per gallon in Q2 2026 Reuters. |
| Q3 fuel view | Based on the July 21 forward curve, American expects roughly $3.75 per gallon in Q3 and about $1.7B higher fuel expense year over year American Airlines press release (GlobeNewswire). |
| Q2 fuel expense spike | $4,881M in aircraft fuel and related taxes in Q2, up 83.3% YoY; total liquidity at quarter end was $11.3B American Airlines press release (GlobeNewswire). |
| Stock reaction | Shares were down roughly 4% in premarket trade following the update on July 23 Reuters. |
What actually changed in American’s 2026 math
Editor’s note: In Q1 and Q2 2026 I kept hearing the same refrain on earnings calls across travel and logistics: fuel got ahead of everyone’s pricing models. You could see it in the jet crack, not just crude. Airlines with newer fleets handled it better, but even solid operators were candid about lagging fare pass-through. On my desk, the correlation between energy spikes and risk assets tightened again for a stretch, with airlines and freight leading the reactions. The lesson I took is simple. When input costs are the story, liquidity buys time, but it doesn’t fix margins. The curve does. — Maya Sinclair
The headline is the new full-year adjusted EPS range: a band from a modest loss to a modest profit. Specifically, management reset guidance to ($0.65) to $0.65 per diluted share, a tighter and lower corridor than prior commentary of ($0.40) to $1.10 Reuters. In other words, the company now sees a wider chance of breaking even rather than putting up clear profitability for the year.
Why the change now? Because input costs moved faster than ticket yields. The company didn’t flag a demand cliff. It flagged fuel, which stepped up aggressively into Q2 and is sticking around into Q3 based on the forward curve commentary.
Fuel is the fulcrum: why jet prices swing earnings
Pretend an airline is a flying refinery output buyer. When jet fuel spikes, it’s immediate, it’s cash, and it’s hard to dodge. American said it paid $4.05 a gallon in Q2 2026 Reuters. For Q3, using the July 21 fuel curve, it expects about $3.75 per gallon, and on that basis, roughly $1.7 billion more in fuel expense year over year American Airlines press release (GlobeNewswire).
Jet fuel doesn’t always track crude cleanly. Refining margins and regional supply imbalances can lift kerosene prices even if oil is flat. That basis risk is why airlines can feel squeezed in a hurry. And unless you’re heavily hedged, you eat the move in near real time.
American also reported $4.88 billion in aircraft fuel and related taxes in the second quarter, up 83% year over year, which is the kind of line item that can override a lot of other progress in the P&L American Airlines press release (GlobeNewswire).
Where the numbers land on margins
The quick way to think about airline profitability is unit revenue against unit cost. Revenue per available seat mile needs to outrun cost per available seat mile. Ex-fuel costs can be fairly predictable over a quarter. Fuel throws the curveball.
American’s math right now says rising jet prices narrow that spread. Even if demand is fine, your margin per seat mile shrinks when every gallon is pricier. That shows up in the earnings range getting pulled closer to the flat line.
Liquidity buys time, not profits
The company ended Q2 with $11.3 billion of total available liquidity, which is a good cushion for operations, debt service, and flexibility if schedules need to shift American Airlines press release (GlobeNewswire). Liquidity is runway. It isn’t margin. It won’t fix a high fuel run rate, but it helps you avoid forced decisions at the worst time.
Pro tip: When you read airline results, look for the small line items that stretch when fuel spikes. Things like credit card processing, maintenance timing, and schedule buffers. They don’t make headlines, yet they nudge unit costs when the system runs hotter.
Pricing power helps, but not instantly
Can fares move up to offset fuel? Sometimes. But there’s a lag. Leisure demand is seasonal and price sensitive. Corporate travel tends to be steadier, yet contracts and negotiated rates mean the price pass-through isn’t instantaneous. Ancillary revenue helps, though customers notice bag and seat fees in a heartbeat.
Load factors vs yields
Airlines can choose to chase load factor or protect yield. In a fuel spike, protecting yield can make more sense, but it risks flying a few more empty seats. The mix matters. A full plane at weak yields can be worse than a slightly less full plane at strong yields when fuel is expensive.
What American can still control
Fuel prices are out of American’s hands, but there are still levers to pull. None are magic. Together they can cushion the hit.
- Capacity discipline: Trim less profitable routes or adjust frequencies where demand is soft or competition is irrational.
- Fleet efficiency: Favor newer, more fuel-efficient frames on long segments and optimize stage lengths to reduce fuel burn.
- Schedule reliability: Fewer cancellations and delays reduce wasteful fuel and crew repositioning costs.
- Ancillary mix: Nudge seat fees, bags, and priority services where the market will tolerate it without denting demand.
- Credit and co-brand economics: Lean on loyalty partnerships when ticket yields wobble. Cash flows from these deals can be sturdy.
- Hedging stance: U.S. majors generally run light hedges compared with some international peers. That reduces complexity but leaves more spot exposure when prices pop. The trade-off is real.
Fuel spikes reward fleets with better burn and networks that can shift capacity quickly. It’s less about heroics and more about a thousand tiny operating decisions compounding over a quarter.

How the market is reading the drop
The premarket reaction around negative four percent was the market saying this reset matters but isn’t existential Reuters. Investors have seen fuel cycles before. Still, airlines are cyclical and highly operational. When the guide moves this close to breakeven, equity holders start to re-rate the year and ask tougher questions about Q4 and 2027.
Peers often get pulled by the same macro tide. If jet fuel stays sticky, you tend to see a relative trade take shape. Carriers with better balance sheets or higher premium mix can get a valuation premium. Those with heavier debt or less room to flex capacity trade cheap for a reason.
Debt and lease obligations matter more when margins compress. Equity becomes a residual claim on a thinner pie. That’s why a guidance tweak can hit the stock even if planes are still full.
Signals worth watching into Q3
There’s a lot to monitor over the next few weeks. Some of it is obvious, some not so much.
- Jet fuel curve and crack spreads: Watch the jet-to-crude relationship, not just WTI or Brent. That spread is what hurts.
- Forward bookings and corporate RFPs: Are business itineraries holding and are corporates locking in travel for the fall, or pausing?
- Unit revenue commentary on earnings calls: Any signs of fare strength sticking after summer peaks?
- Operational reliability metrics: Completion factor, on-time performance, and cancellation rates. Efficiency is margin when fuel is high.
- Capacity updates: Any trims to shoulder-season flying or selective cuts to underperforming city pairs?
- Cash flow and capex cadence: How management sequences spending with liquidity at $11.3B and a higher fuel bill in Q3 American Airlines press release (GlobeNewswire).
Pro tip: If you follow airlines, build a simple tracker: spot jet price, 1–2 month forward, and a ballpark fuel burn per available seat mile. It won’t predict earnings to the penny, but it helps you sanity check guidance shifts.
Positioning around airline volatility
Airlines aren’t set-and-forget holdings. They can work when the cycle lines up, but they bite when inputs move against them. If you do anything here, have a plan and revisit it quickly when fuel jumps.
- Scenario plan: Sketch bear, base, bull for fuel and demand. What happens to margins if jet is 25 cents higher or lower for a quarter?
- Watch the balance sheet: Liquidity of $11.3B is a positive, but look at maturities, interest costs, and lease commitments too.
- Compare networks: Premium-heavy routes and fortress hubs can carry more fare power when costs rise.
- Avoid single-factor bets: Fuel can ease as fast as it spikes. Don’t extrapolate this quarter forever in either direction.
None of this is a recommendation. It’s just the checklist most investors use to decide if a selloff is a trade, a trap, or the start of a longer rerating.
Stay in the loop with market moves
If you follow how macro shocks travel through equities and digital assets, we cover these knock-on effects regularly at Crypto Daily. Clean, fact-based updates. No fluff.
Frequently Asked Questions
Why did American Airlines stock fall on July 23?
Because the company cut its 2026 adjusted EPS outlook and highlighted higher fuel costs, which compress margins. The reset tightened the range around breakeven and the stock traded down roughly 4% in premarket action Reuters.
What is the new earnings guidance?
American now expects full-year adjusted EPS of ($0.65) to $0.65 per diluted share, lower than the prior range of ($0.40) to $1.10, with the change driven largely by fuel costs Reuters.
How much did fuel costs rise?
Q2’s average jet fuel price was $4.05 per gallon, and using the July 21 forward curve the company expects about $3.75 per gallon in Q3. On that basis, third-quarter fuel expense would be around $1.7 billion higher year over year American Airlines press release (GlobeNewswire).
Did American report the actual Q2 fuel bill?
Yes. Aircraft fuel and related taxes totaled $4,881 million for Q2 2026, an 83.3% increase from a year earlier. The company ended the quarter with $11.3 billion in total available liquidity American Airlines press release (GlobeNewswire).
Does American hedge fuel?
Management didn’t detail a new hedging program with this update, and large U.S. carriers in recent years have generally run limited hedges relative to some international peers. That can leave more exposure when spot prices jump.
Can fare increases offset higher fuel?
Sometimes, but not immediately. Airlines can raise prices or adjust capacity, though there’s a lag and pushback from price-sensitive travelers. Yield protection helps, yet it rarely closes a big fuel gap in a single quarter.
What could improve the outlook?
Two things would help fast: a softer jet fuel curve and firm unit revenue as summer demand rolls into fall. Operational reliability and selective capacity trims can also support margins if fuel stays elevated.
Disclaimer: This article is provided for informational purposes only. It is not offered or intended to be used as legal, tax, investment, financial, or other advice.