


Audiera [BEAT] has ranked among the assets unable to withstand the bearish pressure from sellers in the market.
The asset, at press time, was down 12%, yet it held a stronger position over the broader timeframe, having climbed 645% in the past ninety days alone.
While this recent drop points to a corrective phase, with the asset potentially resuming its upswing, analysis shows the present decline could run for a while, with perpetual traders offering the saving grace.
BEAT’s Taker Buy Sell Ratio tilts toward sellers
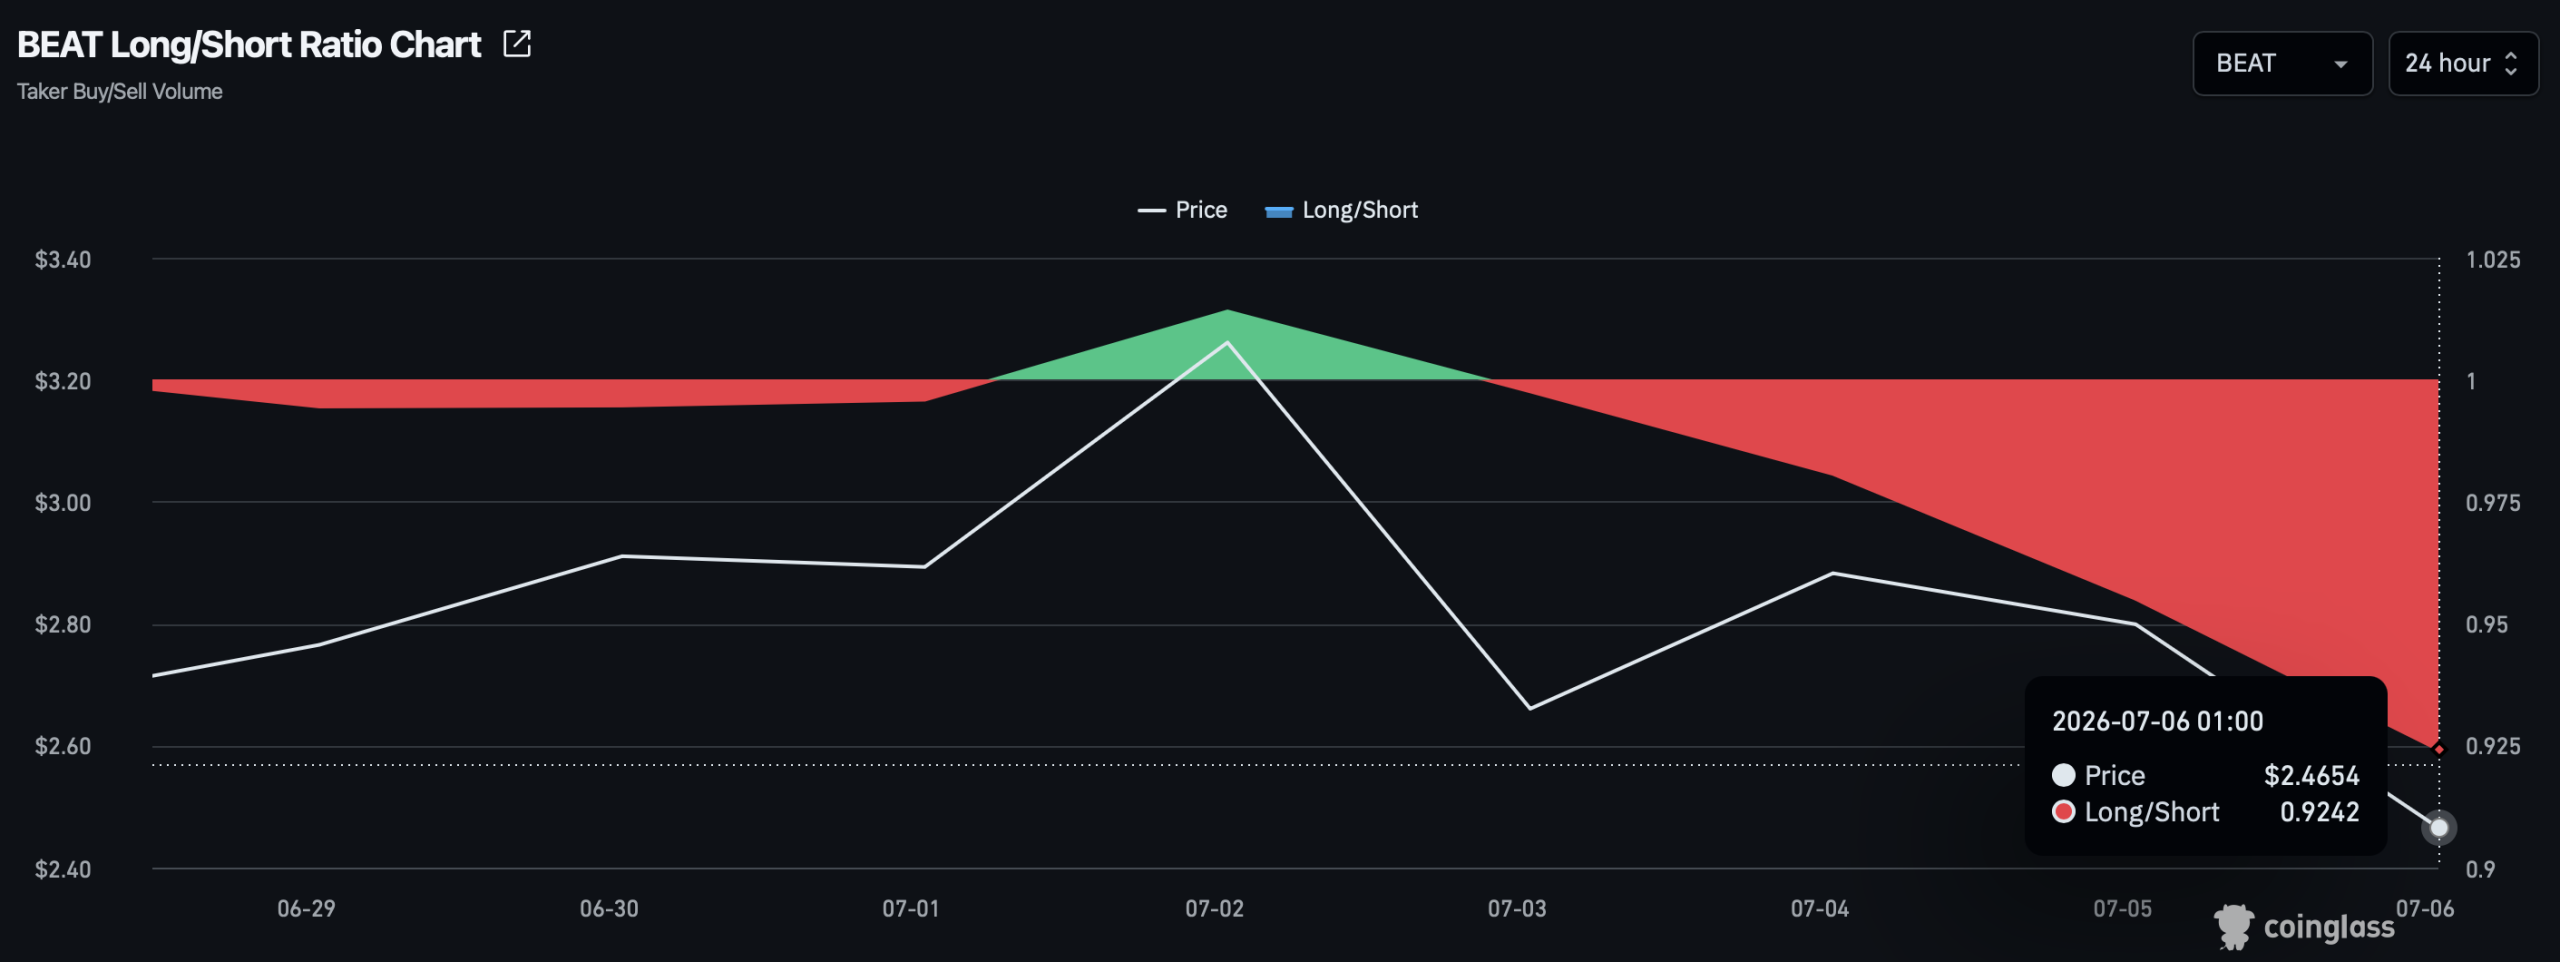
The major concern centers on the Taker Buy Sell Ratio, which tracks buying volume against selling volume in the market. Selling volume currently dominates, with the reading dropping below 1 to sit at 0.924 on the chart.
When the ratio plunges and continues to trend lower, it often implies that investors in the perpetual market are selling more than they are buying within that period.
The notable part of this sell-off is that it plays out across multiple exchanges, which hints that more downside likely awaits the market.
The Long/Short Ratio by exchange showed that, of the 12 exchanges where BEAT is listed and tracked by CoinGlass, only MEXC records more buying than selling.
This implies that Binance and OKX, controlling a combined BEAT futures trading volume of $72.59 million, more than 50% of the traded volume, place the asset at serious risk of a notable price decline.
BEAT traders exit their contracts
While selling volume has grown, the capital in the BEAT perpetual market has naturally shrunk. That holds true for BEAT, as open interest fell significantly.
At the time of writing, Open Interest (OI) lost roughly 10.3% in the past day, dropping to a new level of $73.61 million. This confirms that traders in the perpetual market are closing their contracts deliberately, likely over volatility concerns, as liquidation claimed just $194,700.
The paradox here is that despite the shrinking capital, long contracts dominate the remaining balance, with data showing the funding rate sitting positive.
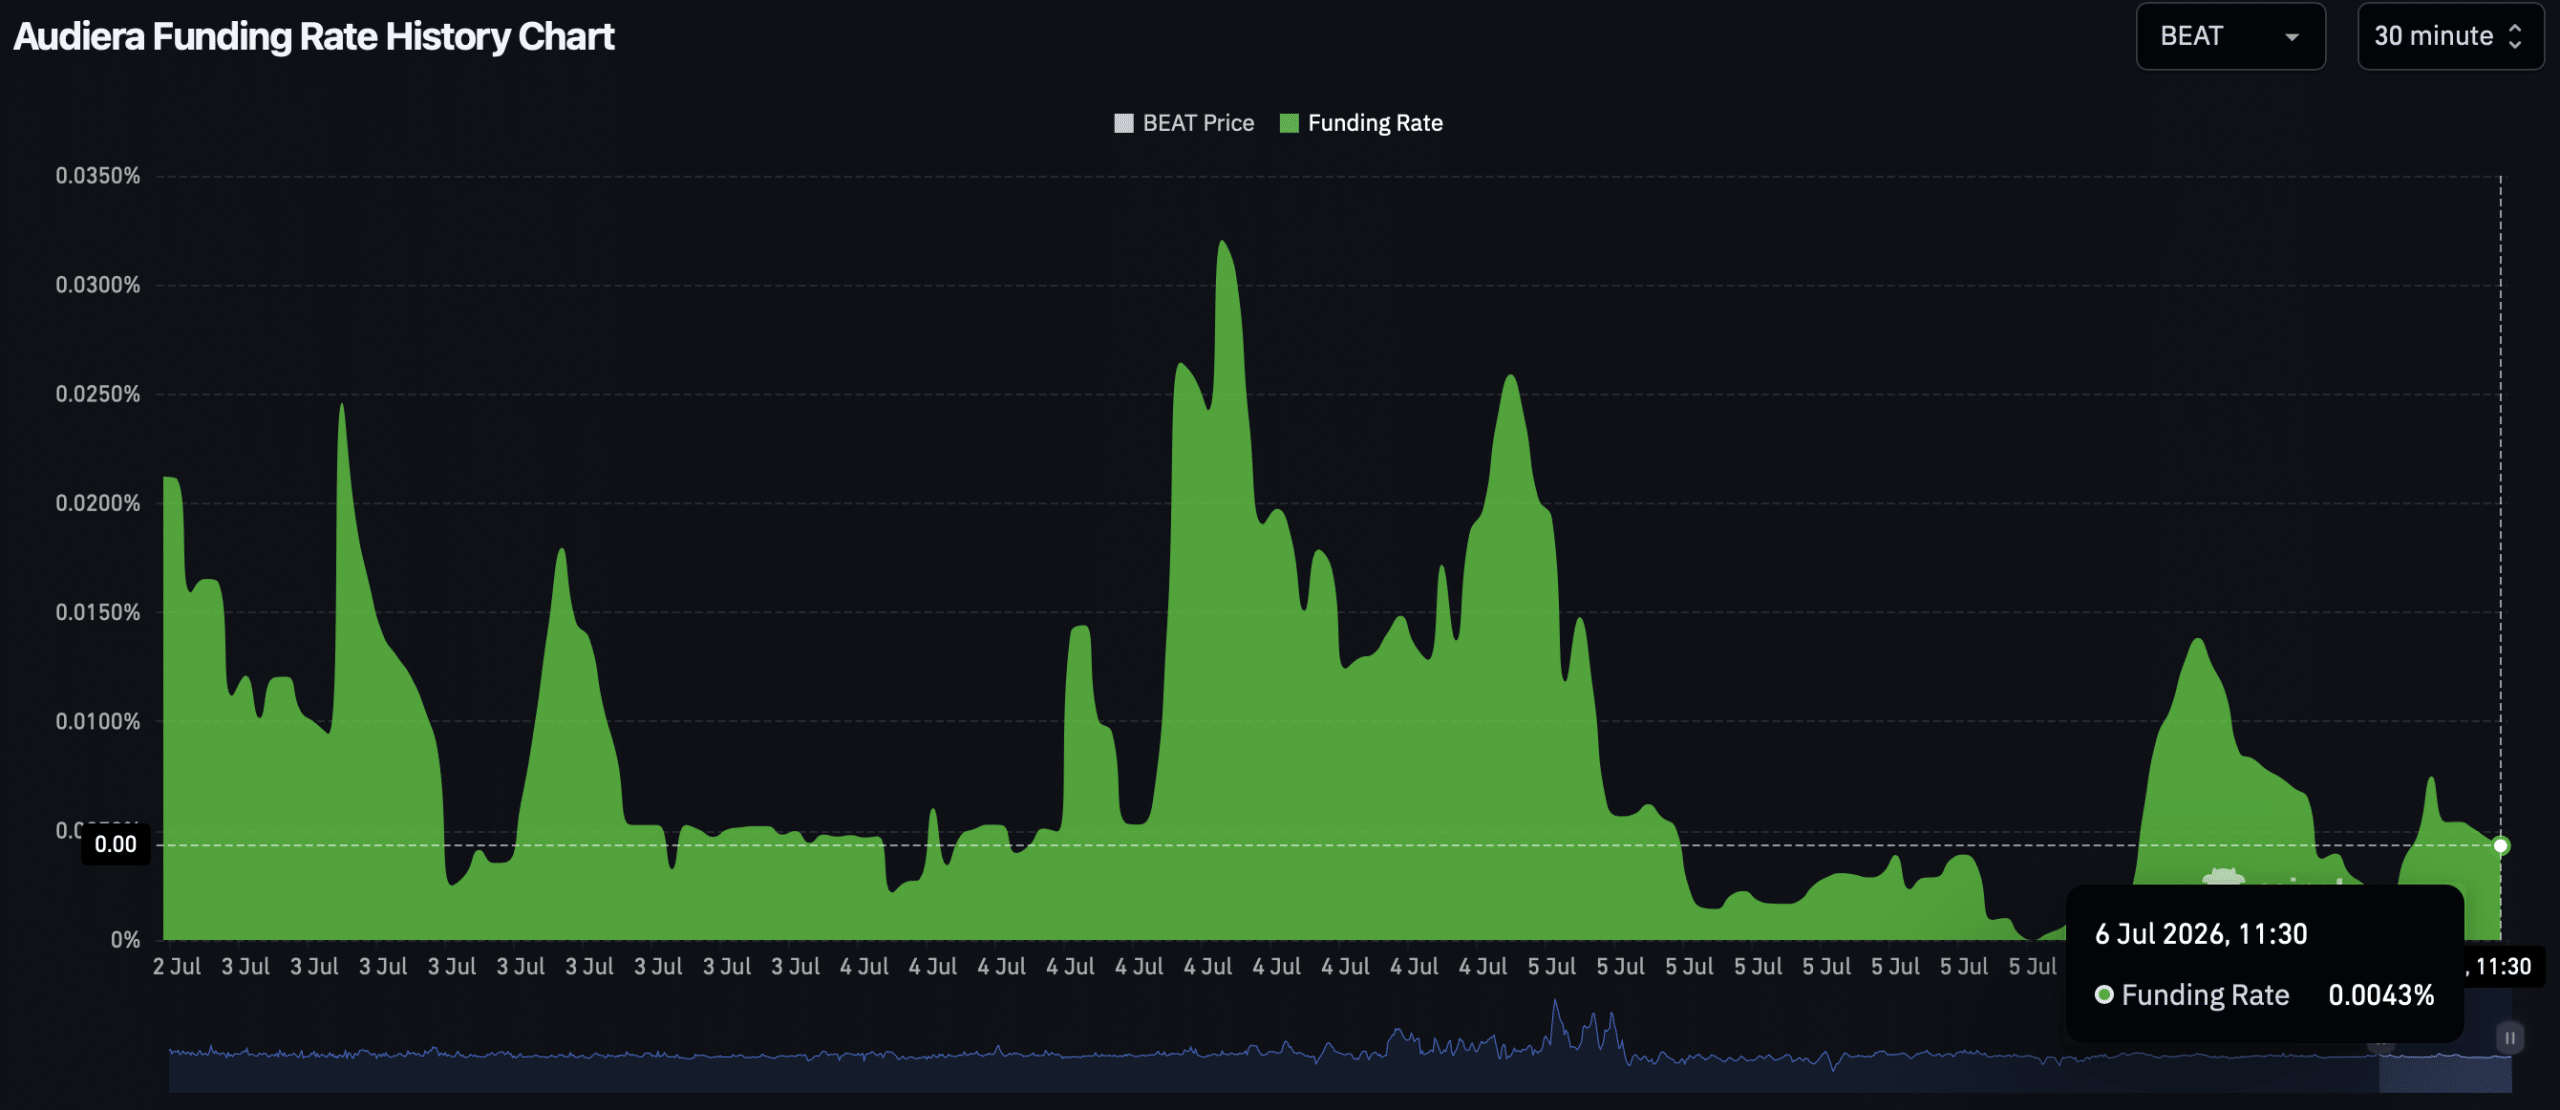
Notably, the Funding Rate was at 0.0043% on the chart, confirming that buy-side pressure still favored continued upside. A continued surge remains odd, as longs have dominated the losses in the perpetual market over the past day, even as selling intensifies.
This high-conviction bearish read could prove blatantly wrong, with a strong chance that price stages an upward rebound in the near term.
Liquidity clusters hint at a possible rebound
The heatmap analysis of BEAT shows potential for upside given the current positions of liquidity clusters; these clusters often act as magnets, pulling price toward them.
For BEAT, the liquidation heatmap shows a high concentration of liquidity presently above price, which suggests a strong pool that could drag BEAT higher than it currently trades.
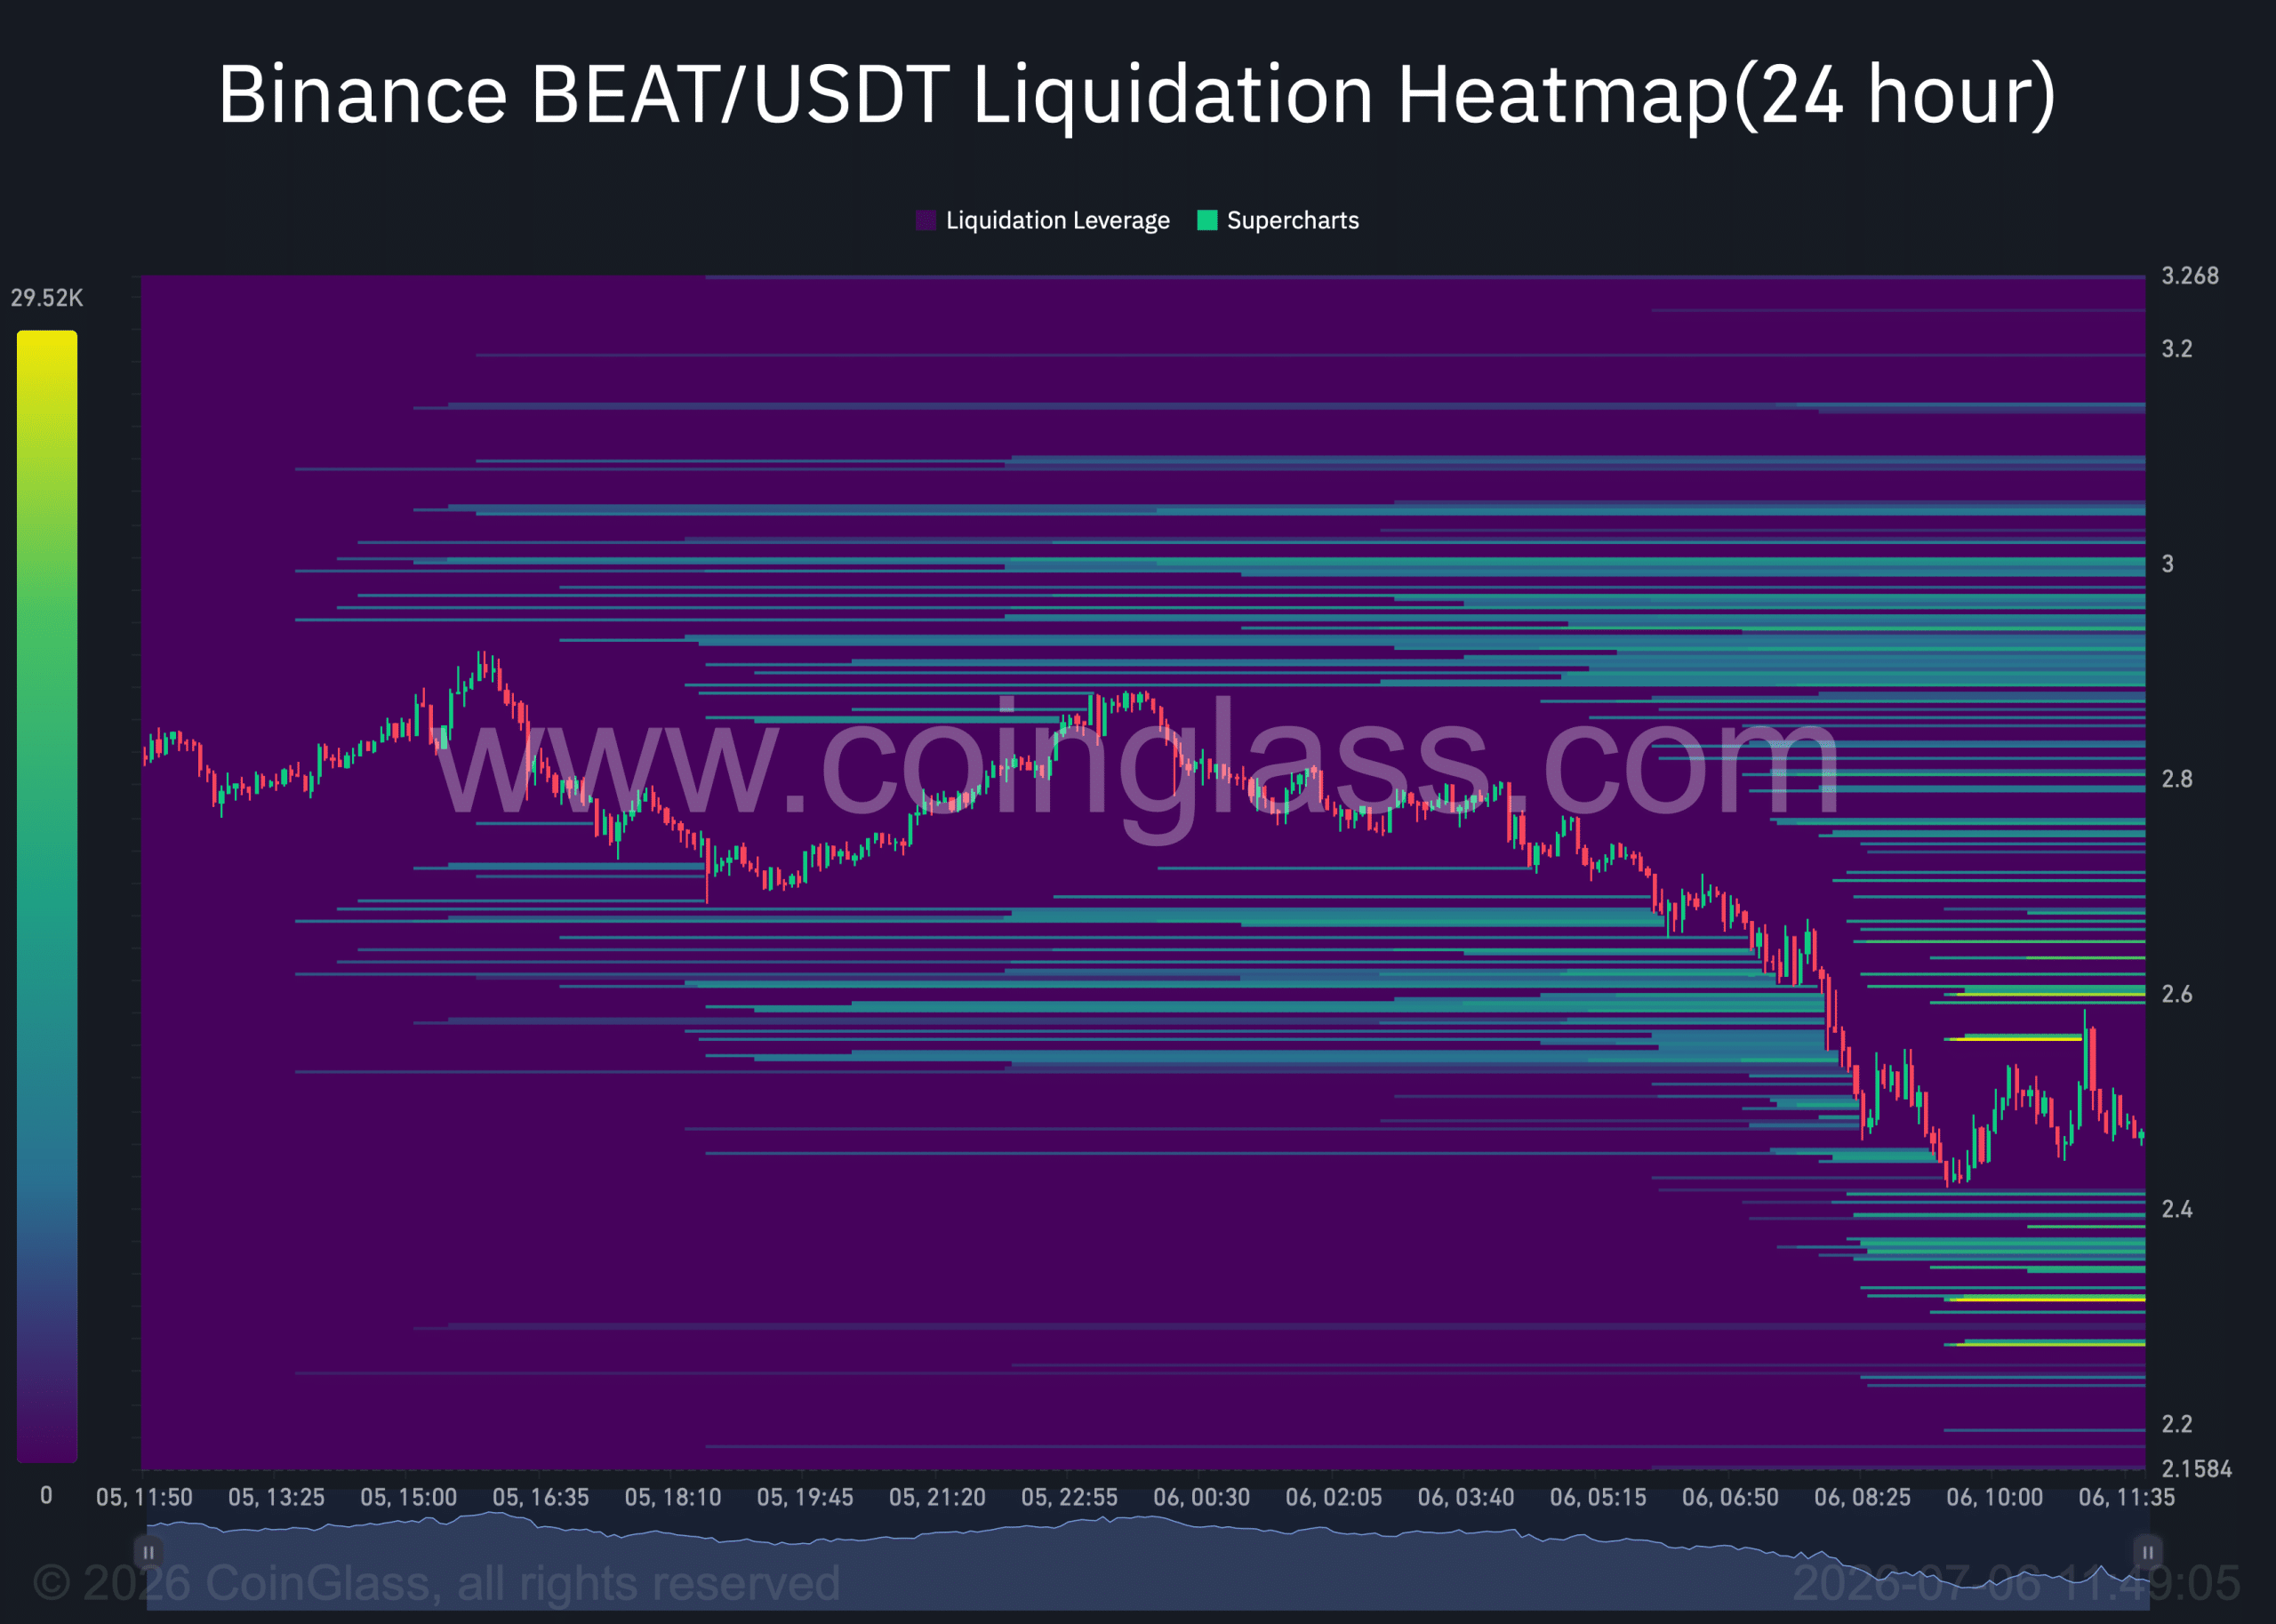
While lower clusters exist, they remain less compact. If price follows current market momentum and clears out those lower clusters, it will serve as a catalyst for a longer-term rally. The clusters below the price mark buy orders that could supply the demand required to push the price up.
Final Summary
- BEAT was down 12% as sellers dominated across exchanges, with the Taker Buy Sell Ratio at 0.924.
- Despite the sell-off, a positive funding and heavy liquidity clustered above price point to a possible near-term rebound.