


Solana price slipped to $79.48 on Monday, falling 1.70% over 24 hours as market pressure returned. The move closely followed Bitcoin’s 1.65% decline, while the total crypto market cap dropped 1.47% to $2.14 trillion. Technical indications also demonstrate that the bulls have room to push back in July.
Solana price met fresh resistance near $80 after rising more than 15% in the previous week. This rejection indicated that sellers continue to protect this level in more market-wide weakness.
Solana is still well below its all-time high of 294.33, observed on January 19, 2025. The token is trading approximately 73% lower than that high.
Solana ETF Inflows Support July Recovery Case
ETF flows showed a different trend for Solana compared with Bitcoin and Ethereum price. Spot Bitcoin ETFs posted a net outflow of $527 million between June 29 and July 2.
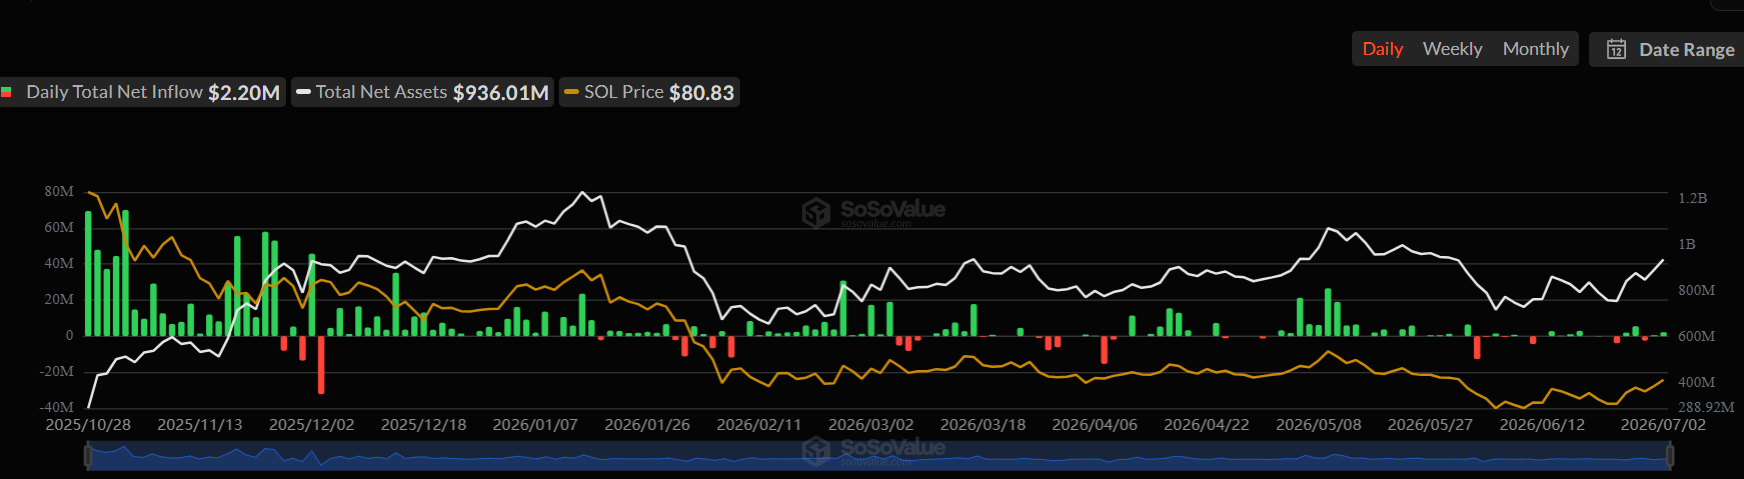
That became the eighth consecutive week of Bitcoin fund withdrawals. Spot Ethereum ETFs also posted $13.67 million in outflows.
US-listed spot Solana ETFs recorded net inflows of $5.75 million. The upward movement implied investors kept Solana exposure even though the market was scared.
Other altcoin ETFs attracted capital during the week. XRP ETFs brought in $17.19 million, while HYPE ETFs added $4.32 million.
Solana Spot Volume Ranks Second for Another Week
Solana ranked second in global spot crypto trading volume for the second straight week, according to SolanaFloor data. The network had a weekly volume of $12.25 billion across DEXes and CEXes. It stayed ahead of Bybit’s $10.57 billion total. Nonetheless, Binance was still the market leader in the overall reporting period.
Solana also announced a new record of weekly activity as the number of non-vote transactions passed one billion last week. The graph indicated that the number of transactions increased steeply at the beginning of July. This expansion indicates greater network utilization other than validator voting activity. It also attributes to increasing user, app, and trader demand within the ecosystem of Solana.
Solana User Activity and DApp Revenue Hit New Highs
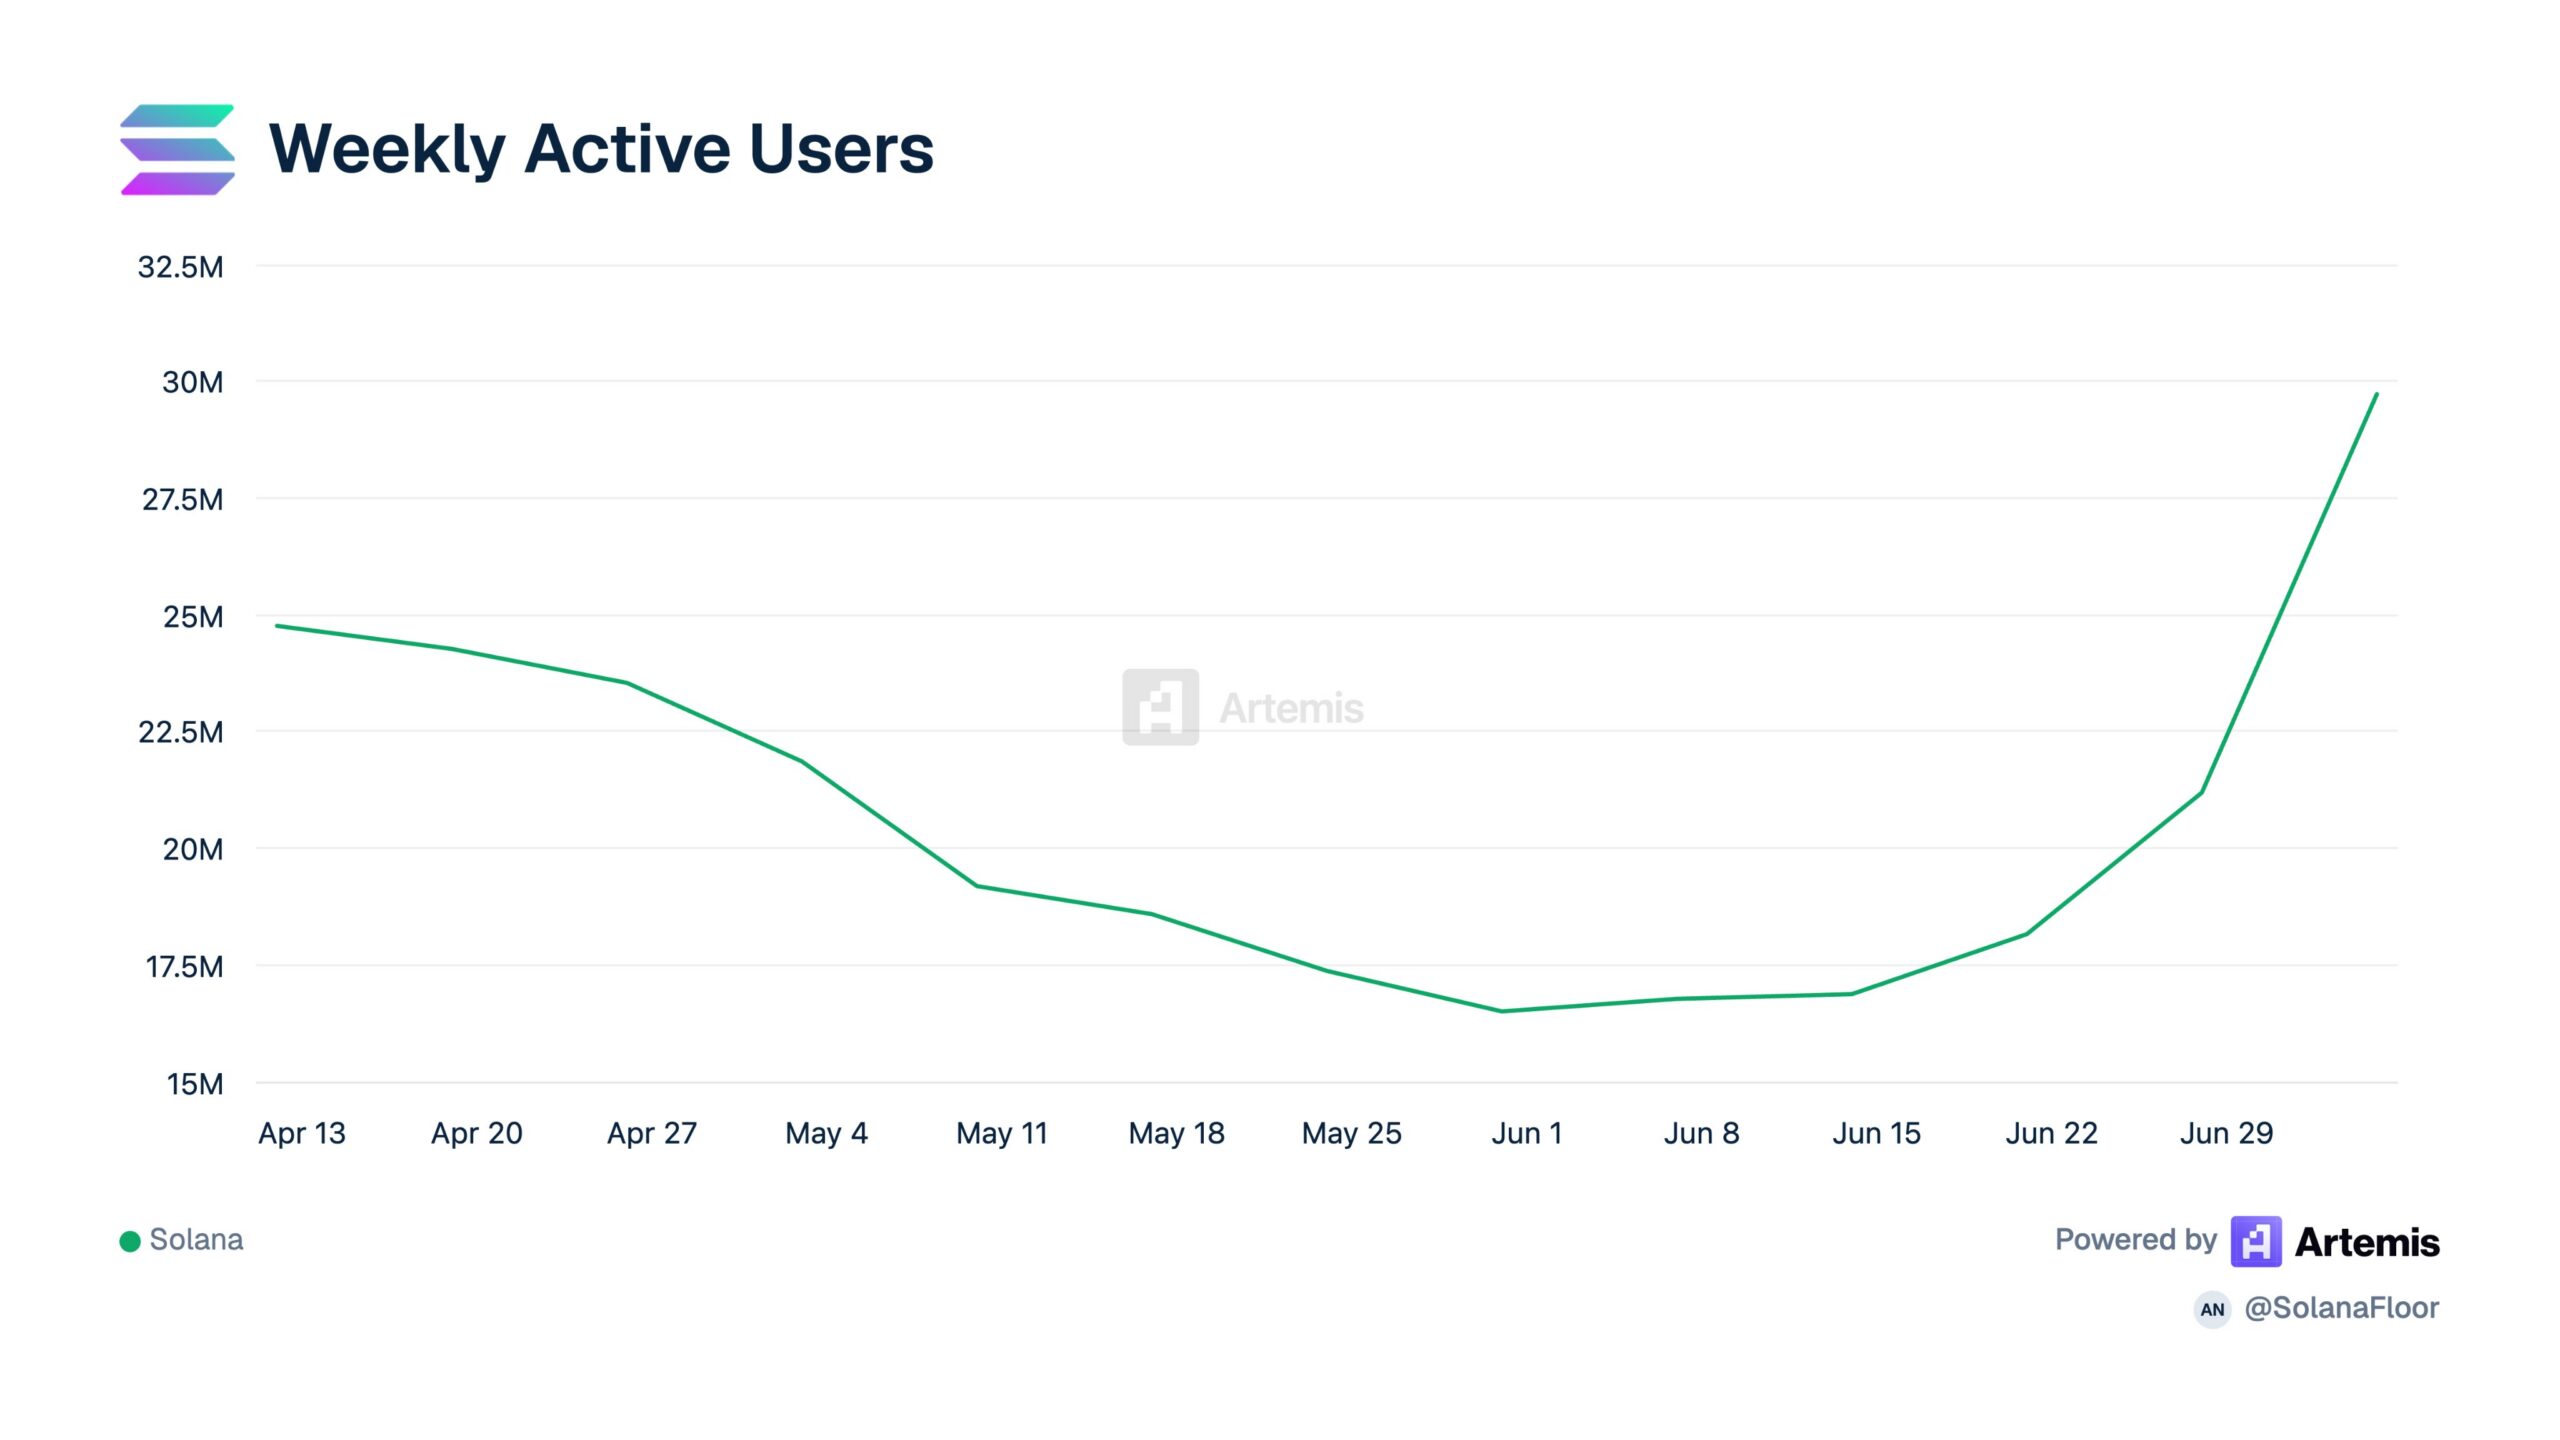
Meanwhile, Solana’s weekly active users climbed from $16.8 million to $29.7 million in two weeks.
The growth contributed $12.9 million wallets, a growth of $76.8. The rebound was sharp, according to the Artemis data, following a slowdown in June. The increase indicates the resurgence of user activity as network applications attract more participants in Web3 markets.
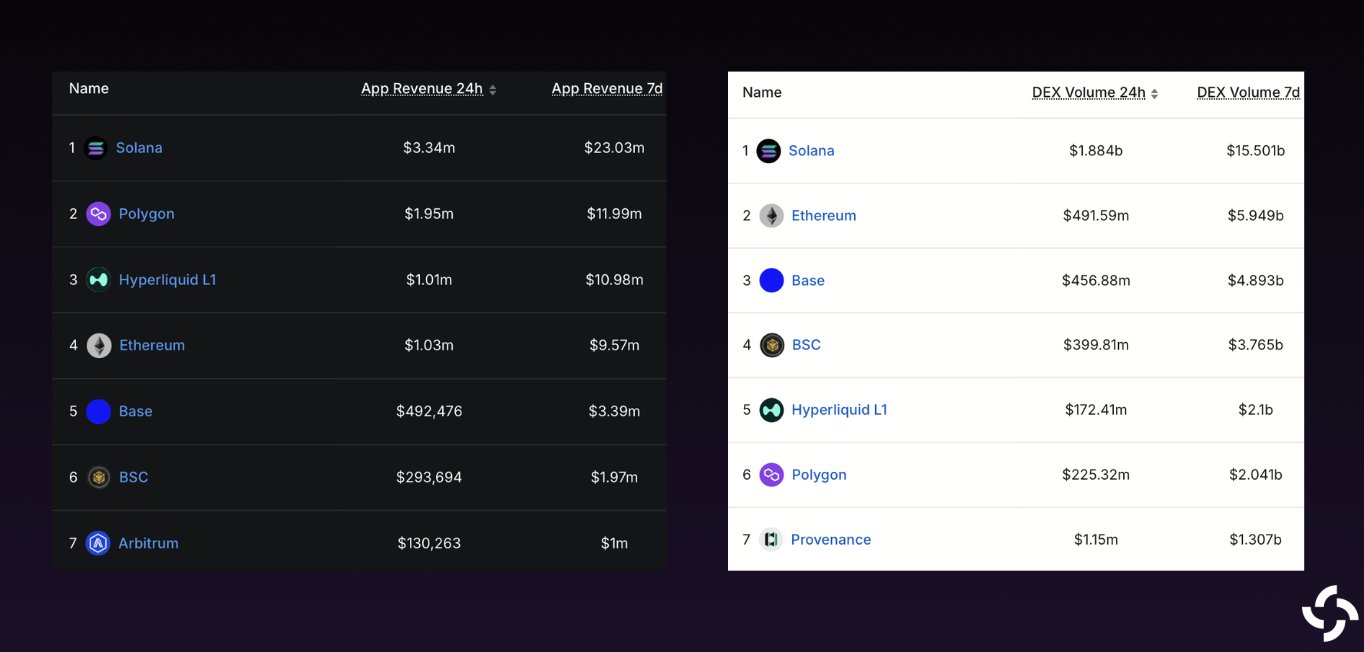
Solana remained the top L1 and L2 DApp revenue and DEX volume. The report ranked Solana first in 24-hour app revenue and seven-day totals. It also caused DEX volume in both periods. In those rankings presented, Polygon, Ethereum, Base, BSC, and Hyperliquid were ranked across the listed metrics.
🚨BREAKING: @Solana‘s weekly transaction activity hit a new all-time high, with 1B+ non-vote transactions processed last week. pic.twitter.com/x3GBDFHO6Q
— SolanaFloor (@SolanaFloor) July 6, 2026
Solana Price Targets $85 Breakout, Could $100 Follow Next?
As of the writing, the SOL price traded at $80.34, based on four-hour chart data. In the meantime, the RSI was around 51, indicating that market strength was in equilibrium at current levels.
The RSI is at 53 indicating that recent momentum has begun to subside. The MACD line, also, was lower than the signal line indicating smaller short term buying pressure.
On the negative side, the level of $80 is also significant since the price is near the level. Any drop less than $80 would put SOL at risk of being under $78, which is the most recent four-hour low on the chart.
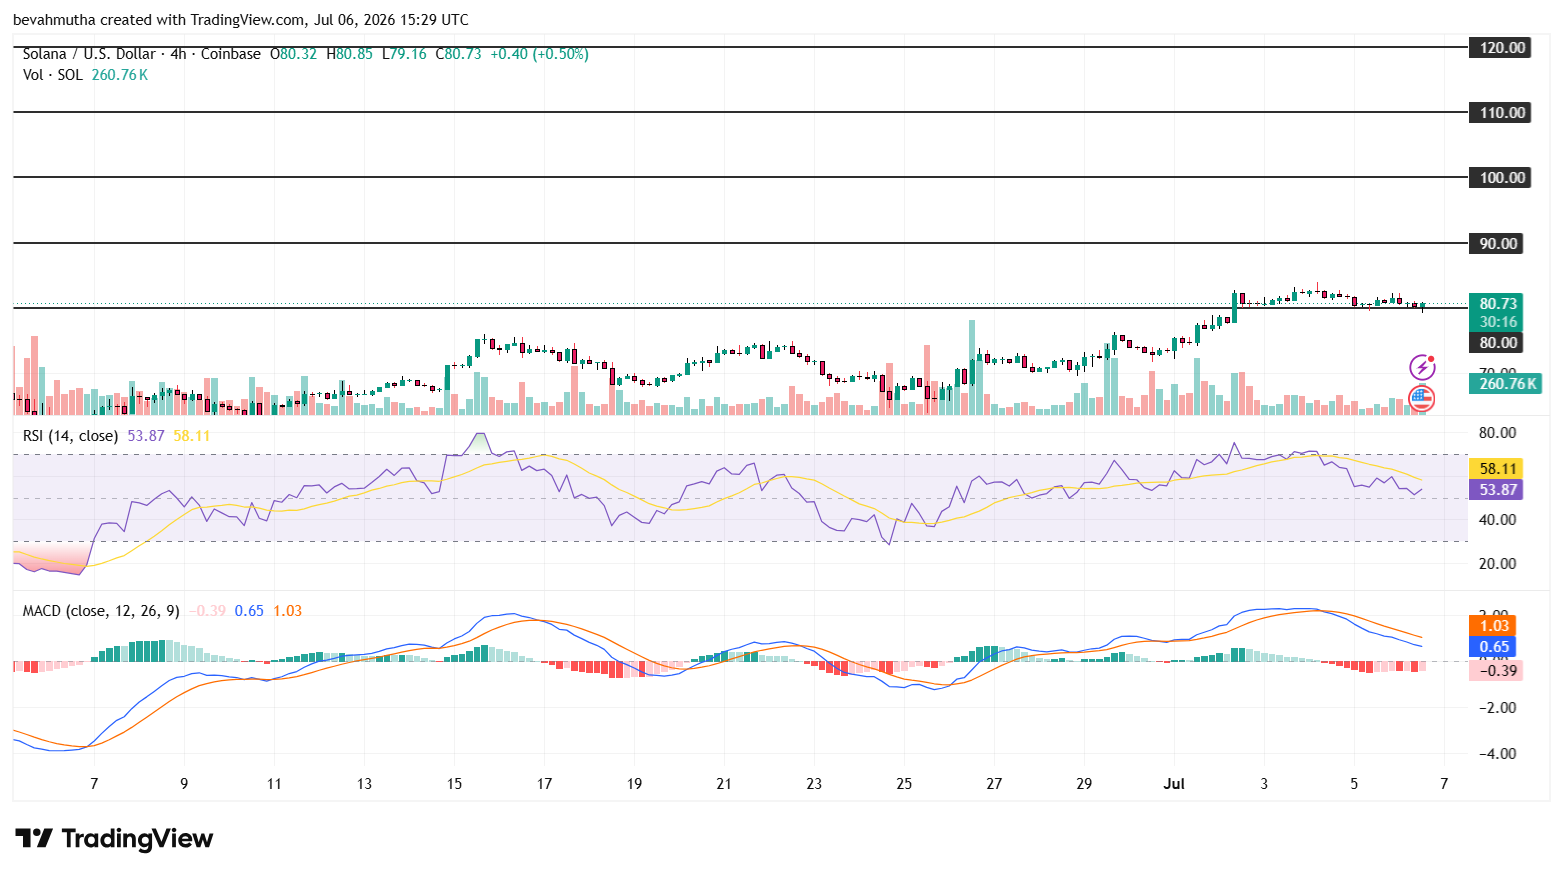
Additional selling pressure can drive the token to $75, and traders will monitor the $70 support region.
For now, the future Solana outlook remains trapped between $80 support and the $85 resistance region. Bulls require more volume and clean breakout to divert the focus to $90 and $100.