, Bitcoin (BTC) and Solana (SOL) Price Analysis for June 29: Bottom Is Established")
With price action still adhering to a distinct bearish structure, XRP is still among the market’s weakest large-cap assets. XRP broke below the range and accelerated lower after consolidating between about $1.30 and $1.50 for several months. The asset was driven toward the psychologically significant $1.00 support level by the breakdown, which validated a bearish continuation pattern.
The 50-day, 100-day, and 200-day moving averages of XRP are all technically above its current price, reflecting a downward slope. Usually, this alignment means that sellers are still in complete control. The RSI is getting close to oversold territory at 32, indicating that the short-term downside momentum may be running out. However, during severe downtrends, oversold conditions by themselves seldom indicate a bottom.
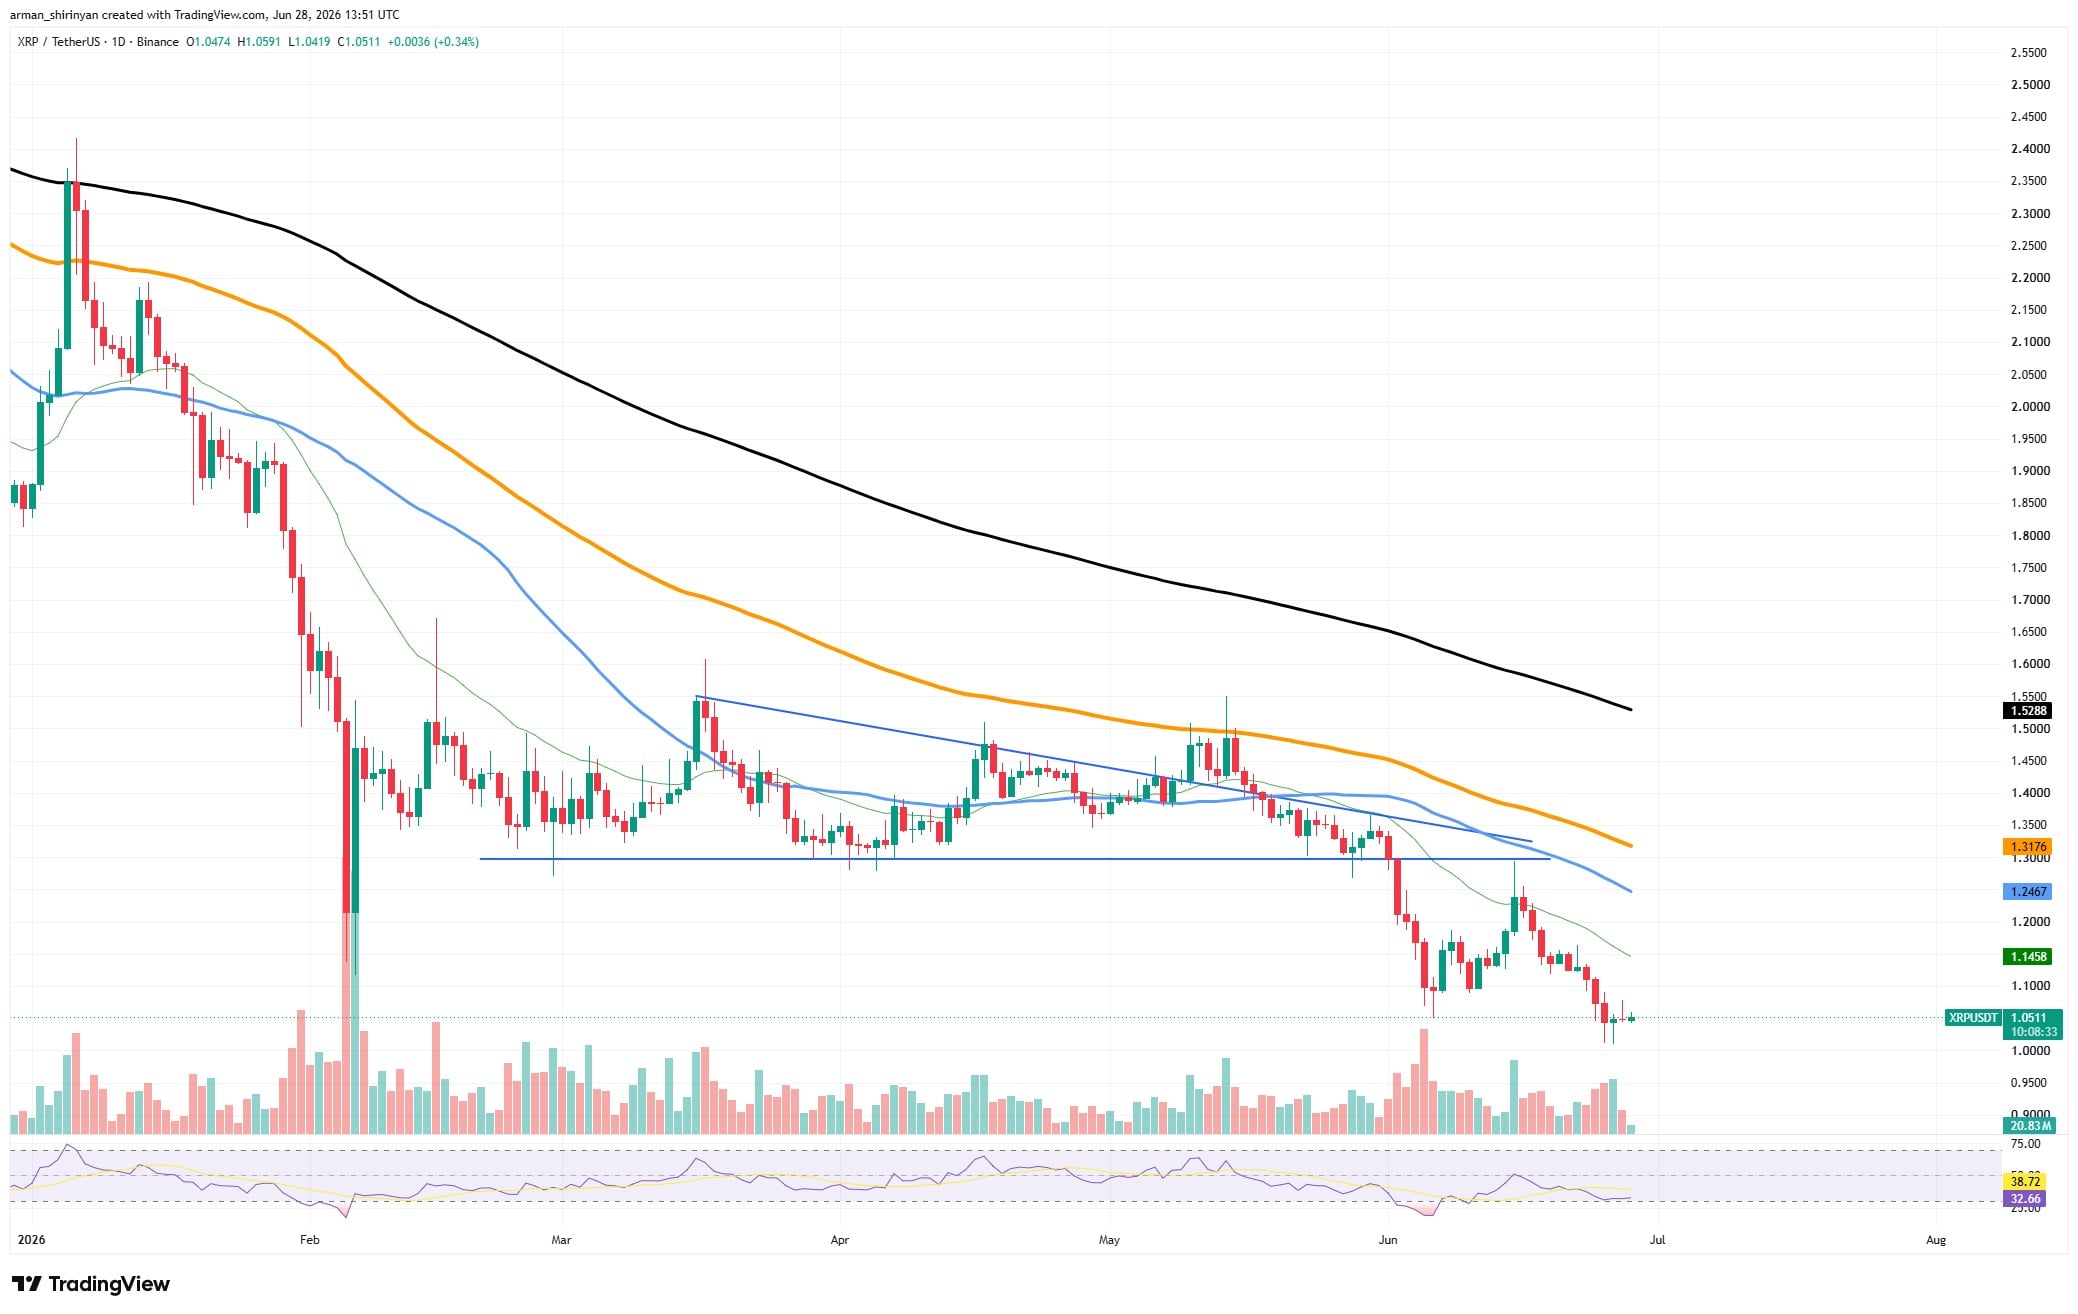
The crucial level to keep an eye on is $1.00. Another wave of selling could be sparked by a clear break below it, opening the door to lower support zones. On the other hand, XRP might experience a relief rally toward the 50-day EMA at $1.14-$1.15 if buyers are able to hold this area. Until the asset regains significant moving averages, the trend remains negative.
XRP, Shiba Inu (SHIB), Bitcoin (BTC) and Solana (SOL) Price Analysis for June 29: Bottom Is Established
Richer Than Bill Gates? CZ Disputes Forbes’ Ranking
Shiba Inu forms a breakdown
SHIB is displaying a quite similar structure. Recently, the asset broke out of a rising wedge formation, which frequently precedes bearish continuation moves. SHIB has not established a significant recovery since the breakdown and is still trading close to local lows. SHIB is still below all of the major moving averages, just like XRP.
card
The 50-day EMA is preventing buyers from creating long-term momentum by acting as dynamic resistance. Recent attempts at a bounce have not seen a significant increase in volume, suggesting that bulls are not very confident. SHIB is firmly in oversold territory as the RSI has dropped toward 21.
The overall trend still favors sellers, even though this increases the likelihood of a short-term recovery. The recently broken wedge structure and the 50-day moving average are likely to present obstacles for any recovery attempt.
The current move appears to be more of a continuation of the larger downtrend than the start of a true reversal unless SHIB can recover those levels.
Pressure on Bitcoin remains
Despite its efforts to stabilize above the $60,000 mark, Bitcoin is still under significant pressure. The medium-term bullish structure was effectively terminated and a return to bearish control was confirmed when the asset broke away from an ascending trendline that had sustained the recovery rally from April to May.
The 50-day, 100-day, and 200-day moving averages of Bitcoin are all significantly above the current price on the chart. The market has lost a lot of momentum during the most recent correction, as evidenced by the 200-day moving average near $76,000 becoming a distant resistance level. Additionally, recent attempts at a bounce have not been successful in regaining the 50-day EMA, indicating that sellers still control every relief rally. At 32, the RSI is getting close to oversold territory.
card
Although this might encourage a temporary recovery, the overall trend is still negative. Crucially, volume increased throughout the sell-off, suggesting true distribution as opposed to just a lack of buyers. The $58,000-$60,000 support zone is a crucial level to keep an eye on.
Another wave of liquidation pressure could hit the market if Bitcoin loses this area. On the other hand, the first sign that the bearish momentum is starting to wane would be a rebound above the 50-day EMA around $64,000. Until then, sellers continue to have the upper hand and Bitcoin remains stuck in a downtrend.
Solana’s breakout potential
Solana is showing remarkable resilience in contrast to Bitcoin. Even though SOL saw a significant drop earlier in June, buyers intervened forcefully near the $63-$65 support range, keeping the asset above regional lows.
Technically, SOL is still below its major moving averages, indicating that the long-term trend is still negative. The asset has started to consolidate around the 50-day EMA at $72, and it recently produced a higher low. Many large-cap cryptocurrencies, on the other hand, continue to set new lows. After a period of oversold conditions, the RSI has recovered toward 49, returning to neutral territory.
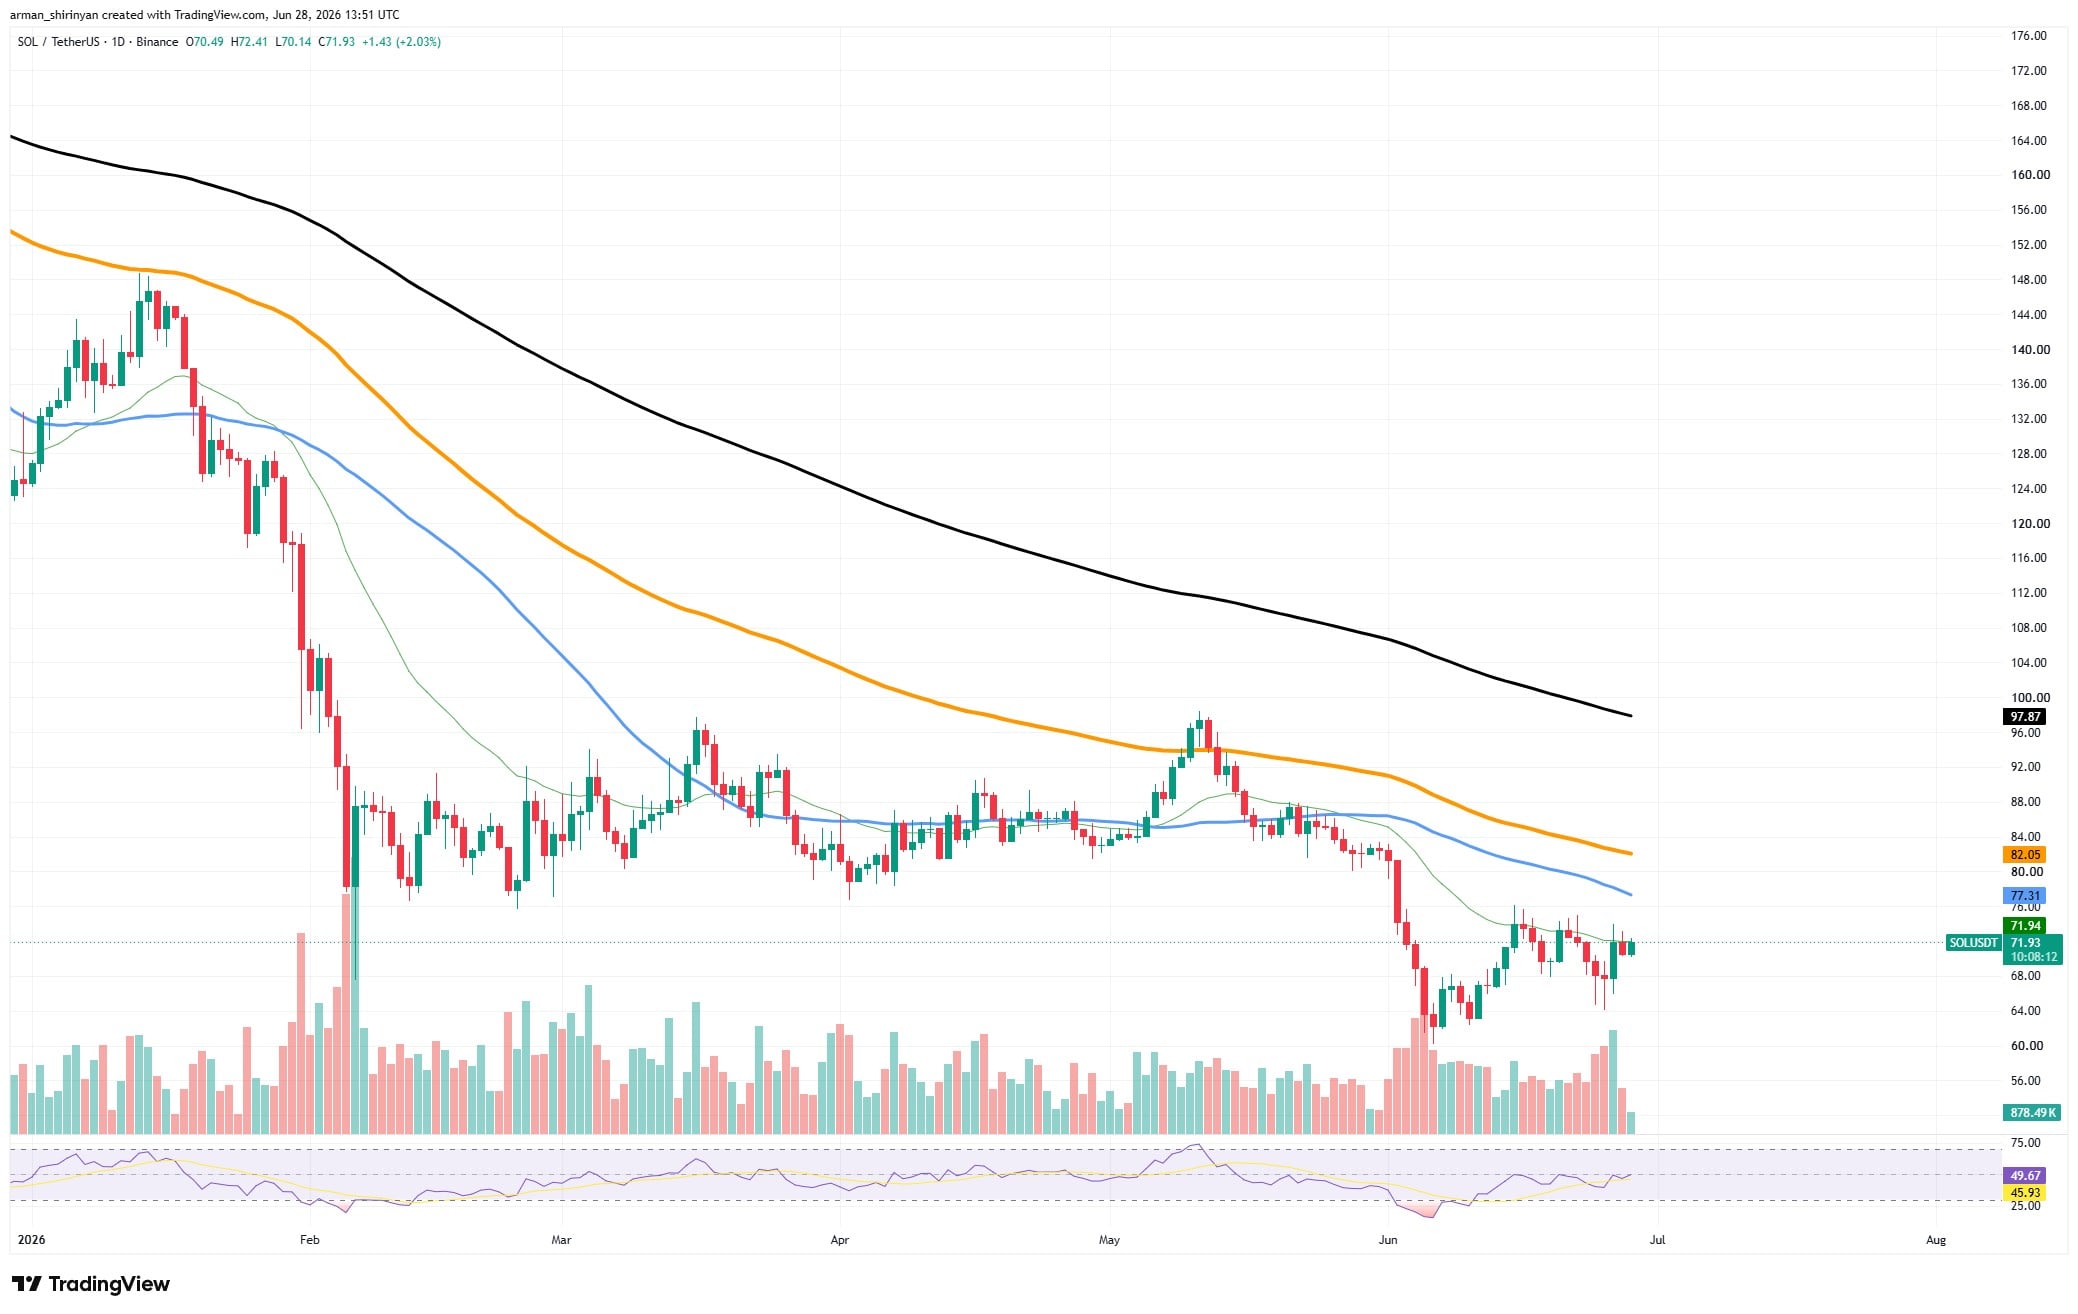
This suggests that selling pressure has significantly decreased. During recent recovery attempts, volume has also increased, indicating real buyer involvement. Regaining the 50-day EMA and establishing support above $72 is the bulls’ immediate challenge. A move toward the 100-day moving average near $77 is more likely if that happens.
In the event that current levels are not maintained, the $63 support zone would become more prominent. Even though there is currently no proof of a complete trend reversal, SOL remains one of the more promising assets among the major cryptocurrencies.