 Too Oversold? Bitcoin (BTC) Risks Slipping to ,000: Crypto Market Review")
- Bitcoin breaks down too fast
- XRP is in big trouble
The privacy-focused cryptocurrency Zcash saw one of its biggest drops in recent history, falling from over $600 to almost $300 in a few short days. The collapse occurred following fresh worries about the recently revealed Orchard pool vulnerability, which caused panic selling throughout the market and a surge in profit-taking by investors who had amassed ZEC during its explosive rally. Now the question is whether the sell-off has reached its limit.
Technically speaking, ZEC is venturing into a market that frequently draws bargain seekers. The asset is currently testing levels that served as a significant consolidation zone in April and early May after falling almost 50% from its recent highs.
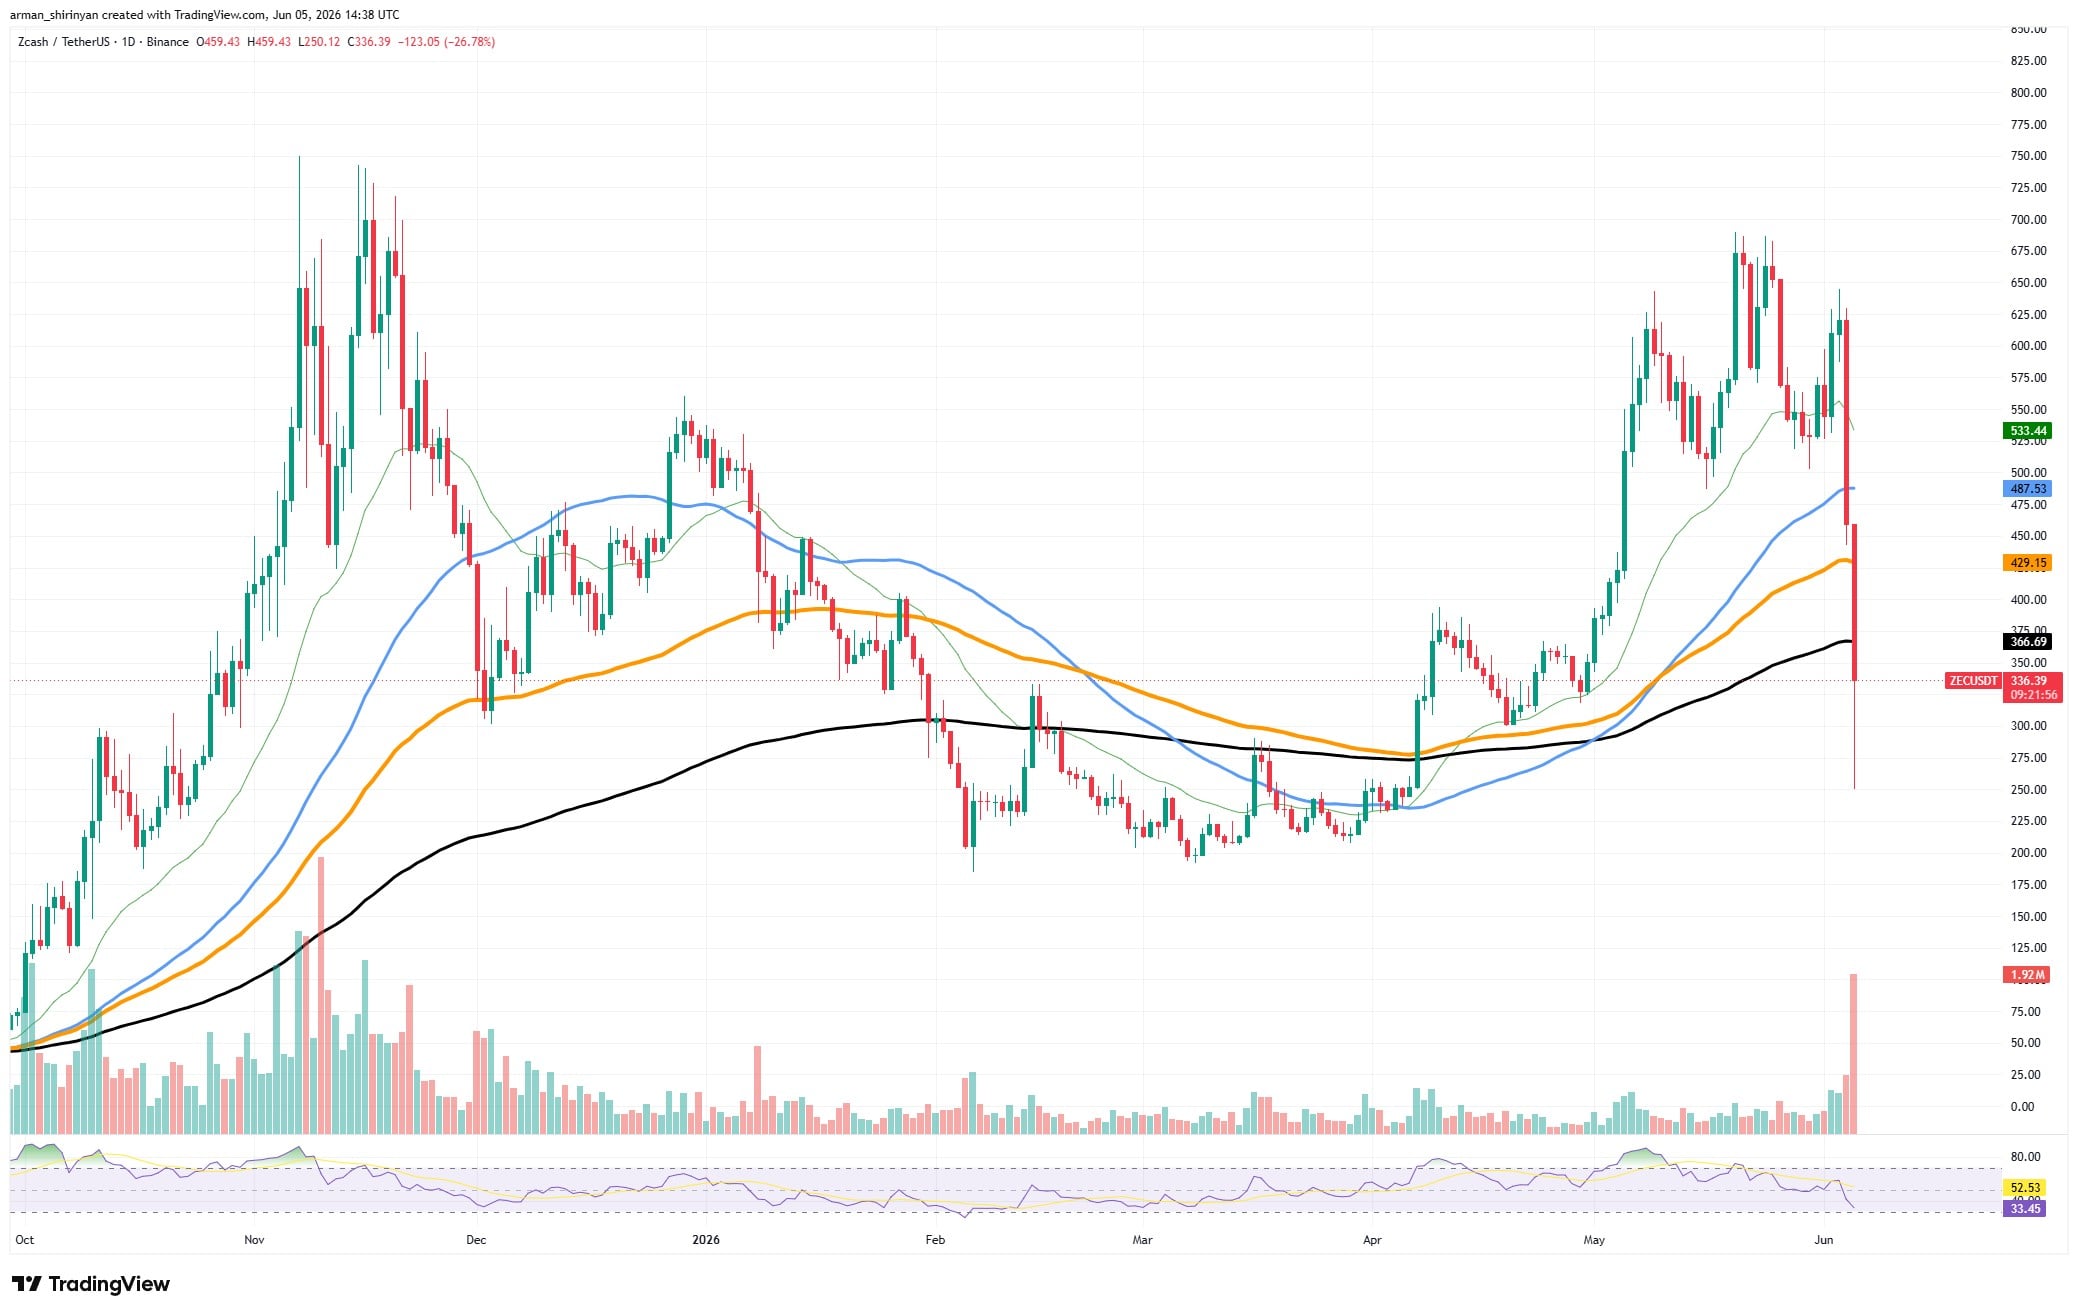
Simultaneously, the daily RSI has drastically declined from overbought conditions to levels usually linked to seller fatigue. Another crucial clue is provided by volume. Rather than a slow decline in sentiment, the most recent red candle was accompanied by a massive spike in trading activity, indicating a capitulation event. Such volume explosions have historically been indicative of emotional market reactions in which longer-term participants start accumulating while weaker hands exit positions.
Where Is XRP Bounce Possible? Is Zcash (ZEC) Too Oversold? Bitcoin (BTC) Risks Slipping to $50,000: Crypto Market Review
Ripple’s Schwartz Reveals Where XRP Ledger Is Headed
In essence, the situation might not be as dire as the market’s initial response indicates. The Orchard bug was dangerous because it might have made it possible to produce shielded ZEC that would have been hard to spot. Nevertheless, the vulnerability has already been fixed, and there is still no proof that it was ever exploited in the wild.
You Might Also Like

Significantly, many investors contend that signs of unusual supply expansion or market disruption would have probably surfaced much sooner if malevolent actors had identified and actively exploited the vulnerability during its three-year existence. That implies that the current sell-off might be pricing in a worst-case scenario, but it does not remove uncertainty.
Bulls must protect the area around the 200-day moving average near $360 and eventually recover the 100-day and 50-day moving averages above in order for ZEC to stabilize. If this isn’t done, there may be more declines in the mid-$200 range.
Bitcoin breaks down too fast
What had been a controlled correction has become a full-scale bearish continuation due to Bitcoin’s most recent breakdown. With one of the strongest downside candles seen in months and a significant spike in volume, Bitcoin fell toward $60,000 after losing support in the $72,000-$74,000 range.
Bitcoin had been gradually rising toward the $200,000 level near $80,000 for a few weeks, creating a recovery structure from its lows in March and April. That attempt at recovery was unsuccessful.
BTC was rejected and started to roll over beneath all major moving averages rather than breaking above long-term resistance. Bears are now firmly in control after the asset’s recent collapse pushed it below the 50-, 100-, and 200-day trend indicators. Momentum indicators may give the most alarming signal.
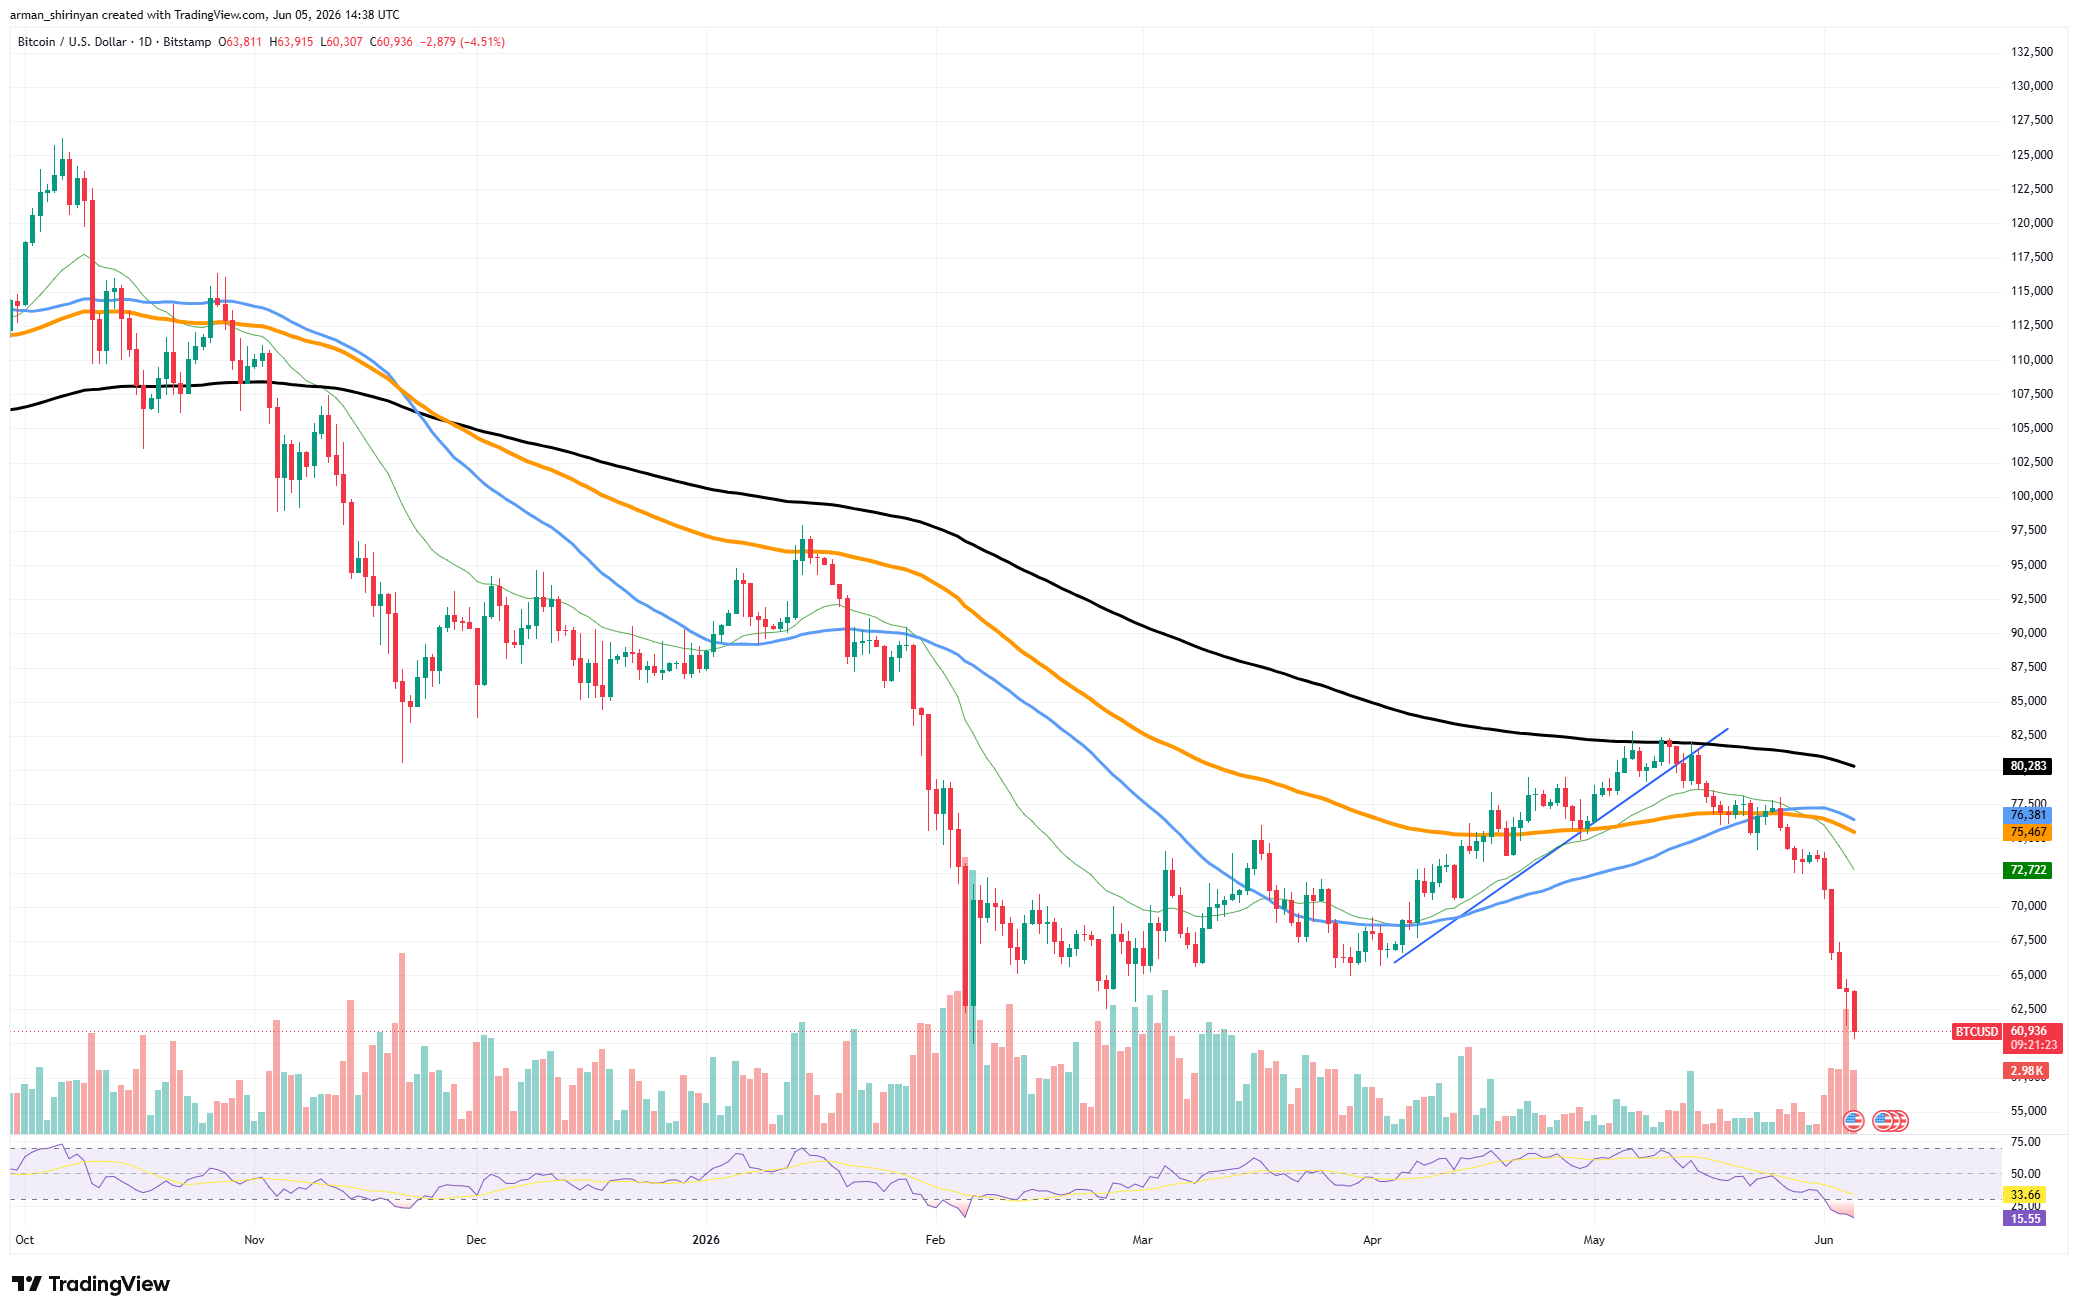
The daily RSI has fallen into extremely oversold territory close to 15, a level that is seldom reached in typical market circumstances. Such readings indicate severe selling pressure and a total lack of buyer participation, even though they may cause brief relief rallies.
The ability of $60,000 to hold is the next big question. The chart provides little structural support below the current range, although round-number support levels have historically drawn attention.
The next significant demand zone appears closer to $50,000-$55,000, where prior consolidation took place prior to the late-2024 rally, if Bitcoin is unable to stabilize around $60,000-$62,000. Although it might sound dramatic, a move toward $50,000 would not be unprecedented from a technical standpoint.
While staying above the cycle lows set earlier in the year, it would indicate a retracement into a significant historical support area. Additionally, volume indicates that current market behavior is dominated by panic rather than orderly distribution.
Regaining the broken support zone around $72,000 would be the first indication to bulls that the breakdown was a mistake. Bitcoin is still clearly in a downward trend until that point.
XRP is in big trouble
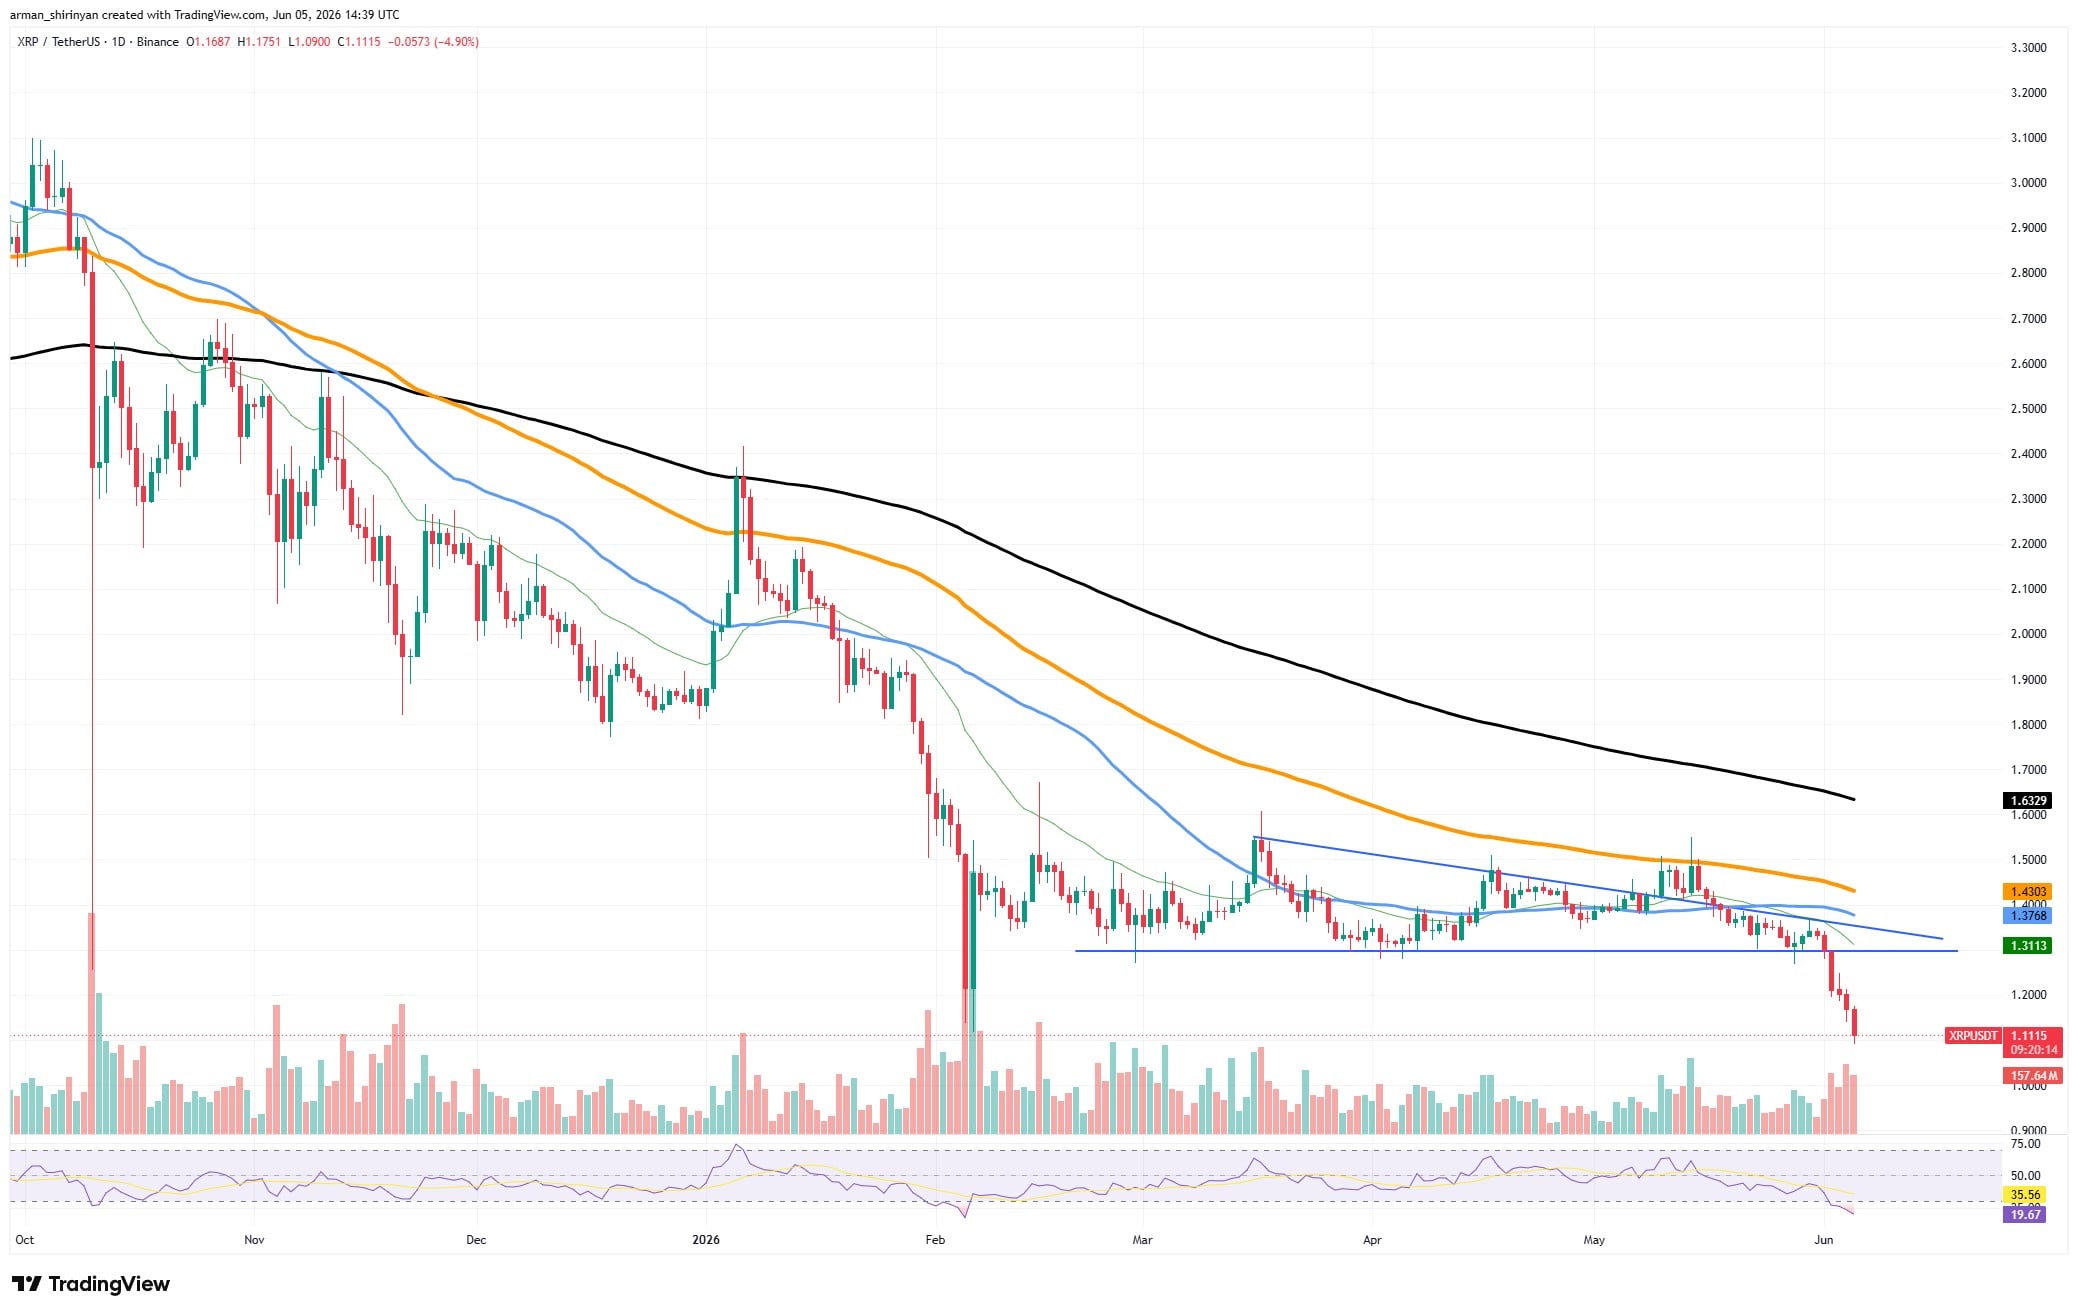
The recent collapse of XRP has significantly altered the asset’s technical outlook. The cryptocurrency has finally broken down after months of consolidating above the critical $1.30 support zone, paving the way for a much deeper correction.
The decline coincides with the cryptocurrency market’s general weakness, but XRP’s chart structure indicates the asset may experience further declines before reaching a stable bottom.
The psychological $1 threshold is the area that traders are most closely monitoring. If XRP is able to stabilize close to that level, it may experience a short-term relief rally. Round numbers tend to draw buyers.
Technically speaking, however, there isn’t much historical evidence for the area. Although a bounce is still possible, there isn’t much evidence that $1 is a significant long-term accumulation zone.
The range between $0.75 and $0.85 is more intriguing. After the recent sell-off, buyers searching for value may be drawn to this area, which acted as resistance several times prior to XRP’s explosive rise. However, it is still not as important as a much more important support level that can be seen on the long-term chart.
Right now, it looks like the strongest support zone is between $0.50 and $0.60. This area is very important from a technical standpoint. The asset spent a considerable amount of time consolidating around these levels prior to XRP’s historic rally, building a significant accumulation base.
As a result, a return to the $0.50–$0.60 range would probably be seen by many long-term investors as a valuation reset rather than an extension of typical market volatility.
However, support levels are never assured. XRP may temporarily surpass even solid support zones if the state of the cryptocurrency market as a whole continues to worsen and Bitcoin continues its own correction toward the $50,000–$55,000 range.
A significant bearish continuation pattern that points much lower than current prices was completed by the recent breakdown below $1.30. Therefore, even in the face of increasingly oversold conditions, traders should exercise caution.
The $0.50-$0.60 area currently stands out as the most compelling long-term support zone and the most likely location where a significant recovery could eventually start, even though XRP may attempt smaller rebounds along the way.