, XRP, Toncoin (TON), Bitcoin (BTC) and Ethereum (ETH) Price Analysis for May 9th: Breakouts Fail, Key Support Levels Crack and Bullrun Momentum Collapses")
Despite short-term stabilization above the March lows, Shiba Inu is still trading within a larger bearish market structure. The 200-day moving average is still sharply declining, and the daily chart displays SHIB trapped beneath all major moving averages. That in and of itself indicates that the macro trend is still weak, despite the recent phase of consolidation.
Almost immediately after the price touched the declining 50-day moving average, the attempt to break out from the small ascending triangle failed. Higher resistance zones could not be reclaimed by buyers due to a lack of momentum, and volume remained largely quiet during the move.
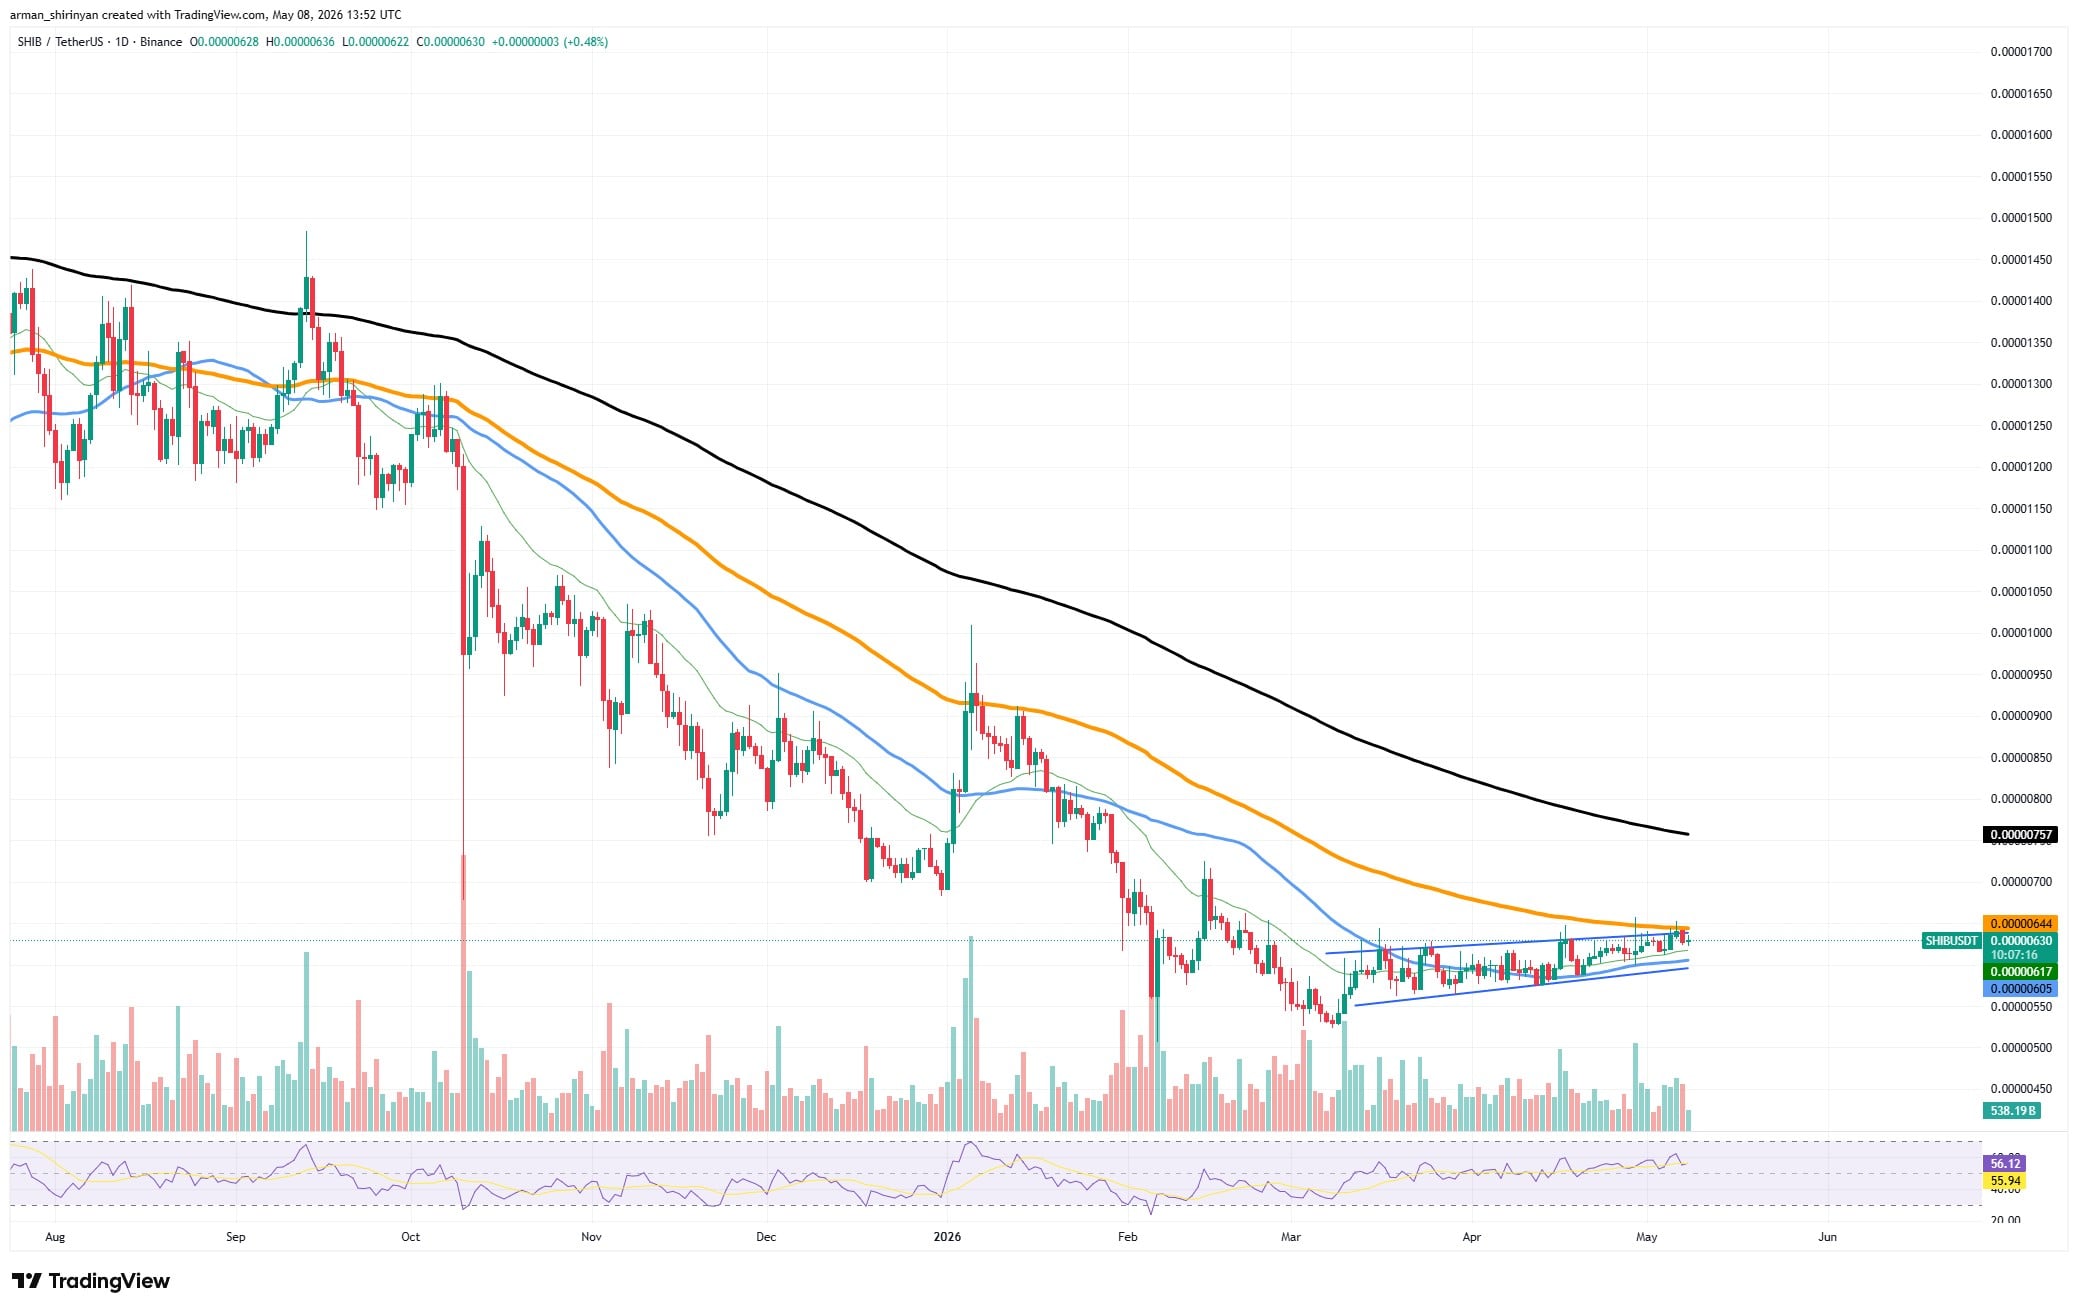
When momentum indicators stay neutral rather than overbought, failed breakouts inside downtrends typically function as continuation signals rather than reversal signals. When the RSI is close to the mid-50 range, it indicates weakness rather than strength.
Shiba Inu (SHIB), XRP, Toncoin (TON), Bitcoin (BTC) and Ethereum (ETH) Price Analysis for May 9th: Breakouts Fail, Key Support Levels Crack and Bullrun Momentum Collapses
XRP Price Eyes Breakout, TON Jumps 69%, Bollinger Finally Bullish on Bitcoin — Top Weekly Crypto News
For bulls to even start talking about trend reversal scenarios, a clear close above the 50-day and 100-day moving averages is required. SHIB is still structurally vulnerable up until that point. Sellers may swiftly drive the token back toward the March low area if support around the recent triangle base breaks.
You Might Also Like

Positively, the first indication that buyers are regaining control would be the recovery of the $0.00000640-$0.00000660 zone. As of right now, the market continues to favor a sustained downtrend over a sustained recovery rally.
XRP’s troublesome breakthrough
One of the weakest structures among large-cap altcoins at the moment is XRP. The asset repeatedly tested horizontal support around the $1.38 region and failed several times near descending resistance. Instead of accumulation, distribution is indicated by that pattern of repeated rejection. The larger structure continues to point downward.
The price is still below the 50-day, 100-day, and 200-day moving averages, all of which are still declining. After corrections, assets in robust bull markets typically swiftly recover their shorter-term moving averages. For months, XRP has not succeeded in doing that.
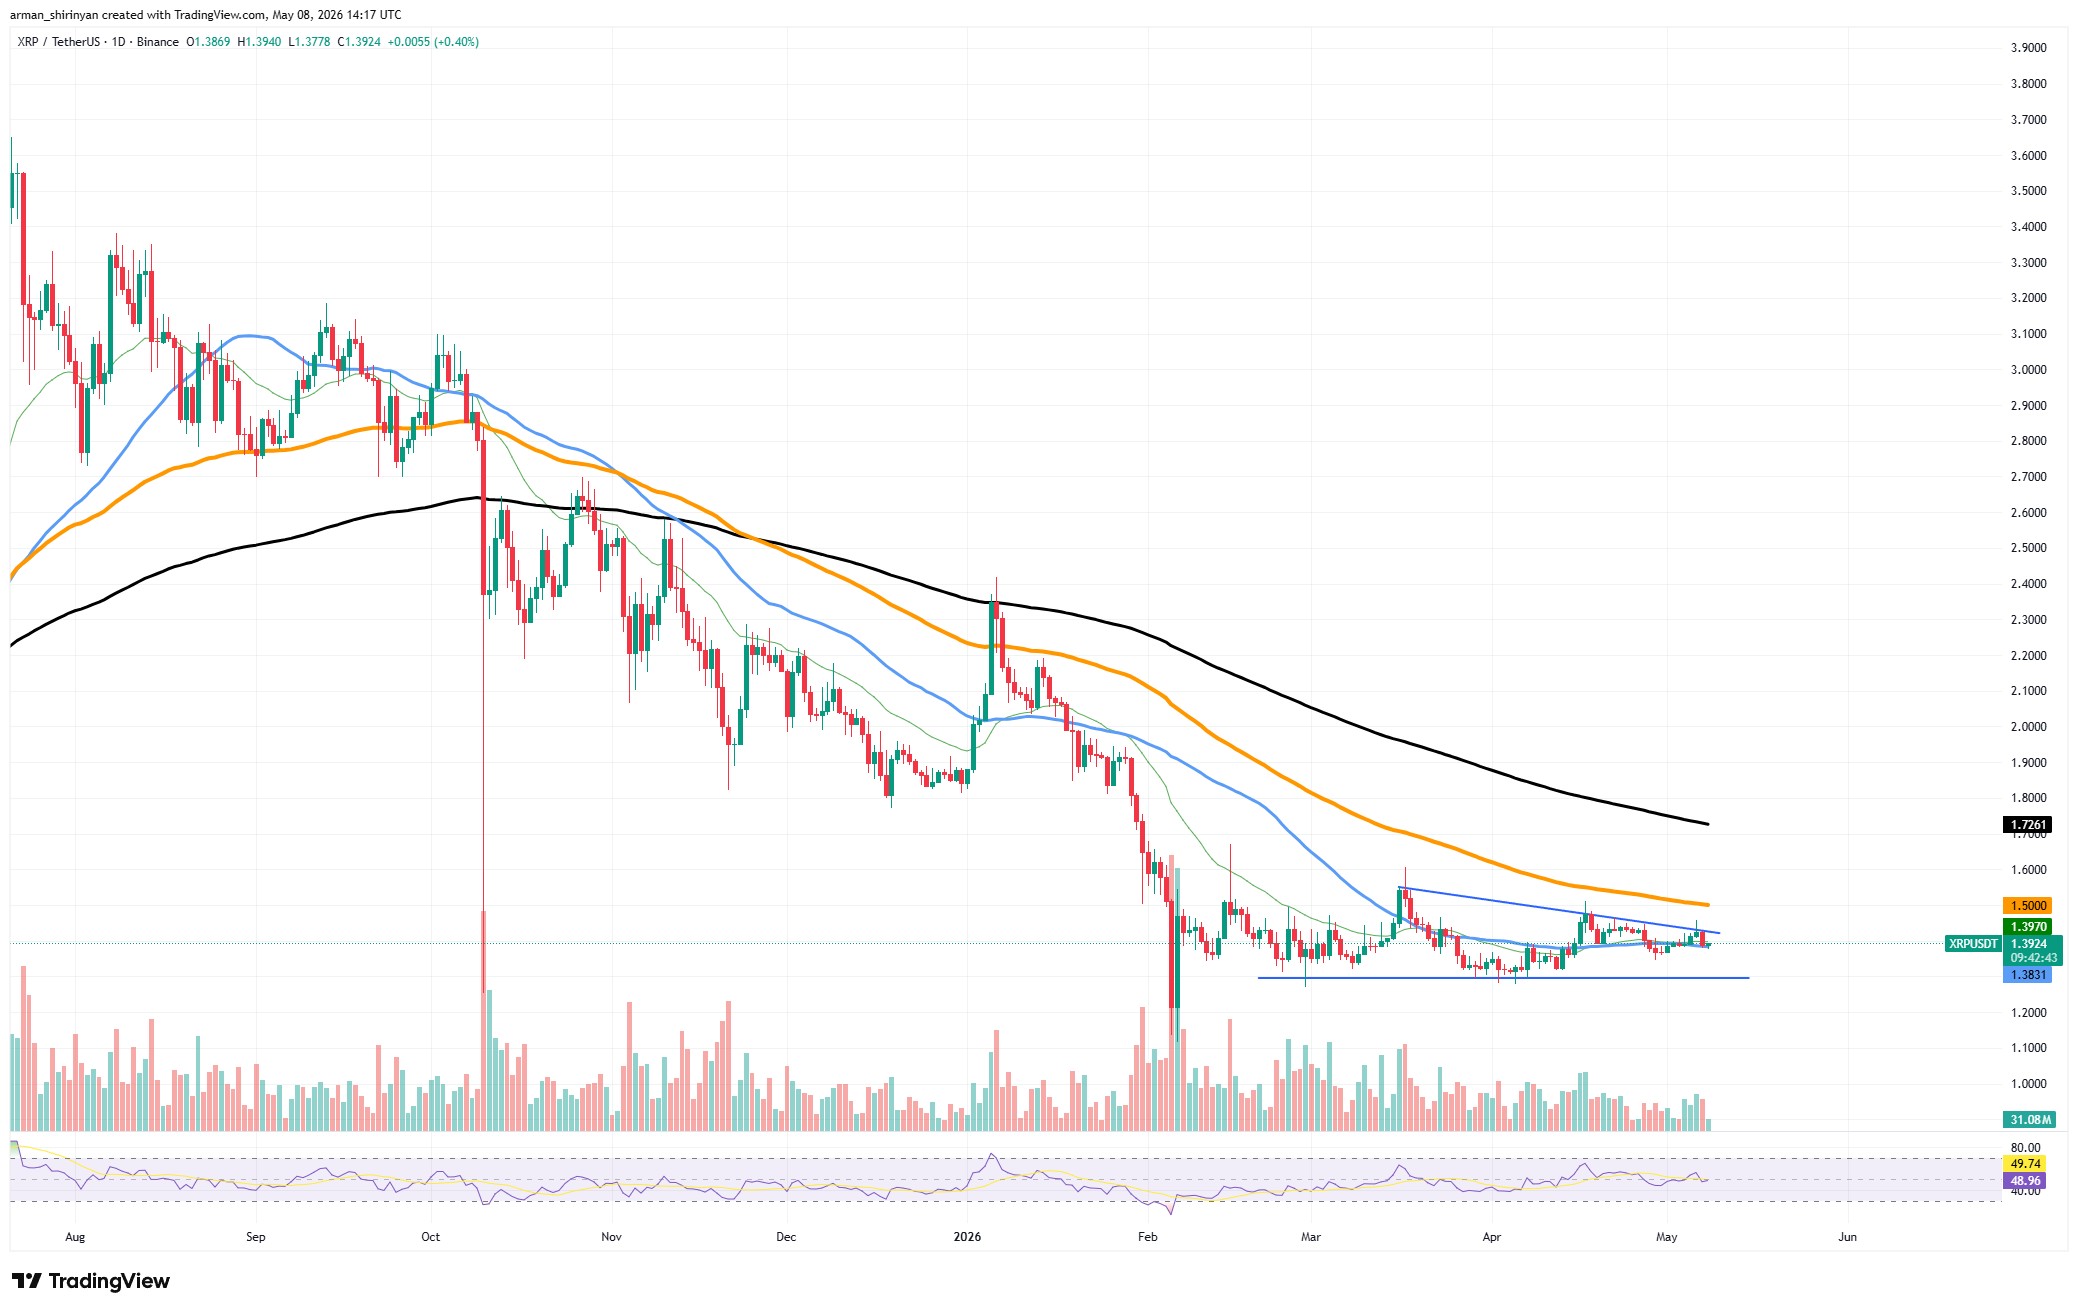
Conviction was also lacking in the most recent attempt at breakout. Before XRP could confront significant resistance close to the 100-day moving average, buyers temporarily drove the price higher, but the momentum subsided. The market rolled back into sideways compression rather than continuing. Unless bulls intervene forcefully, that kind of behavior typically precedes another volatility expansion lower.
Neutral RSI during a downtrend typically helps sellers more than buyers, but it also shows weariness on both sides. Currently, the key level is located close to the horizontal support zone. The next move could happen quickly as trapped long positions unwind if XRP loses that base handily.
You Might Also Like

In order for bulls to disprove the bearish structure, XRP would require both increasing volume and a clear breakout above declining trendline resistance. Without it, rallies are unlikely to be the beginning of a new impulsive upward movement, but rather relief bounces within a larger corrective cycle.
Toncoin’s excentric rocketing
Among the assets examined here, Toncoin is the obvious anomaly. The majority of large-cap cryptocurrencies are still having difficulty breaking through important resistance levels, but TON surged higher thanks to a near-vertical breakout and significant volume growth. The previous consolidation range was immediately rendered invalid by the move.
In a brief amount of time, the price recovered the 50-day, 100-day, and even 200-day moving averages. Instead of typical retail buying pressure, that kind of impulsive growth typically indicates aggressive institutional or whale-driven positioning.
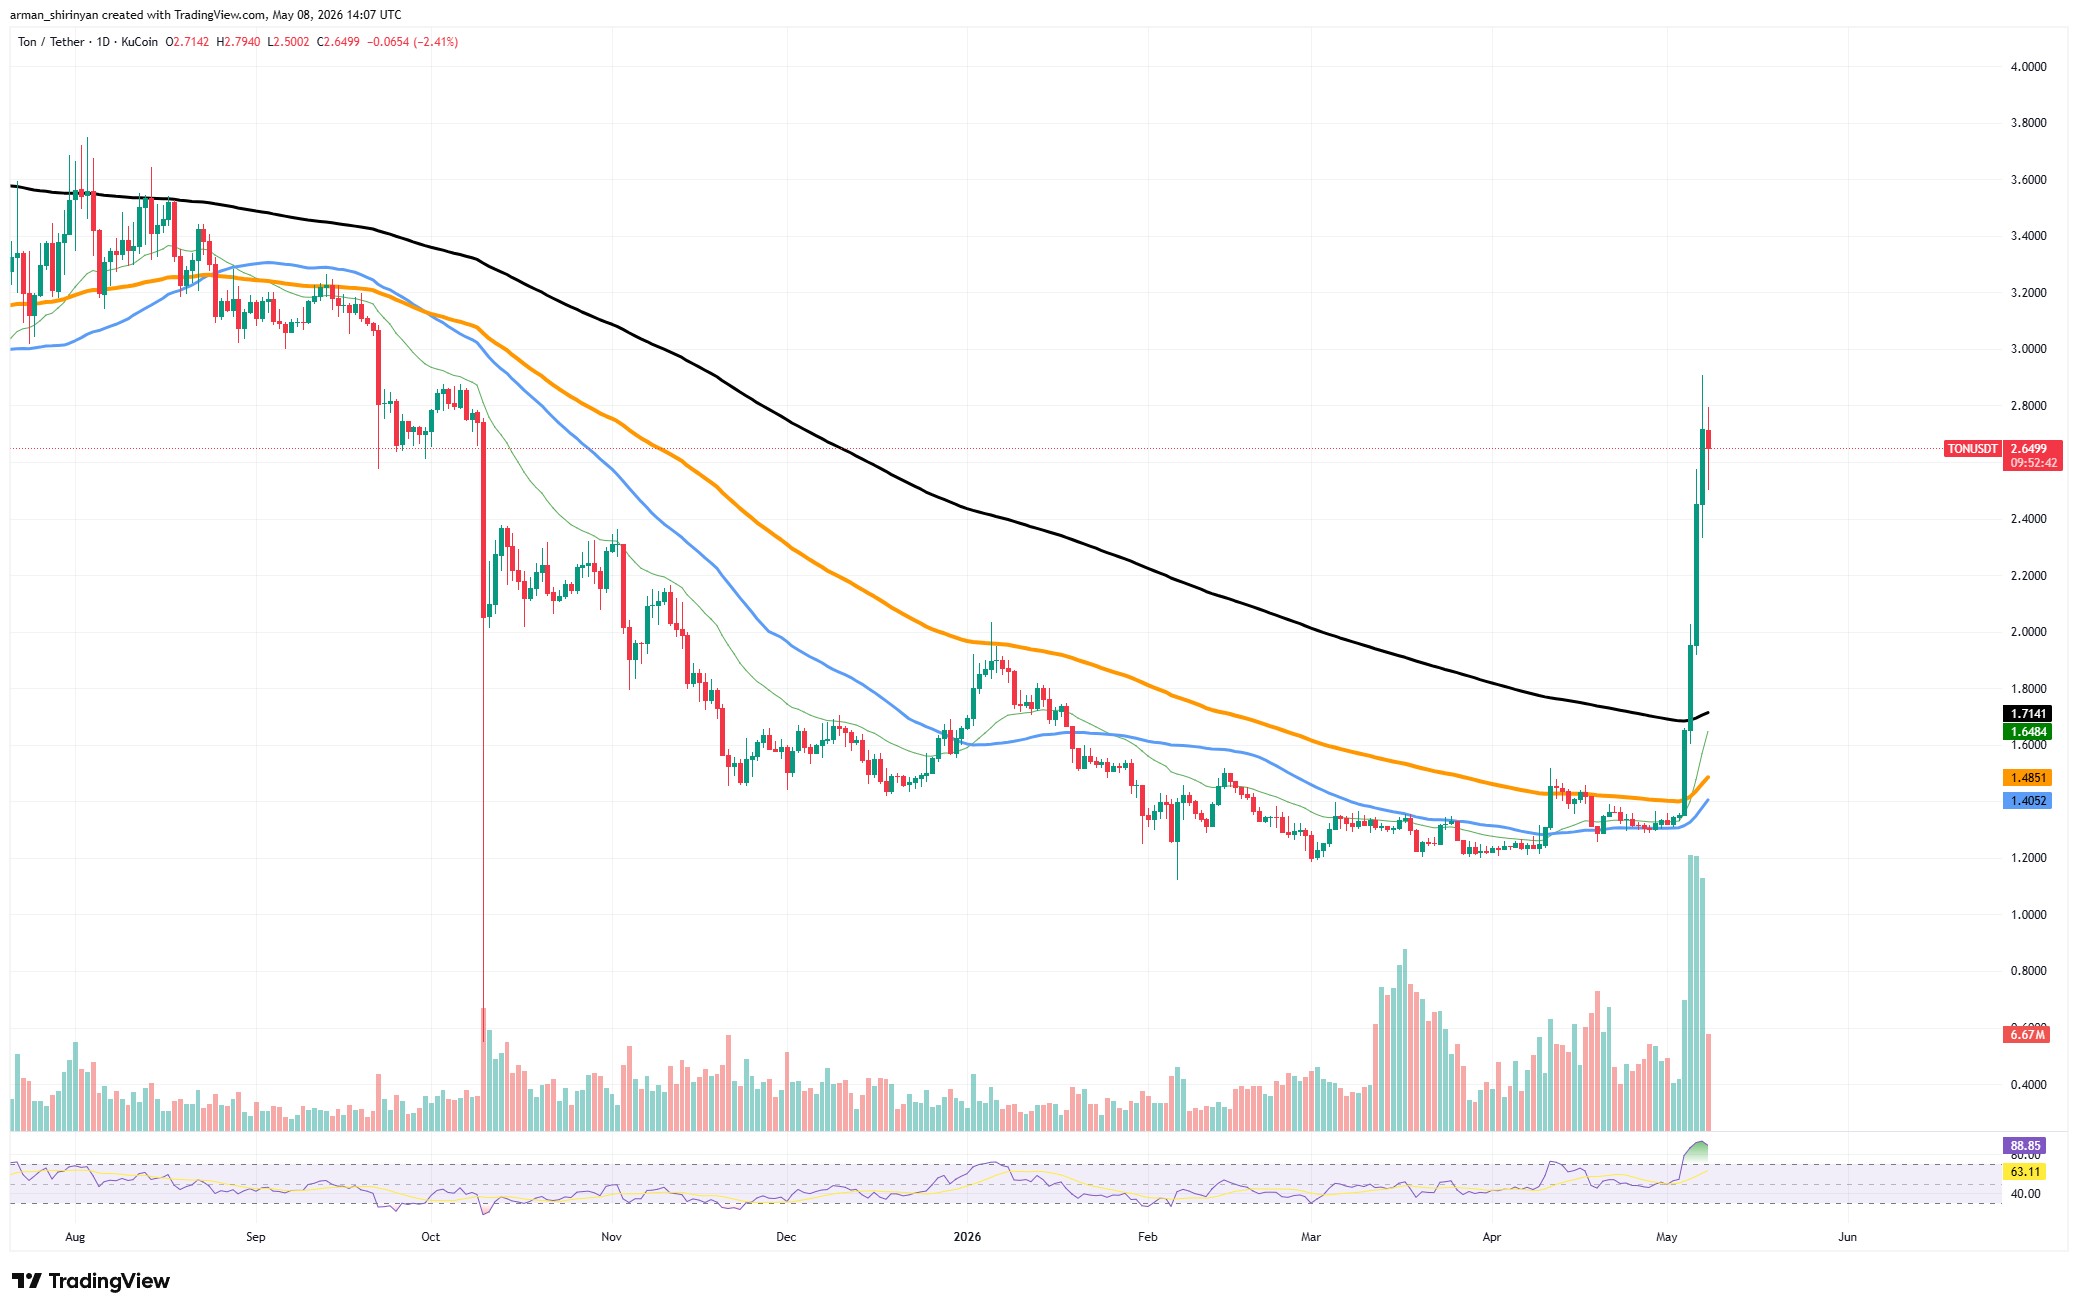
Volume verifies the validity of the breakout. TON printed one of its strongest relative volume spikes in months, in contrast to the feeble breakout attempts seen across SHIB, XRP, and ETH. This is significant because non-participatory breakouts frequently end abruptly. This one was obviously committed to the market.
However, overheating is now the rally’s new issue. The likelihood of short-term pullbacks or consolidation phases has historically increased when RSI rises well into overbought territory above 80. Rarely do vertical rallies go unbroken without profit-taking.
Whether TON can turn prior resistance close to the moving average cluster into support is currently the main question. The bullish structure is preserved, and a higher continuation is likely if buyers defend the breakout zone during any retracement. The move runs the risk of becoming a traditional blow-off spike if the price falls back below those recovered levels.
After such an aggressive expansion, TON now has the strongest momentum profile of the five charts, but it also carries higher short-term volatility risk.
Bitcoin’s stalemate point
Just below significant macro resistance, Bitcoin’s recovery rally is beginning to stall. BTC recovered above the 50-day and 100-day moving averages after rising sharply from the March lows, but the advance stalled close to the declining 200-day moving average in the $82,000 range. The 200-day average frequently establishes the boundary between bullish and bearish long-term market conditions, so this rejection is significant. To regain confidence, the bulls needed a clear breakout above it. Rather, as momentum slowed, price printed rejection candles.
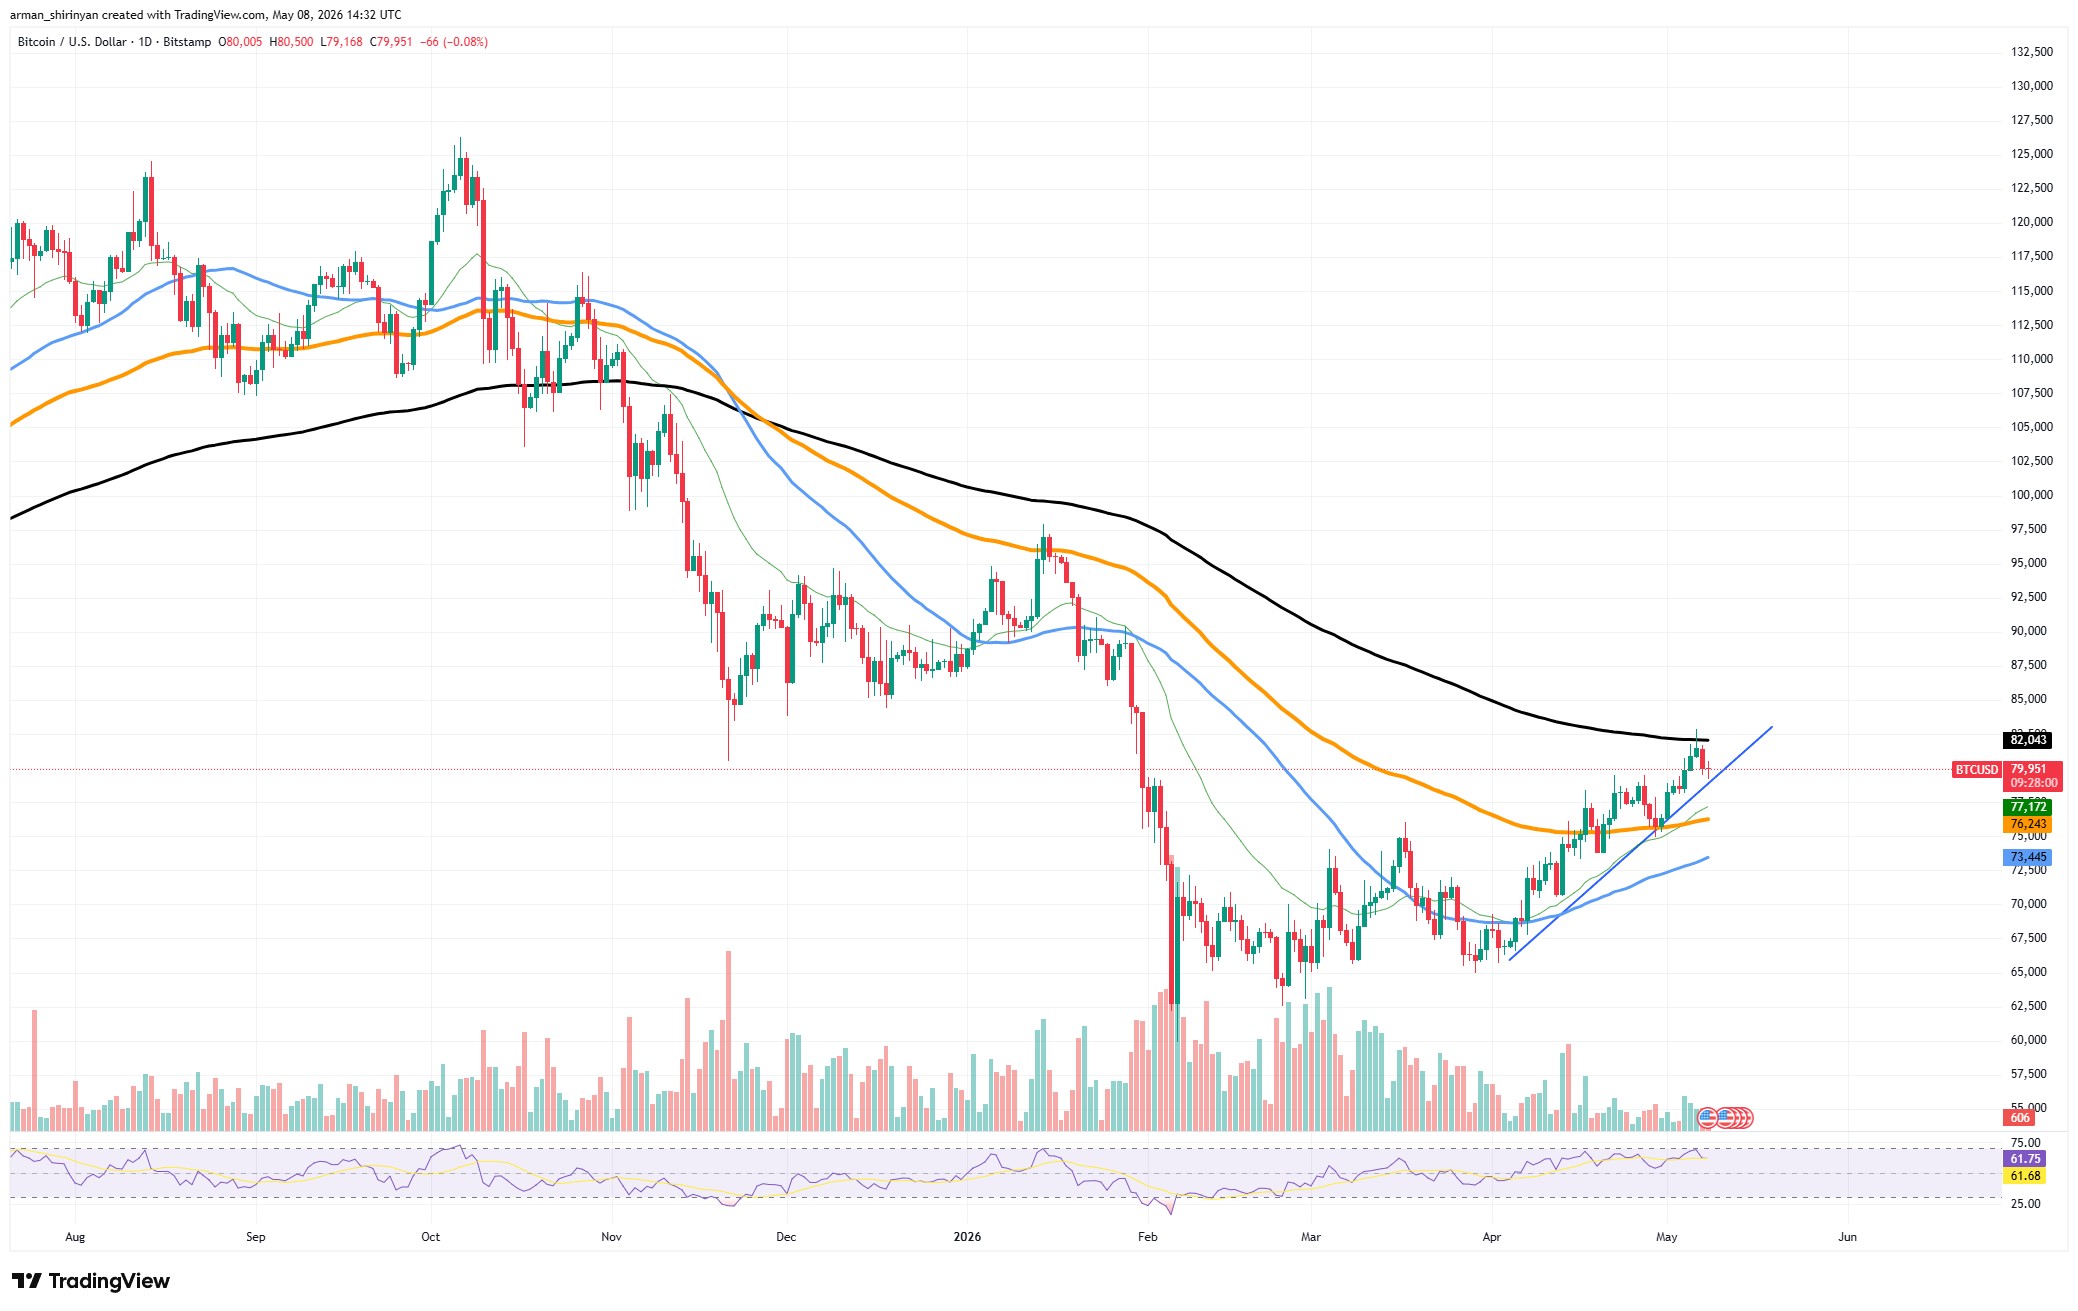
Concerns are also raised by the chart’s rising wedge structure. When volume declines during the advance, rising wedges during corrective rallies frequently resolve downward. Although the RSI is still high, it is not strong enough to support conditions for a sustained breakout.
The structure has not yet completely collapsed because Bitcoin is still above important short-term support close to the 50-day moving average. However, it is evident that the market’s impulsive momentum is waning. Sellers may swiftly target the 100-day moving average if Bitcoin loses the rising support trendline, which could cause larger altcoin markets to decline along with it.
Bitcoin needs to recover and maintain above the 200-day moving average with increasing volume in order for the bullish case to endure. Without that confirmation, the recent rally looks less like the start of a new leg higher in the bull cycle and more like a relief bounce inside a longer corrective phase.
Ethereum’s failed attempt
After yet another unsuccessful attempt at a breakout near declining resistance, Ethereum is displaying warning signs. ETH is trapped below the 100-day and 200-day moving averages while rejecting nearly perfectly from the upper trendline in the daily chart. Because Ethereum had finally begun to develop short-term bullish momentum in April, the rejection takes on greater significance.
You Might Also Like

Once the price hit overhead resistance, buyers were unable to hold onto the 50-day moving average. This incapacity to maintain momentum is a reflection of bulls’ lack of conviction and poor market participation. Rather than accumulation, the overall structure still looks like a bearish continuation pattern.
While volume is still erratic, ETH keeps creating lower highs. RSI in the vicinity of the low-50 region also indicates waning momentum as opposed to breakout power. The location of the 50-day moving average is a crucial technical detail. After failing at resistance, the price is now moving back toward it.
Bearish pressure could intensify rapidly and reveal the March lows once more if ETH closes sharply below the 50-day average. Buyers must recover the declining resistance trendline and then turn the 100-day moving average into support in order for Ethereum to regain a truly bullish structure. Until then, each rally runs the risk of turning into another lower high within the larger downtrend.
Because Ethereum was unable to even test the 200-day moving average before sellers regained control, it currently appears to be structurally weaker than Bitcoin.