
The S&P 500 closed at 7,126 on April 17, another record, while the University of Michigan’s preliminary April consumer sentiment reading fell to 47.6, the weakest print in the survey’s history.
The split on the screen looks surreal.
Charlie Bilello shared the chart below, highlighting the gap.
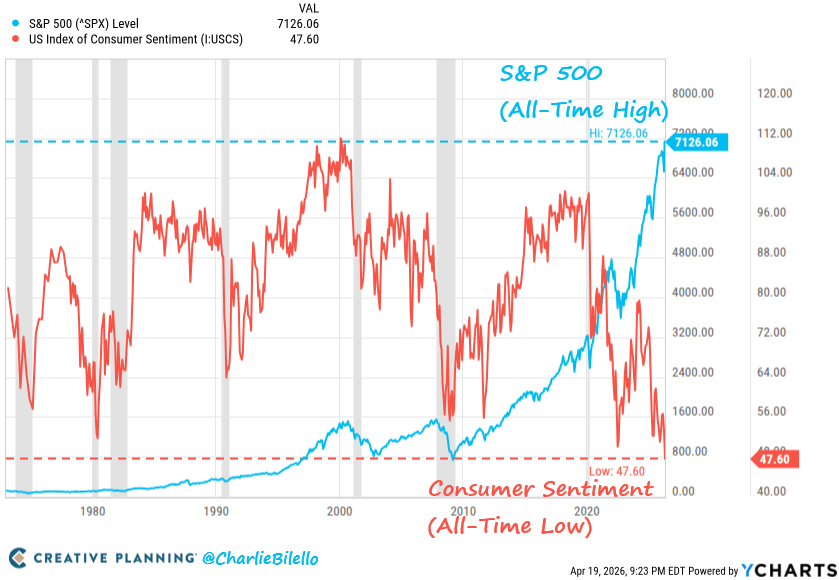
Wall Street is trading at altitude. Households are signaling something far darker.
Bitcoin sits in the middle of that gap, pulled between its hard-asset mythology and its actual behavior in a market regime still dominated by equity risk, ETF flows, and macro positioning.
That tension gives the current setup its shape. It also gives the dot-com comparison a fresh audience, because the concern centers on the anatomy of late-cycle rallies.

A recent look under the hood of the S&P 500 shows how much of the earnings revision support has come from a narrow group of names, with Micron alone accounting for 51% of positive earnings revisions since the Iran war began.
That sits alongside concentration data showing the top 10 holdings at 35.5% of SPY and the Mag 7 at 30.4%.
The index can keep climbing in that kind of structure. It can also become more fragile in exactly the moment it looks strongest.
For Bitcoin, the core question is straightforward.
If the stock rally turns out to be thinner than the headline index suggests, does BTC absorb the shock like a high-beta extension of risk appetite, or does it hold up as distrust in the broader system spreads?
Recent market behavior leans toward the first answer.
In March, Bloomberg reported that Bitcoin’s 30-day correlation with the S&P 500 rose to 0.74, the highest level of the year.
That does not settle the long-term identity debate around Bitcoin. It does narrow the short-term map.
In this phase, BTC has been moving in sync with stocks, and many holders want it to trade as an alternative.
Wall Street is celebrating, households are retreating
The clearest way to understand the present moment starts with the household side of the economy, because that is where the emotional reality comes through most sharply.
The Michigan survey sank 10.7% from March, with current conditions at 50.1 and expectations at 46.1.
Joanne Hsu, the survey’s director, said the slide extended a decline that began with the start of the Iran conflict, while respondents pointed to high prices, weaker asset values, and worsening buying conditions for durable goods and vehicles.
One-year inflation expectations jumped from 3.8% to 4.8%, the largest monthly increase since April 2025.
This is what a squeezed consumer sounds like.
Gas, groceries, financing costs, and uncertainty around household balance sheets all show up in that reading.
Energy is part of the bridge between Main Street and the market.
U.S. crude has risen to $87 and Brent to $95 after renewed tension in the Strait of Hormuz, with national average gasoline prices around $4.05 a gallon.
The survey itself points back to the Iran conflict as a driver of deteriorating sentiment.
Consumers do not need to model earnings revisions or passive inflows to feel this.
They experience it at the pump, in their shopping cart, and in how they think about replacing a car or taking on new credit.
At the same time, the equity market has been behaving as if those pressures are manageable.
The S&P 500 keeps printing all-time highs, and the Nasdaq just logged one of its most powerful bursts on record.
Plenty of that move has a rational foundation.
Earnings have held up better than feared in key pockets of the market, and hopes of de-escalation in the Middle East have offered investors a reason to take on risk again.
Even so, the divergence has widened into something difficult to ignore.
Household psychology is signaling strain. Asset prices are still signaling resilience.
That gap creates the natural tension around Bitcoin.
Crypto holders do not need another abstract debate about whether consumer sentiment can predict a recession.
The practical question is: what happens to BTC if the market decides that households have been sending the truer signal?
Bitcoin is trading around $75,500 on CryptoSlate, down 0.40% over 24 hours, up 6.3% over seven days, and up 6.5% over 30 days.
The coin has stabilized, and ETF demand has helped, though the price structure still sits 41.3% below its October 2025 all-time high of $126,198.
That leaves room for two very different interpretations.
One sees consolidation ahead of another leg higher. The other sees a market still tethered to the same macro forces that lift and threaten equities.
The dot-com analogy is useful, concentration is the sharper lens
The Nasdaq chart from 2000 has a way of resurfacing every time a market gets stretched.
It resurfaces for a reason.
Bear markets often feature violent countertrend rallies that feel persuasive in real time.
The 2000 to 2002 sequence included rebounds of 35%, 12%, 25%, 41%, and 45% before the full drawdown ended at 78%. Thierry Borgeat shared the chart below.
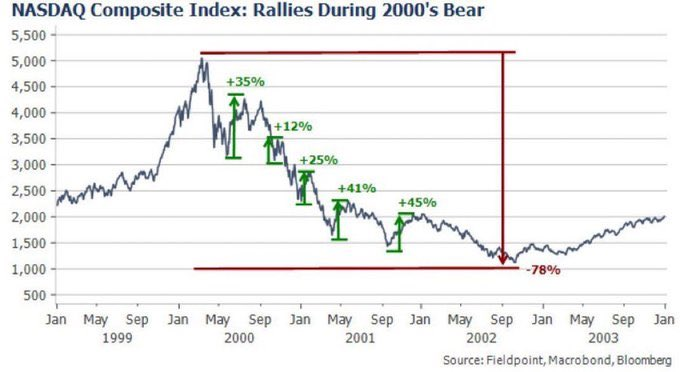
That pattern reminds investors that powerful upside bursts can happen inside broader periods of repricing.
It also reminds them that the path and destination can point in different directions for a long stretch.
Today’s setup still carries a different structure.
The late-1990s market was loaded with companies built on fragile business models, speculative capital, and distant earnings promises.
Today’s leaders are larger, richer, and far more cash generative.
That changes the comparison. It also raises a different risk.
When leadership narrows, and index performance depends on a smaller and smaller set of engines, the benchmark can project strength even as participation beneath it thins.
That is why the recent market internals warrant more attention than the “pure bubble” label.
Goldman Sachs data show that Micron was responsible for 51% of S&P 500 earnings-per-share revisions since the Iran war began, while Exxon Mobil, Chevron, and ConocoPhillips together contributed another 29%, and Broadcom 10%.
The median S&P 500 company saw no change in earnings expectations.
That leaves the rally resting on a narrow support base.
It does not guarantee a break, though it leaves the structure more exposed to disappointment in a small number of names and sectors.
Concentration data points in the same direction.
The top 10 holdings in SPY (35.59%) and the Mag 7 (30.44%) tell the same story in plain English.
A lot of the market’s apparent health is sitting on a small platform.
Valuations remain elevated, too.
YCharts’ cyclically adjusted P/E data and other long-run valuation measures reflect a market priced for confidence.
When leadership narrows, it takes fewer weak points to change the tone of the whole market.
When positioning is crowded, the unwind can travel faster than the buildup did.
Bitcoin’s role in that setup has changed over the last year.
Spot ETFs have made BTC a more direct channel for institutional capital, bringing both sponsorship and sensitivity.
SoSoValue’s Bitcoin ETF dashboard shows the sector attracting meaningful capital again, with $664 million in net inflows on April 17, following a March rebound after months of outflows.
Those flows can cushion a weak session.
They can also transmit a broader risk appetite straight into crypto.
Bitcoin gains a larger buyer base through ETFs, and it also inherits more of Wall Street’s mood swings through the same door.
Bitcoin is approaching an identity test
That leaves Bitcoin in a position that feels unresolved, which is the central tension running through the market now.
It is caught between two roles.
One role is a liquid risk asset that tends to run when stocks run, especially when ETF inflows are healthy and macro stress is easing.
The other role is a harder asset that can attract capital when confidence in the broader financial order weakens.
In previous cycles, those narratives often took turns. This time, they are competing in the same frame.
The near-term market still favors the risk-asset interpretation.
Bitcoin’s elevated correlation with the S&P 500 shows how the market has been treating BTC as part of the same broader appetite for risk.

The current price data on CryptoSlate’s Bitcoin page shows recovery, though the market has not yet reclaimed its prior peak.
A calm macro backdrop, continued ETF buying, and broader participation in equities could keep that stabilization going.
In that path, Bitcoin would likely keep grinding higher alongside the same forces lifting tech and large-cap growth.
A more consequential path opens if the divergence between Wall Street and households closes through falling asset prices rather than through improving consumer confidence.
That is where Bitcoin’s identity test becomes tangible.
A crack in equities driven by narrow leadership, fading systematic support, or renewed energy stress would put immediate pressure on BTC if the current correlation regime holds.
The move would not need a crypto-specific trigger.
Stocks could do the work on their own, and Bitcoin could absorb the second-order impact through sentiment, positioning, and ETF flows.
There is another route as well, and it is the one Bitcoin bulls still have in mind.
If household stress persists, inflation fears remain sticky, and confidence in traditional assets weakens without turning into outright liquidation, Bitcoin could begin to trade more like a parallel store of value than a leveraged tech proxy.
That path is harder to call from today’s evidence.
It would likely require relative strength against the Nasdaq during a wobble in equities, along with steady ETF inflows and renewed demand for assets perceived as outside direct sovereign control.
The setup is possible. The market has not yet confirmed it.
For now, the live detail sits in the split-screen itself.
Stocks are celebrating, consumers are retreating, oil is still capable of repricing inflation expectations overnight, and Bitcoin is holding a middle ground that may not hold forever.
That is why the comparison to 2000 keeps returning.
It captures the emotional risk of powerful rallies that arrive on uneasy foundations.
It also leaves room for a more precise conclusion.
The current market does not need to be a replay of the dot-com bubble for Bitcoin holders to have a real exposure problem.
A concentrated stock rally and a deeply pessimistic consumer can coexist for a while.
They rarely coexist without consequence.