
Aster developments split across two names that people often mix up: Aster Protocol (DEX/DeFi project with the ASTER token) and Astar Network (Polkadot ecosystem chain with the ASTR token). Today, one moved treasury funds to prepare its next airdrop stage, and the other advanced a token-economics overhaul and confirmed a November infrastructure migration. These updates affect users, governance, and throughput rather than price.
Aster Protocol: treasury shift for Stage 2 and heavier on-chain usage
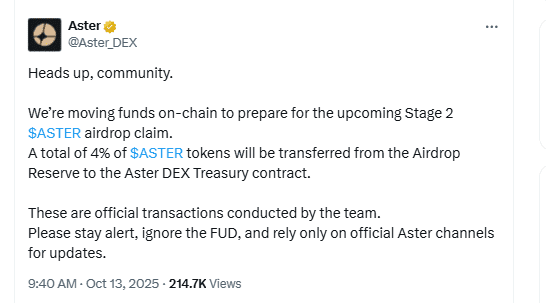
Aster DEX transferred 4% of the ASTER supply to its treasury as it gears up for Stage 2 airdrop operations. The team framed the move as pre-funding and logistics for claims, audits, and distribution controls. This on-chain shift sets the mechanics before user flows scale, which reduces last-minute friction during claiming and helps external reviewers track allocations in a single venue.
At the same time, network usage accelerated. Internal tallies shared via exchange research desks placed Aster Protocol’s 24-hour fees near $4.9 million, which ranked it fourth among blockchains by daily fees in that window. While fee leaderboards fluctuate, this level signals heavy execution demand across swaps and liquidity operations. It also gives developers a live read on congestion and throughput needs ahead of the airdrop stage.
Consequently, the operational story centers on readiness. With funds positioned in the treasury and activity elevated, Aster can stage claims, verify integrity, and handle support without rerouting assets mid-flight. That order of operations matters for reliability because claim paths, monitoring, and post-claim analytics all depend on where the tokens sit before distribution begins.
Astar Network: Tokenomics 3.0 momentum and DOT migration on Nov. 4
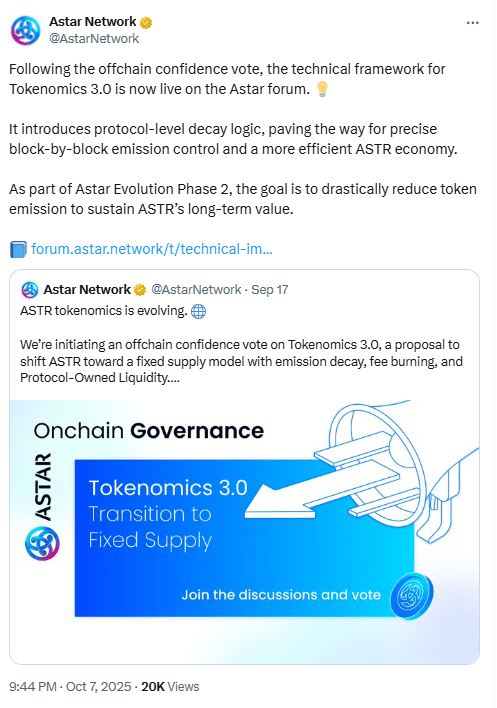
Separately, Astar Network continued pushing Tokenomics 3.0, a package aimed at tighter supply mechanics and fee alignment. Core posts flagged an off-chain confidence vote and described a target of moving toward fixed-supply parameters with emission decay and fee adjustments. The public RFC stream also introduced “Burndrop” as a voluntary mechanism, prompting community debate about scope, process, and effects on circulating supply. The discussion reflects a governance phase where specifics and safeguards get hammered out in public before any irreversible action.
In parallel, the team confirmed a maintenance window on November 4 to support Polkadot’s architecture changes. During that window, DOT balances, staking, and governance functions that Astar surfaces will migrate to the Polkadot Asset Hub. This reduces fragmentation across Relay-Chain features and positions Astar to keep parity with Polkadot’s evolving module layout. Users who interact with DOT-related actions through Astar should expect updated pathways after the cutover.
Taken together, Astar’s thematic focus is structural. Tokenomics 3.0 sets long-term incentives, while the Asset Hub migration updates the plumbing for DOT operations. Because both steps touch core flows—issuance schedules, fee routing, staking, and governance—they require clear signposting and staged rollout, which the team has begun to provide via public threads and schedules.
The names are close, yet the consequences differ. Aster Protocol’s treasury action affects how the next airdrop runs and how observers trace allocations; its fee spike shows where execution pressure sits right now. Astar Network’s roadmap work affects who controls supply rules and where DOT-related functions live after November 4. Readers who build, validate, or integrate should track both—but for distinct operational reasons.
ASTERUSDT 4h: price stays below the 50-EMA as momentum cools
Aster traded near $1.36 on the 4-hour chart, while the 50-period EMA (~$1.59) trended lower above price. The pair has printed lower highs since Oct 7 and failed to hold a brief bounce after the Oct 11 volatility spike that produced a long lower wick. Meanwhile, reported volume sits near 3.23M, easing after that shock move, which points to consolidation rather than impulsive trend change.
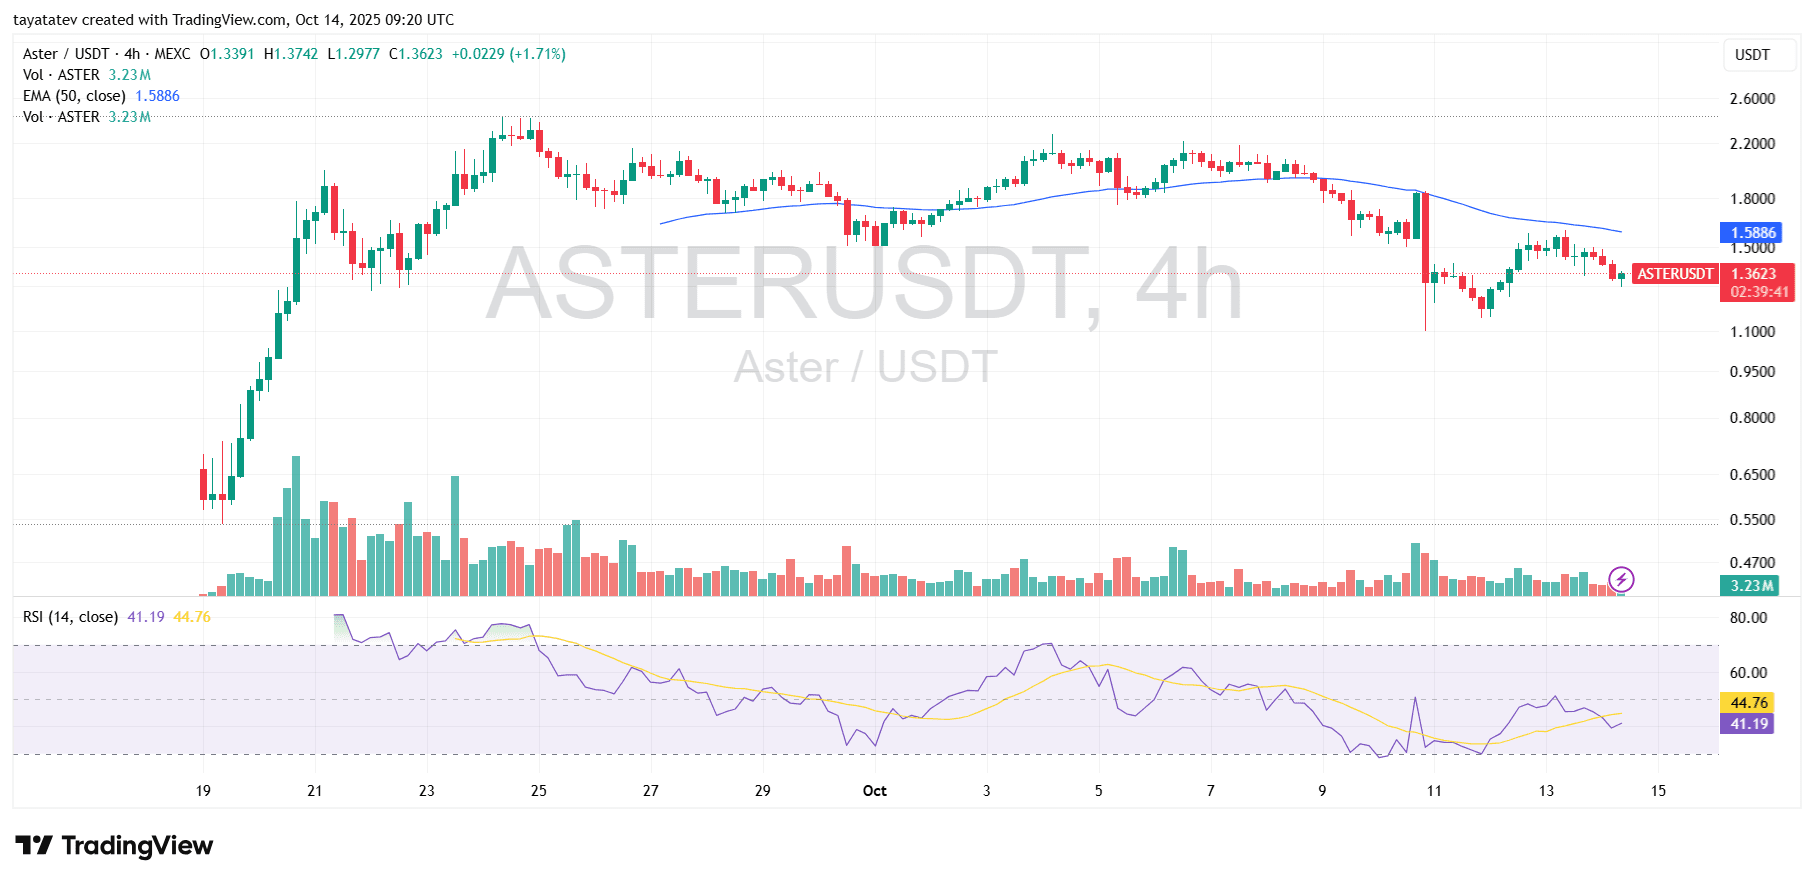
The indicators lean soft. The 50-EMA acts as dynamic resistance, capping rallies since last week. The RSI (14) sits around 41, recovering from an oversold dip below 30 on Oct 10–11, yet it remains under its signal line (~45) and below the neutral 50 mark, which implies momentum has not turned up decisively. Volume contracted after the spike; without renewed participation, rallies struggle to clear overhead supply.
Looking ahead, the levels are clear. If buyers reclaim and hold above the 50-EMA (~$1.59) on a 4-hour close, the door opens for a retest of the $1.75–$1.80 supply zone that rejected advances earlier. However, repeated rejection under the EMA keeps focus on nearby $1.30 support, with the $1.10 wick area as a secondary downside magnet if momentum fades again. Watch for an RSI push through 50 alongside a volume expansion to validate strength; otherwise, sub-50 RSI with a falling EMA favors a range-bound or drifting tape.
ASTERUSDT 4h MACD: early bullish cross, but still below zero
The MACD line just crossed above the signal line below the zero axis. The histogram flipped slightly positive (~0.01) after a deep negative trough on Oct 11–12. This shift signals fading downside momentum and an early attempt to base.
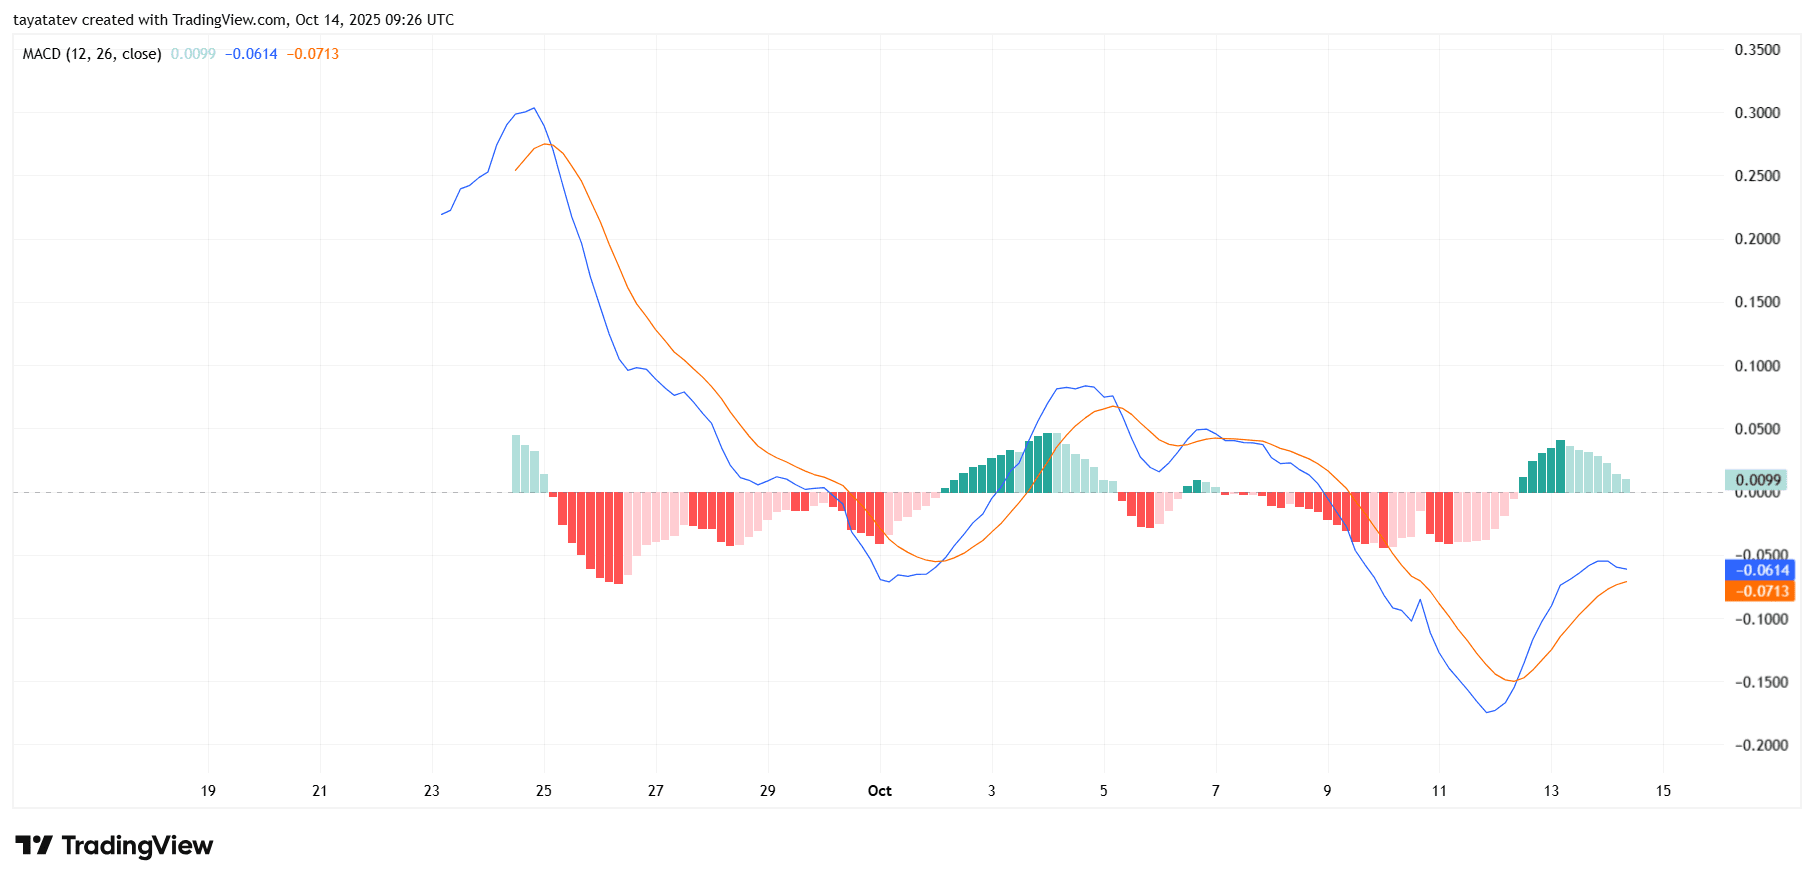
However, both the MACD (~-0.061) and signal (~-0.071) remain negative, so trend strength has not turned up yet. In this state, rallies often stall unless momentum keeps building. We need the histogram to expand and the MACD pair to climb toward the zero line to confirm improvement.
If the histogram grows and the lines reclaim zero, bullish momentum gains credibility and price can sustain pushes into overhead levels. But if the histogram shrinks back toward zero and the lines curl lower, the cross becomes a bearish fade and downside pressure can resume. Watch for sequence: expanding green bars first, then a drive through the zero line to validate follow-through.