
Bitcoin printed a deep “liquidation candle” on Binance perps. Price wicked from the 127.5k resistance area down to ~103.5k, then closed back above ~111k. This pattern echoes December 2021: a sharp leverage flush near a range high, followed by a bounce. The wick shows forced selling and engine-driven liquidations, not orderly spot distribution. However, the trend only flips bearish if follow-through breaks structure.
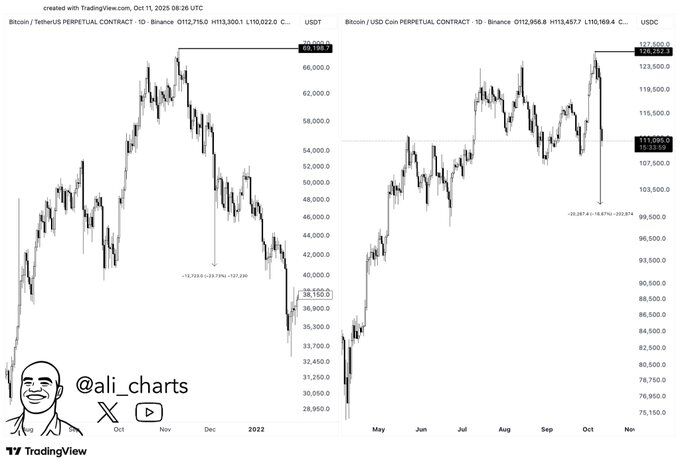
Now, the levels matter more than the headline. First, 127.5k acts as clear resistance; sellers defended it twice. Second, ~111k is the range midpoint on the chart and the line the market must hold on daily closes to keep the range intact. Third, the wick low around 103–105k is the “liquidity tail” and a stress point: a revisit would signal weakness, while a higher low above it would show absorption.
Therefore, the roadmap is simple. Hold and build above ~111k, then reclaim 120–122k, and range continuation back to 127.5k remains in play. Lose ~111k on a daily close, and risk rises for a drive into 105k–103k. Break decisively below the wick low, and the structure starts to resemble 2021’s post-flush rollover rather than a one-off purge.
Similarities with 2021 exist—location near range highs and a massive long-liquidation spike. Differences matter too: today’s market has larger spot participation and ETF-driven flows, which can cushion forced sells. Even so, price action rules. Watch closes around 111k, reactions at 120–122k, and whether buyers defend the 103–105k tail.
Derivatives data show ~$19.31B in 24-hour liquidations, far above the ~$1.2B during the March 2020 COVID crash and ~$1.6B around the FTX collapse. Long positions account for ~$16.81B versus ~$2.50B in shorts, so the move was a long-side flush.
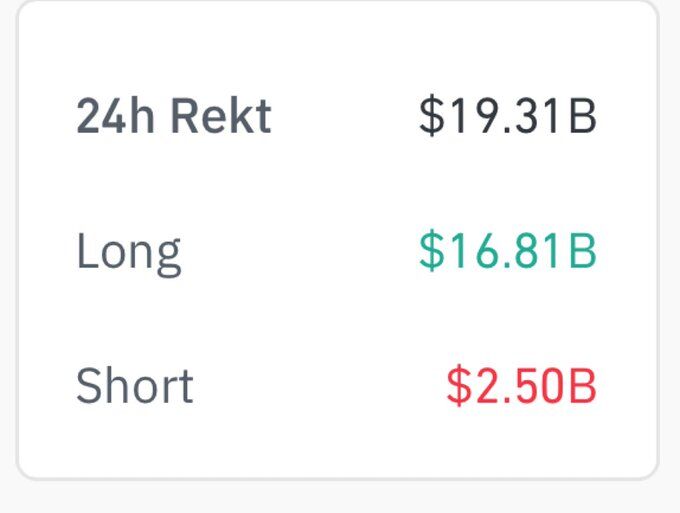
This profile points to a classic leverage cascade. As price fell, auto-deleveraging and margin calls forced long closures, which pushed price lower and triggered more liquidations. Consequently, open interest likely compressed, funding likely flipped or moved toward neutral, and basis narrowed as futures repriced to spot.
The signal is positioning, not direction. A market that sheds this much long leverage often trades cleaner afterward because excess risk is gone. Yet trend depends on what follows: if open interest rebuilds alongside stable funding and spot demand, the move reads as a reset; if price loses recent support while OI stays low, it resembles distribution after a squeeze.
Long-term holder whales realized about $69–70 million in profit around Oct. 3. That signals distribution into strength, not capitulation. Realized profit spikes often appear near local highs as mature coins move to the market. Price then either absorbs the supply and continues, or it stalls and retraces.
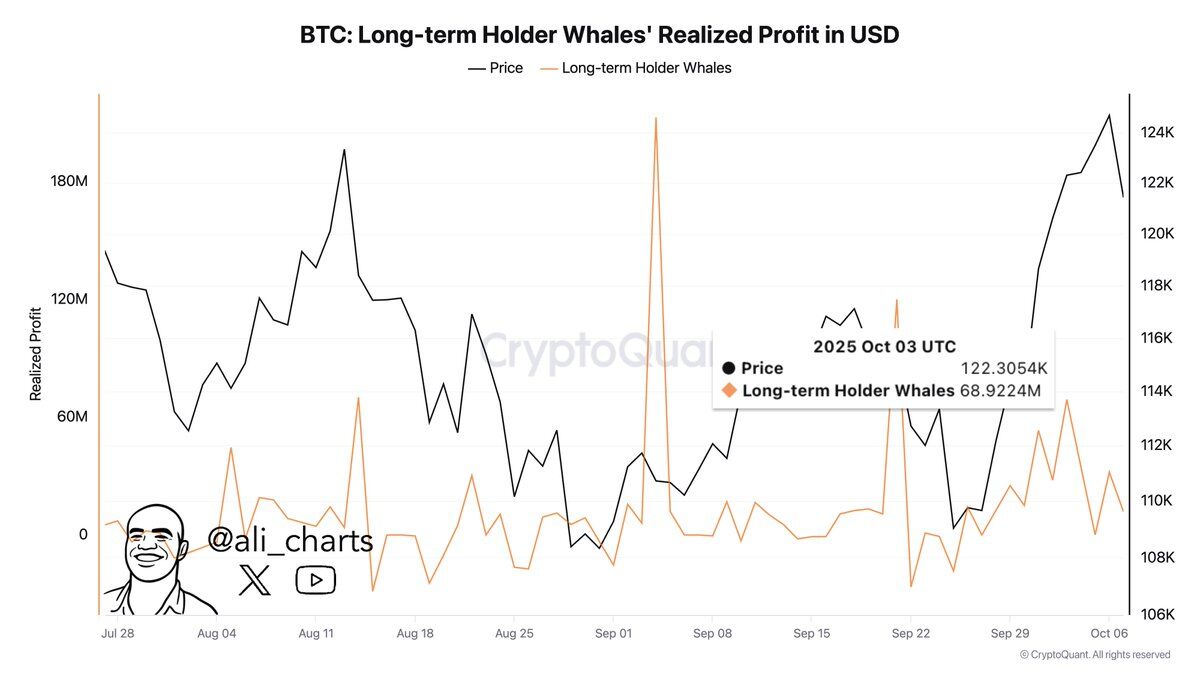
Context matters. Funding had been rich and open interest elevated before the flush. Whales selling into that backdrop often cool momentum. If spot demand remains firm, the market can digest these profits without damage. However, if realized profits stay high while price makes lower highs, the signal weakens.
Therefore, track two things next. First, see if realized profits retreat while price stabilizes. That implies absorption and healthy rotation. Second, watch daily closes near recent support. Holds suggest a reset; repeated profit-taking on upticks suggests distribution.
Several large batches of BTC moved from Binance hot wallets to a Wintermute-labeled hot wallet over the past hours. Individual transfers ranged around ~130–230 BTC, adding up to tens of millions of dollars. These are on-exchange hot wallets sending to a market maker’s hot wallet, which typically funds market-making inventory, OTC settlement, or rebalancing during high volatility.
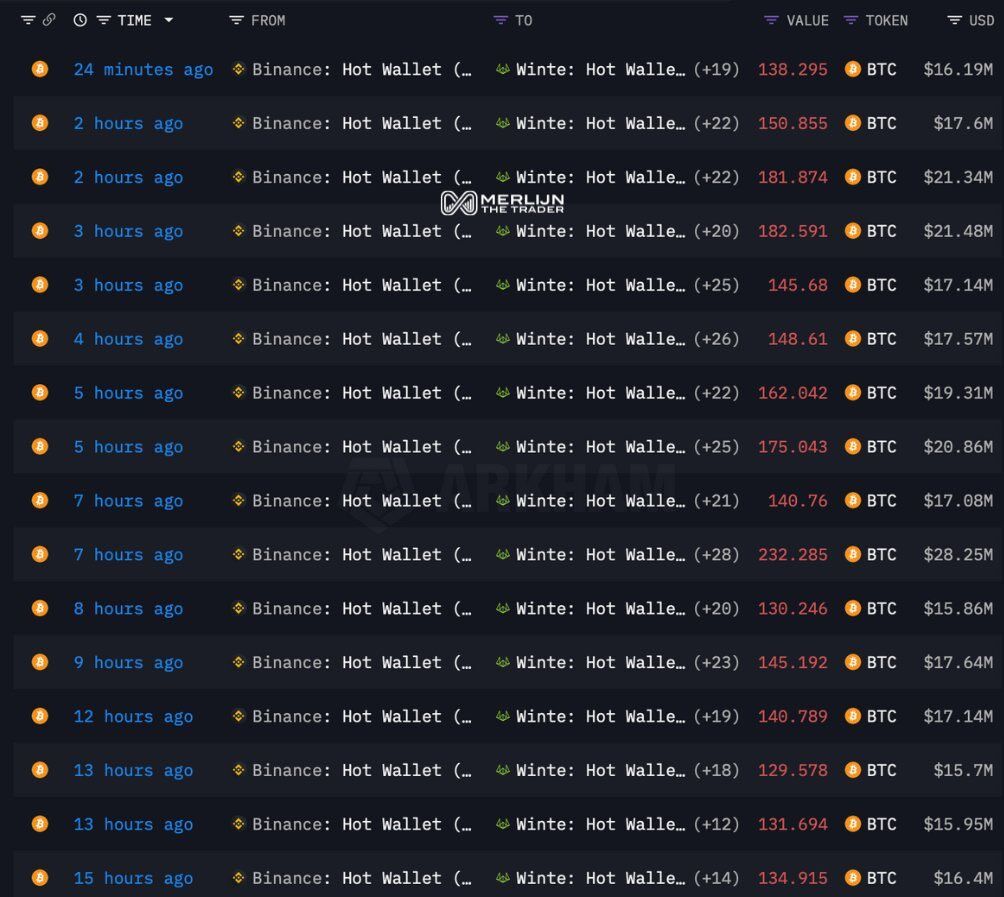
The flow itself is neutral. It shows Wintermute preparing inventory to provide two-sided liquidity, tighten spreads, or support client trades. Direction depends on how that inventory is deployed. If coins rotate back onto exchanges and depth improves, spreads should stabilize. If they move the other way after fills, it suggests completed client execution.
Watch execution footprints next: changes in Binance book depth, spreads across majors, and any follow-on transfers between Wintermute wallets and exchange deposit addresses. Those will indicate whether this inventory fuels immediate trading or settles OTC flows.
BTC 4H: post-flush rebound targets 116k–120k, but 111k must hold
Bitcoin printed a violent liquidation wick to ~107k, then bounced to ~115k. Price sits below the falling 50-EMA (~119.5k), which caps the first rebound. RSI rebounded from oversold (~25) to ~33, so momentum improves, yet it remains sub-50 and signals a repair phase, not trend strength.
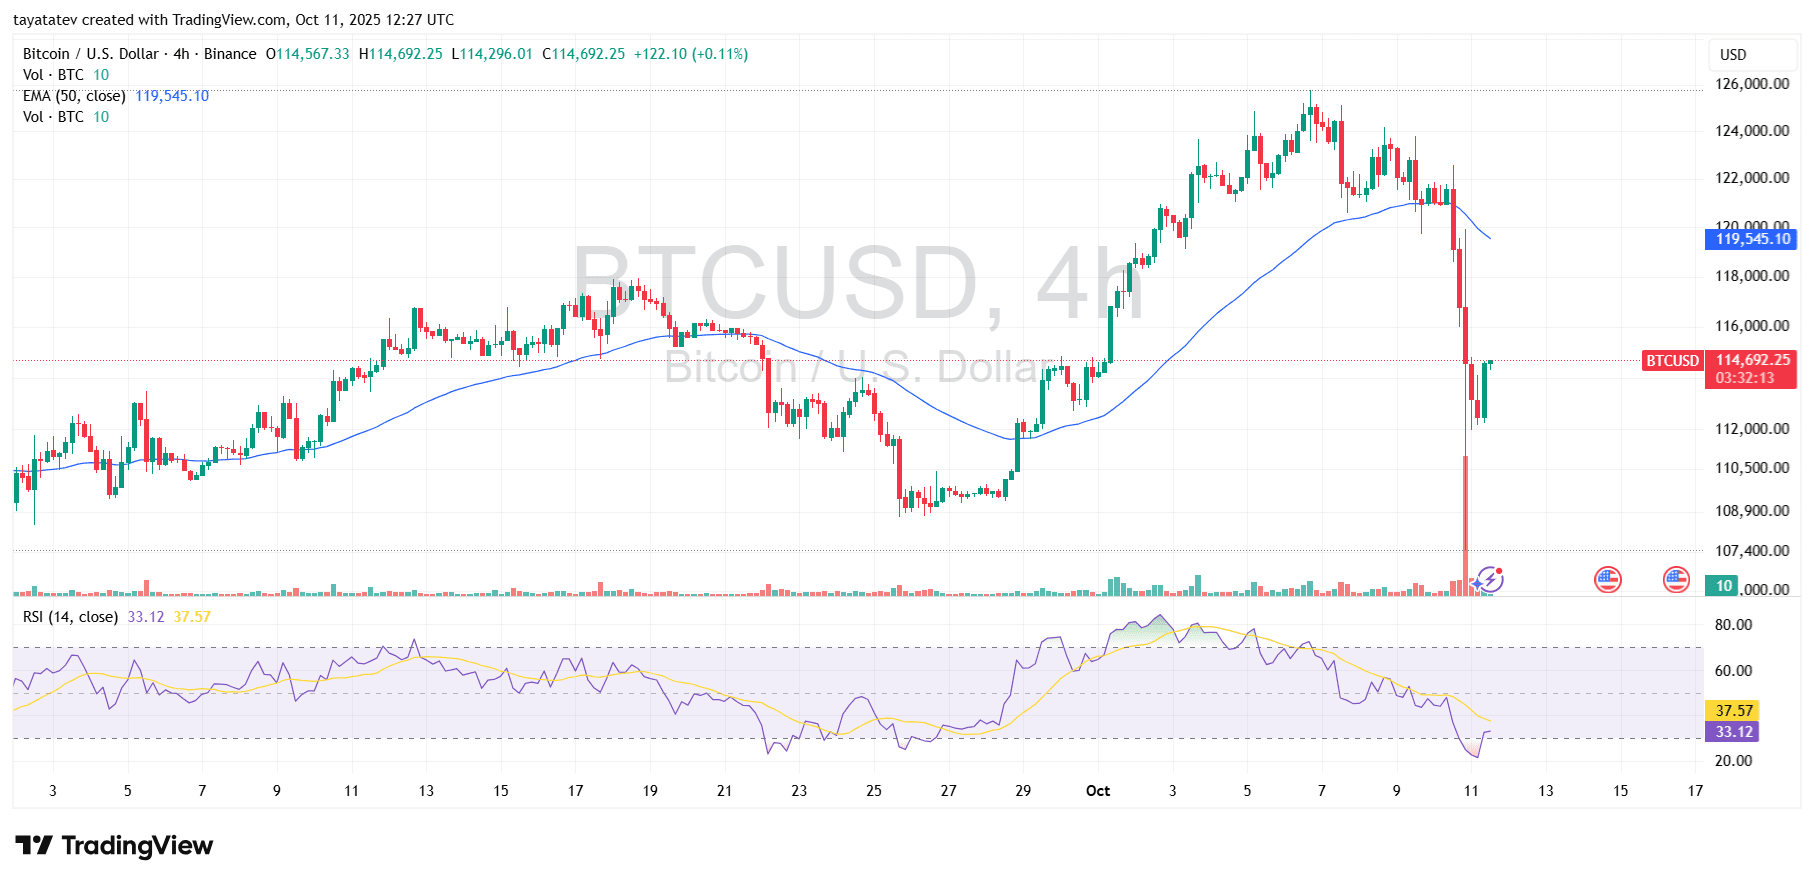
First, expect a reactive push toward 116k–118k as shorts cover and dip buyers probe. If buyers reclaim 118k and then close above the 50-EMA near 119.5k, the rebound can extend into 120k–122k where prior supply sits. With acceptance above 122k, the chart favors a full range retest at 124k–125k.
However, if price stalls under the 50-EMA and prints a lower high, the market likely compresses between 111k and 116k while RSI grinds higher. Lose 111k on 4H or daily closes, and the path reopens to 109k first and then the wick base at 107k. A decisive break below the wick low would shift risk toward 104k–105k.
In short, the next decisive signal is a 4H close above 119.5k (reclaim of the 50-EMA) versus a failure beneath 116k followed by a breakdown through 111k. Until one of those triggers, treat the move as a post-flush repair with a bullish bias only if 111k holds and 119.5k gives way.
Balance of Power: no side in control after the flush
The Balance of Power (BoP) oscillates wildly between +0.8 and −0.8 across September–October, then sits near −0.06 now. BoP measures where the close sits within each bar’s range, so clusters above zero imply steady buying pressure, while clusters below zero imply steady selling.
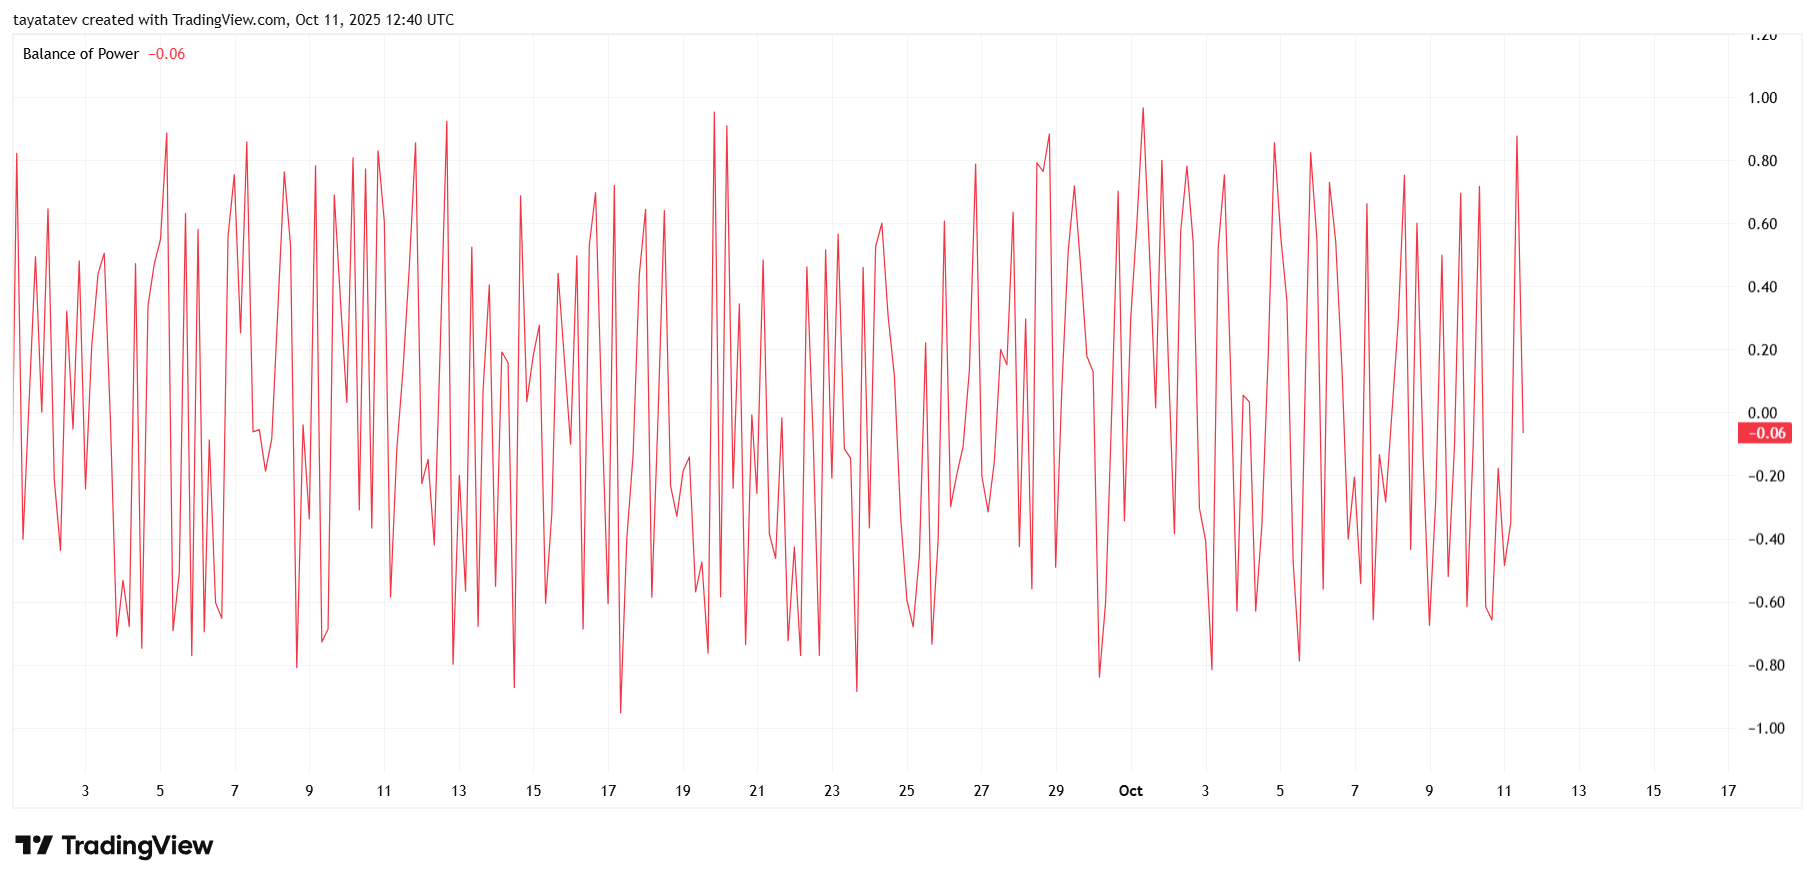
First, the regime is choppy, not trending. Rapid flips mean aggressive mean-reversion and no persistent accumulation or distribution. After the liquidation wick, prints dipped deeply negative, then snapped back toward neutral. Therefore, neither buyers nor sellers hold sustained control yet.
Next, what would change that picture? For a constructive recovery, look for several consecutive 4H bars with BoP > +0.20 and rising highs while price reclaims 118k–120k. That combo signals real absorption, not just short covering. For renewed downside, watch for a cluster below −0.20 alongside lower highs in price and a loss of 111k; that confirms sellers pressing closes near bar lows again.
Finally, use BoP as a confirmation tool. Pair it with trend (50-EMA near 119.5k) and volume. If price pushes through 119.5k and BoP stays positive, continuation toward 122k–125k is likely. If price stalls below the EMA and BoP slips negative in a cluster, risk shifts back to 109k–107k.
BTC 4H Ichimoku: cloud resistance at 115.7k–116.6k; reclaim opens 119.5k–122k
Bitcoin trades below the 4H Ichimoku Cloud after the liquidation wick. Span A (≈115,666) sits under Span B (≈116,623), so the cloud is bearish and overhead. Therefore, the 115.7k–116.6k band is first resistance. Price also sits under the falling 50-EMA near 119.5k, which adds a second cap.
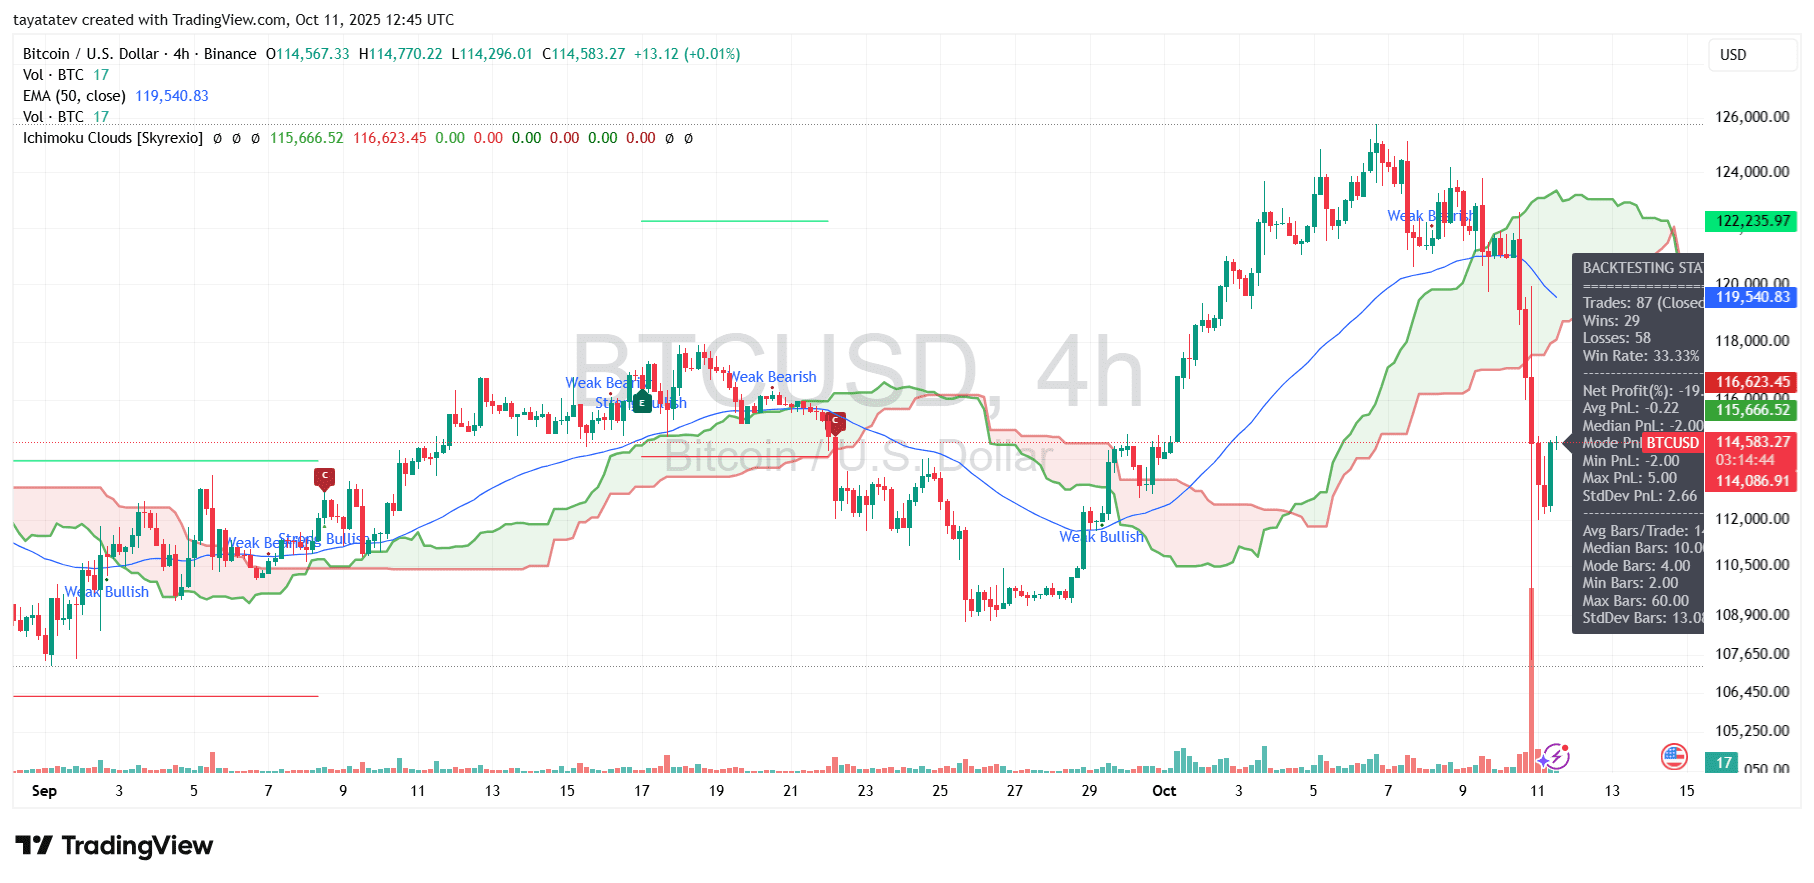
First, expect a reflex test into the cloud base. If buyers close a 4H candle above ~116.6k, momentum should carry into 118k and then the 50-EMA near 119.5k. Next, sustained acceptance above the EMA would target 120–122k; with follow-through, prior supply at 124–125k comes back into view.
However, if price fails at the cloud edge and rolls over, short-term structure weakens again. Then watch 112k–111k. Lose that area on 4H or daily closes, and the market risks revisiting 109k first and the wick zone at 107k next.
In sum, the cloud edge is the pivot. A reclaim and hold above 116.6k signals repair toward 119.5k–122k; rejection keeps pressure on 111k and leaves downside retests on the table.
Money Flow Index (14) sits near 63 after a swift rebound from sub-30. That shift shows net inflows outpacing outflows following the flush. Historically on this chart, pushes above 75–80 often precede cooling phases; dips below 25–20 align with washouts and bounces.
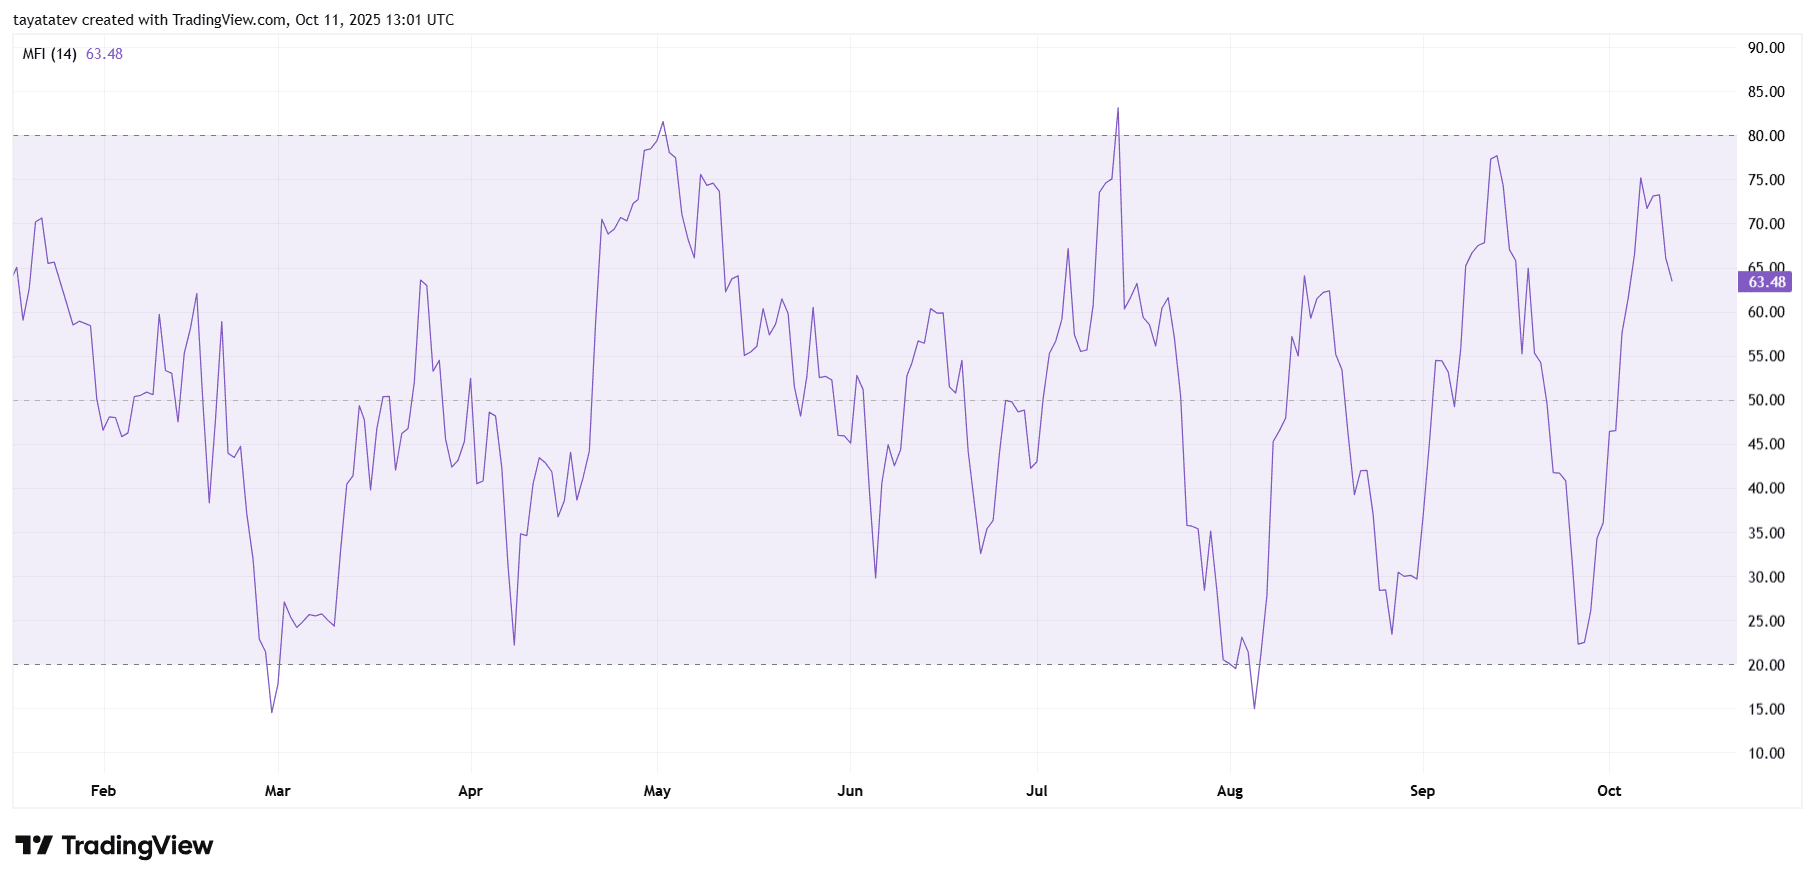
First, momentum favors a continuation of the relief move while MFI trends higher from 60–65. As buying pressure persists, MFI can probe 70–75 without being extreme. Therefore, price can extend into overhead resistance zones before conditions stretch.
Next, monitor the behavior as MFI approaches 75–80. If MFI stalls and diverges—lower MFI highs while price retests recent highs—that signals fading demand and raises pullback risk. Conversely, if MFI holds above 50 during dips and resets toward 55–60, buyers retain control and the advance can resume.
Finally, use clear triggers. A daily MFI close back below 45 alongside lower price highs would warn of a deeper retrace. A sustained hold above 55 with rising price closes supports a push into resistance; only a spike above ~80 with stalling price would flag exhaustion.