 v0.66 goes live today")
Hedera will upgrade mainnet to v0.66.0 today from 17:00 to 17:40 UTC. The status page states that services may face brief disruption during the 40-minute window.
The notice was posted on Oct 8 and superseded an earlier Oct 8 slot. Therefore, today’s timing is the live schedule for production.
Teams should plan transactions and deployments around the window and monitor the status feed for completion updates.
Hedera’s September Developer Highlights remain the newest roundup as of today. The post details updates to AI Studio that streamline building and deploying agent workflows on the network.
The article also points builders to events, meetups, and learning paths published this month, consolidating resources in one place.
Developer social channels amplified the brief, linking to the full summary and keeping the guidance current for October activity.
Governance and ecosystem on stage in Dallas
Co-founder Mance Harmon appears today at the North American Blockchain Summit in Dallas. The Hedera events page lists his panel, “The New Financial Rails: Banking and Stablecoins,” running Oct 9–10.
The public agenda places the banking-and-stablecoins session on the Riot Stage with named industry participants, giving Hedera visibility in policy and infrastructure discussions.
Consequently, today’s presence aligns with Hedera’s ongoing outreach to regulated finance and enterprise audiences.
What builders should do during today’s window
During the 17:00–17:40 UTC upgrade, some network services may be intermittently unavailable. Teams should avoid time-sensitive operations until the status page marks completion.
After the window closes, confirm service restoration on the same page before resuming queued workloads. This reduces the risk of failed submissions.
If your processes require continuous availability, stage transactions ahead of time and verify results after the upgrade clears. The status page remains the source of truth.
Monthly “Highlights” recap adds policy and program context
Hedera’s October “Highlights” post, published Oct 6, reports that Hedera joined the Wyoming State Stablecoin initiative as its only new network. It also notes new collaborations and community outcomes.
The roundup references hackathon winners and foundation programs that support builders across AI, tokenization, and tooling tracks.
Together with today’s upgrade and event calendar, these items frame a non-price view of network progress entering mid-October.
Chart signals point to compression, RSI cap, and building MACD momentum
Price compresses inside a long descending channel. The chart shows lower highs meeting a flat-to-gently rising base. Trendlines converge into a decision zone ahead. Therefore, liquidity likely concentrates near the apex. Sellers defend the overhead line. Buyers hold the mid-range support. Consequently, volatility tightens.
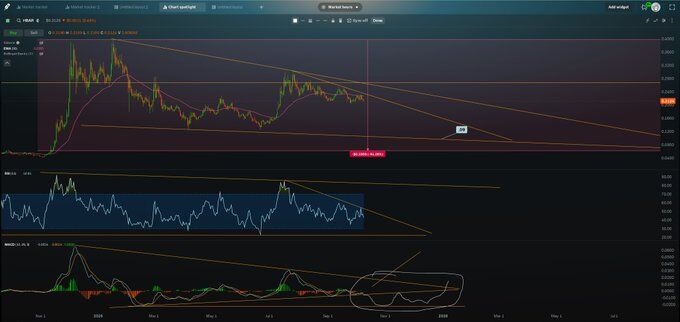
RSI remains capped by a descending trendline. Each push stalls below that line. However, the oscillator still prints higher lows inside the recent range. That structure often precedes a trendline test. A firm RSI break above the cap would confirm improving momentum. Until then, the RSI ceiling still favors range trade behavior.
MACD builds constructive pressure. The lines curl upward and hover near the zero line. Histogram bars expand gradually. That profile signals a possible bullish crossover with follow-through. Yet, confirmation still requires a clean move above the price downtrend line. Otherwise, momentum can fade back toward neutral.
Key levels cluster around the descending resistance and the recent swing-low shelf. A daily close above the upper trendline would validate a breakout attempt. Then, price can target prior reaction highs inside the channel. Conversely, a rejection at resistance would keep the downtrend intact and expose the lower boundary. Manage bias around those inflection points and wait for confirmation on volume and close.
HBAR forms a 2-day bullish flag; confirmation requires a close above the upper line
HBAR/USD trades inside a narrow, downward-sloping channel after July’s strong advance. The parallel lines define a classic bullish flag, which typically follows a fast move and then a pause. Consequently, the prior rally acts as the flagpole, while the channel marks consolidation. Volume remains light during the range, which often accompanies digestion phases.
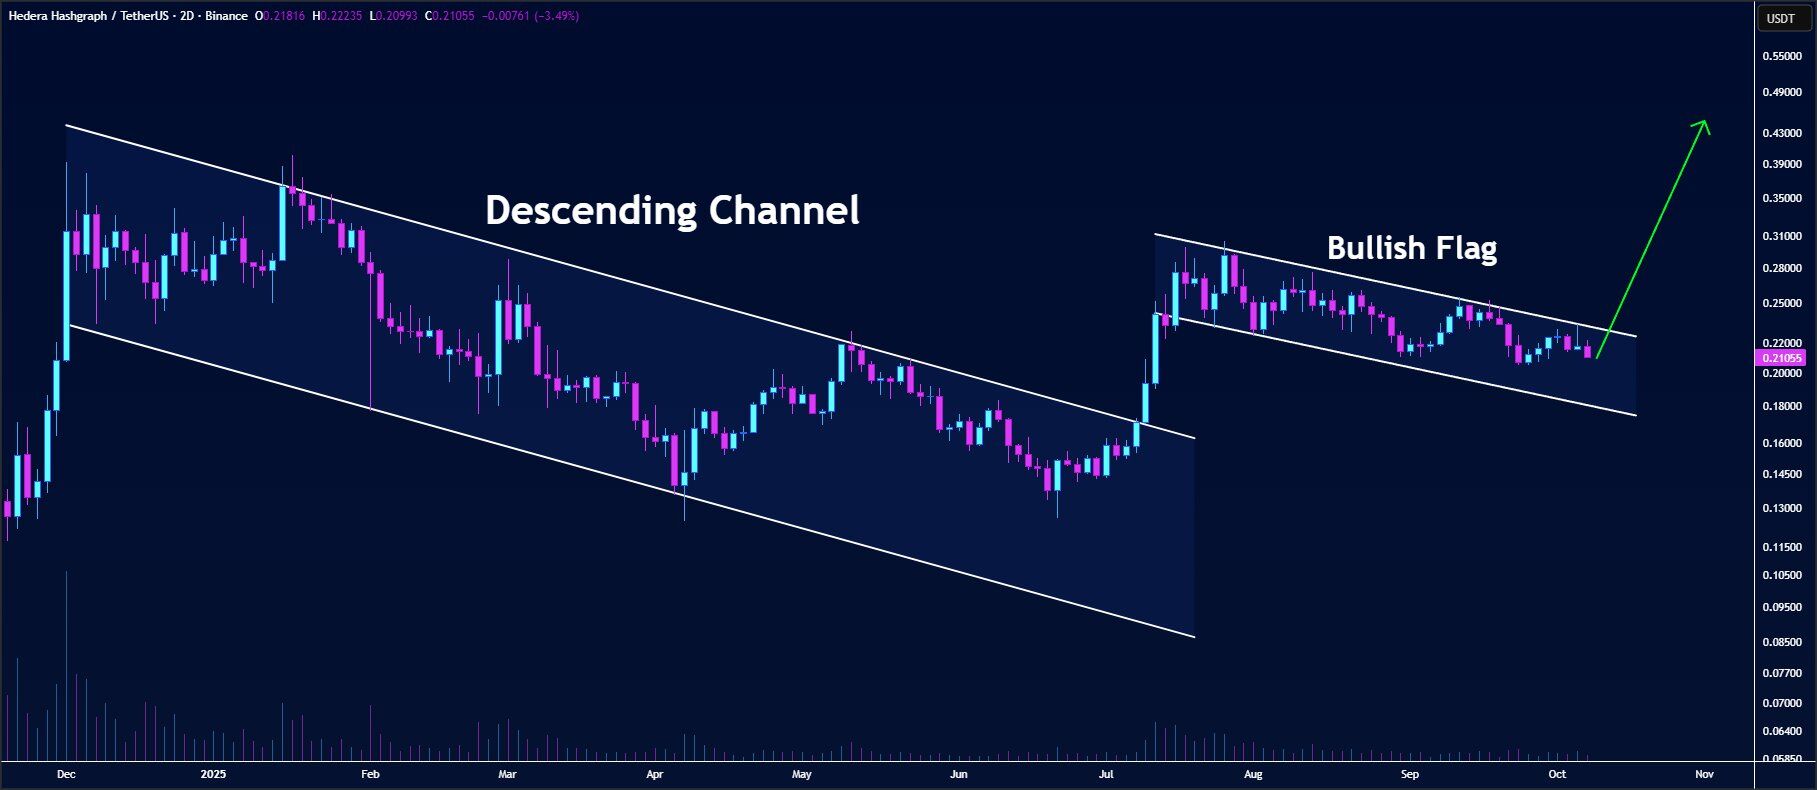
To confirm the setup, price must close above the channel’s upper boundary on the 2-day chart. Then, momentum can rotate toward the late-July reaction zone and earlier swing highs. Furthermore, rising volume on the breakout would strengthen the signal and reduce the chance of a failed move. Until that close prints, the pattern stays unconfirmed.
Risk sits at the lower boundary of the flag. If HBAR closes cleanly below that level, the flag structure fails and the chart exposes the mid-range support first, then the base of the consolidation. Therefore, watch how candles behave at both edges. Additionally, whipsaws can occur near trendlines, so confirmation on closing basis matters more than intraday spikes.
In context, the July surge also ended a broader descending channel, and this flag has since carried the retracement. Thus, the market now decides whether the impulse resumes or fades. As a result, focus on structure, closing levels, and volume to separate continuation from another range.