
XDC Network wrapped its Sibos 2025 presence in Frankfurt today, directing attendees to stand DISS27 in the Discover Zone for meetings on tokenized trade finance and stablecoin workflows. The official exhibitor page lists XDC with booth DISS27 and positions the team among enterprise vendors focused on payments and RWAs.
Moreover, XDC’s channels promoted the same coordinates throughout the week, inviting visitors to discuss trade finance, payments, and tokenization use cases on-site. Posts specified the Sept. 29–Oct. 2 window, aligning with the event’s closing day.

In addition, XDC’s events hub confirms the Frankfurt dates and booth details, reinforcing where the team met banks, corporates, and partners during the show. The listing anchors Sibos within a broader roadshow that also includes other October stops.
USDC and CCTP V2 now live on XDC
Circle announced that native USDC and CCTP V2 are live on the XDC mainnet, enabling regulated dollar liquidity and cross-chain transfers for developers and enterprises. The launch targets trade, payments, and RWA settlement use cases that XDC showcased at Sibos.
XDC Foundation echoed the production rollout, noting access to the stablecoin and Circle’s transfer protocol on mainnet. The foundation framed the update as an infrastructure step for applications needing programmatic settlements.
Furthermore, developer and media posts cataloged the feature set and pointed builders to quickstart resources, underscoring how native issuance differs from bridged assets in compliance and liquidity workflows.
RWA accelerator adds 11 startups with Plug and Play
Plug and Play introduced 11 startups in the second XDC RWA Accelerator, a program it runs with the XDC Foundation to drive tokenization pilots. The cohort focuses on enterprise integrations for assets and settlement across the XDC stack.
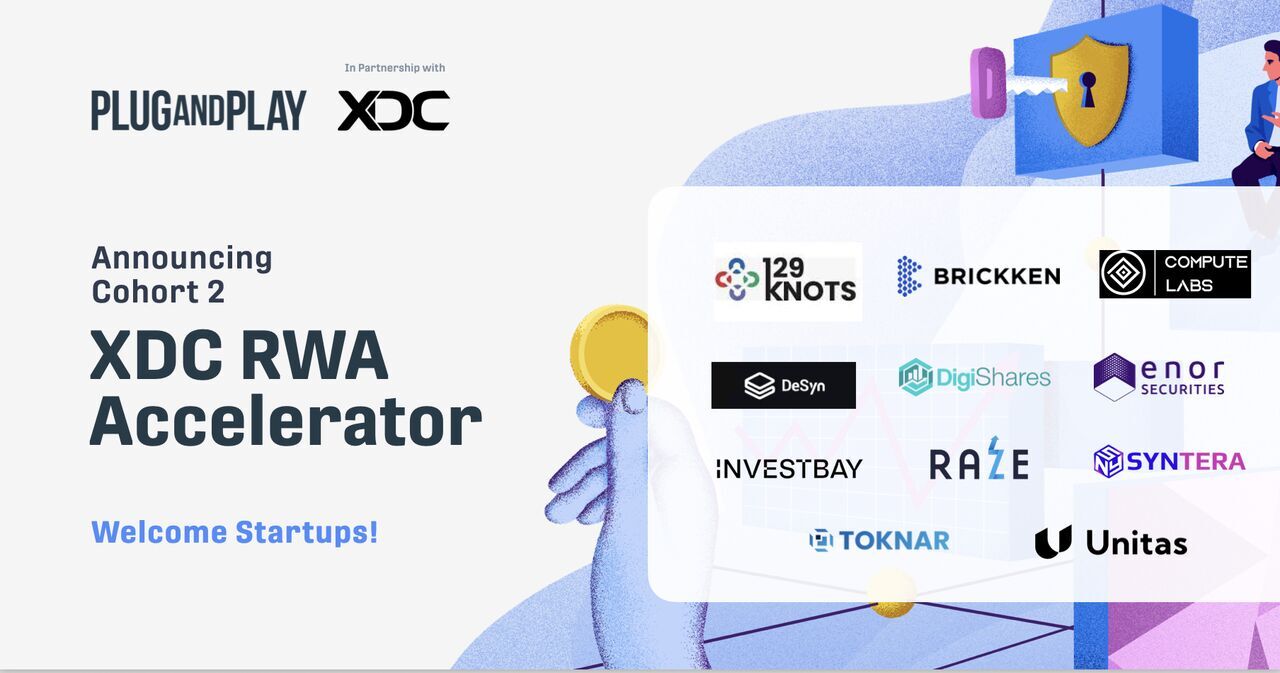
A program brief highlights diversity of approaches—liquidity tooling, data rails, and legal process bridges—while requiring each startup to integrate with XDC. The accelerator culminates at Plug and Play’s Silicon Valley Summit.
Additionally, community coverage summarized the selections and timing, providing a public roster and timeline as the cohort advances toward demos.
Trade-finance engagement continues alongside industry forums
XDC’s positioning remains anchored in trade-finance digitization themes widely discussed by industry bodies. ITFA’s recent materials keep the $2.5 trillion trade-finance gap and distribution modernization in focus, matching the enterprise conversations XDC pursues.
Event posts also show XDC participating in regulatory and standards discussions with partners and supporters from the trade community, extending Sibos-week outreach into broader forums.
Taken together, Sibos presence, native USDC support, and an expanded accelerator cohort signal near-term priorities centered on regulated settlement, tokenized receivables, and bank-friendly integrations—not price action.
XDC daily chart prints falling-wedge breakout attempt on October 2, 2025
XDC/USDT daily chart, created on October 2, 2025, shows price around $0.0762 and a declining channel bounded by two converging trendlines. Candles pressed into the wedge apex through late September and now lean above the upper boundary, while the 50-day exponential moving average sits near $0.0777. Volume picked up into the move, which often accompanies attempts to exit compression.
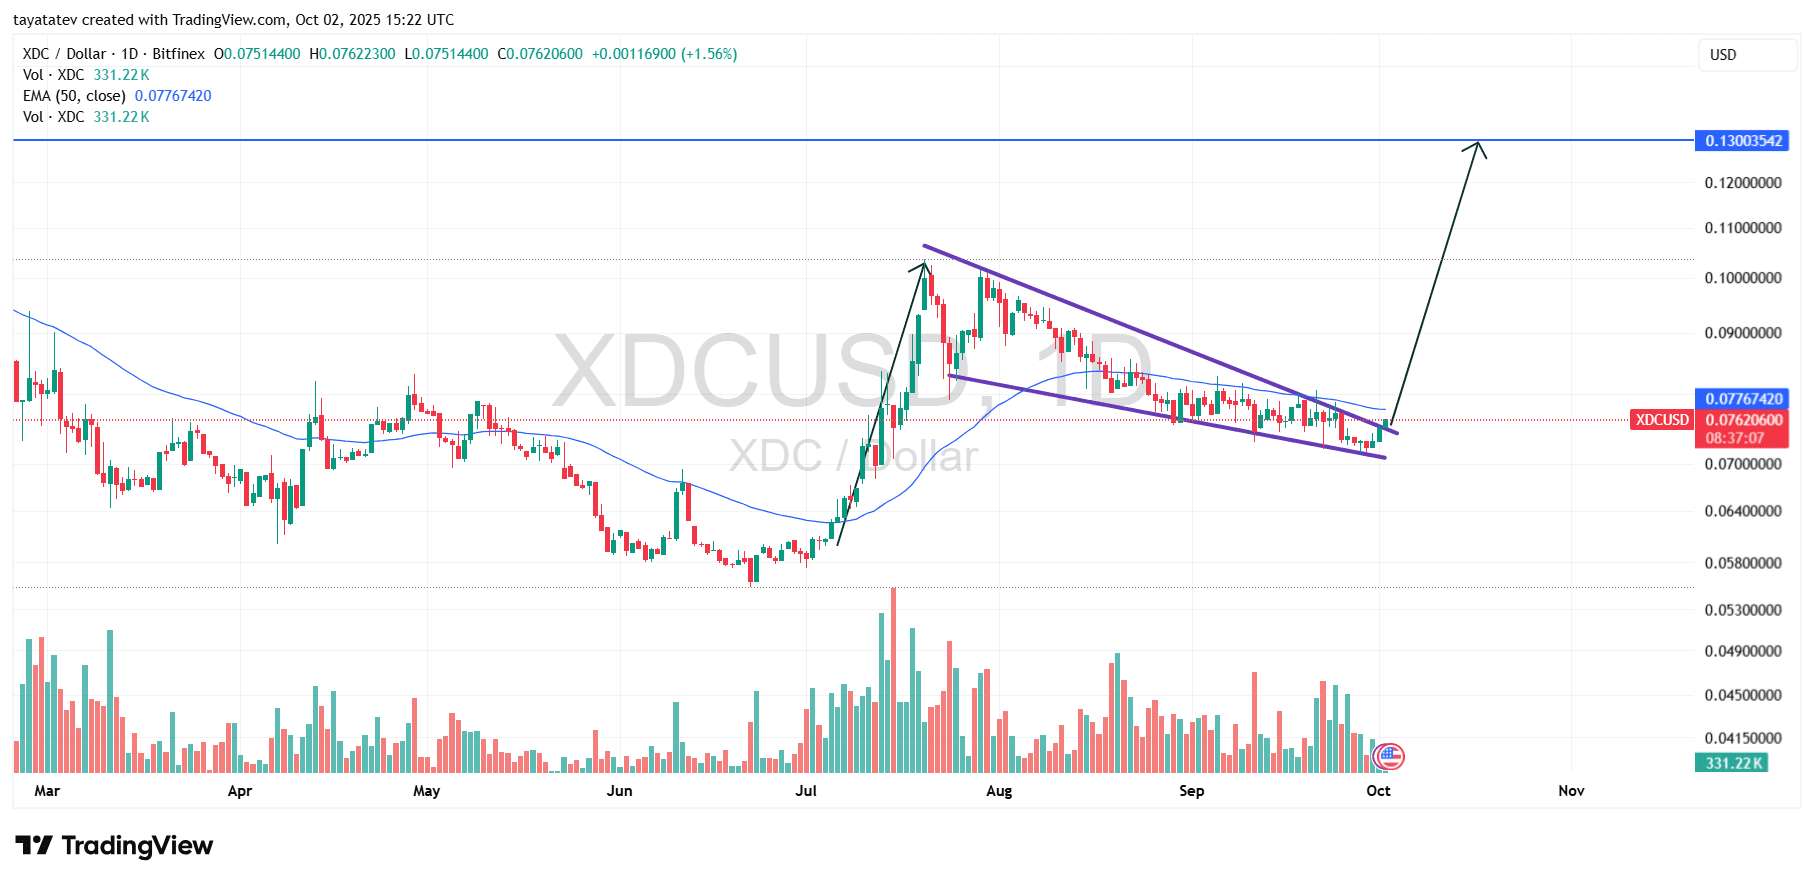
A falling wedge is a bullish continuation or reversal pattern formed by lower highs and lower lows that converge, and it typically resolves upward once price closes above the upper trendline with follow-through. Here, the chart illustrates that structure clearly, and price now challenges the top line as momentum turns. Traders usually look for a daily close and sustained volume to validate the break; the picture currently shows an initial attempt rather than a completed confirmation.
If the move confirms, a 70% advance from the current $0.0762 level would target approximately $0.1296, which aligns with the marked objective near $0.1300 on the chart. Therefore, the setup points to that neighborhood as the measured upside if buyers secure a clean breakout and hold above the wedge.
XDC daily RSI turns neutral-to-positive on October 2, 2025
XDC’s 14-day Relative Strength Index prints about 49.96 as of October 2, 2025 at 15:27 Coordinated Universal Time, while its RSI moving average sits near 42.95. The oscillator has risen steadily through late September and now tests the neutral 50 line. Because momentum flipped above its own average first, the gauge signals improving demand after a month of indecision.
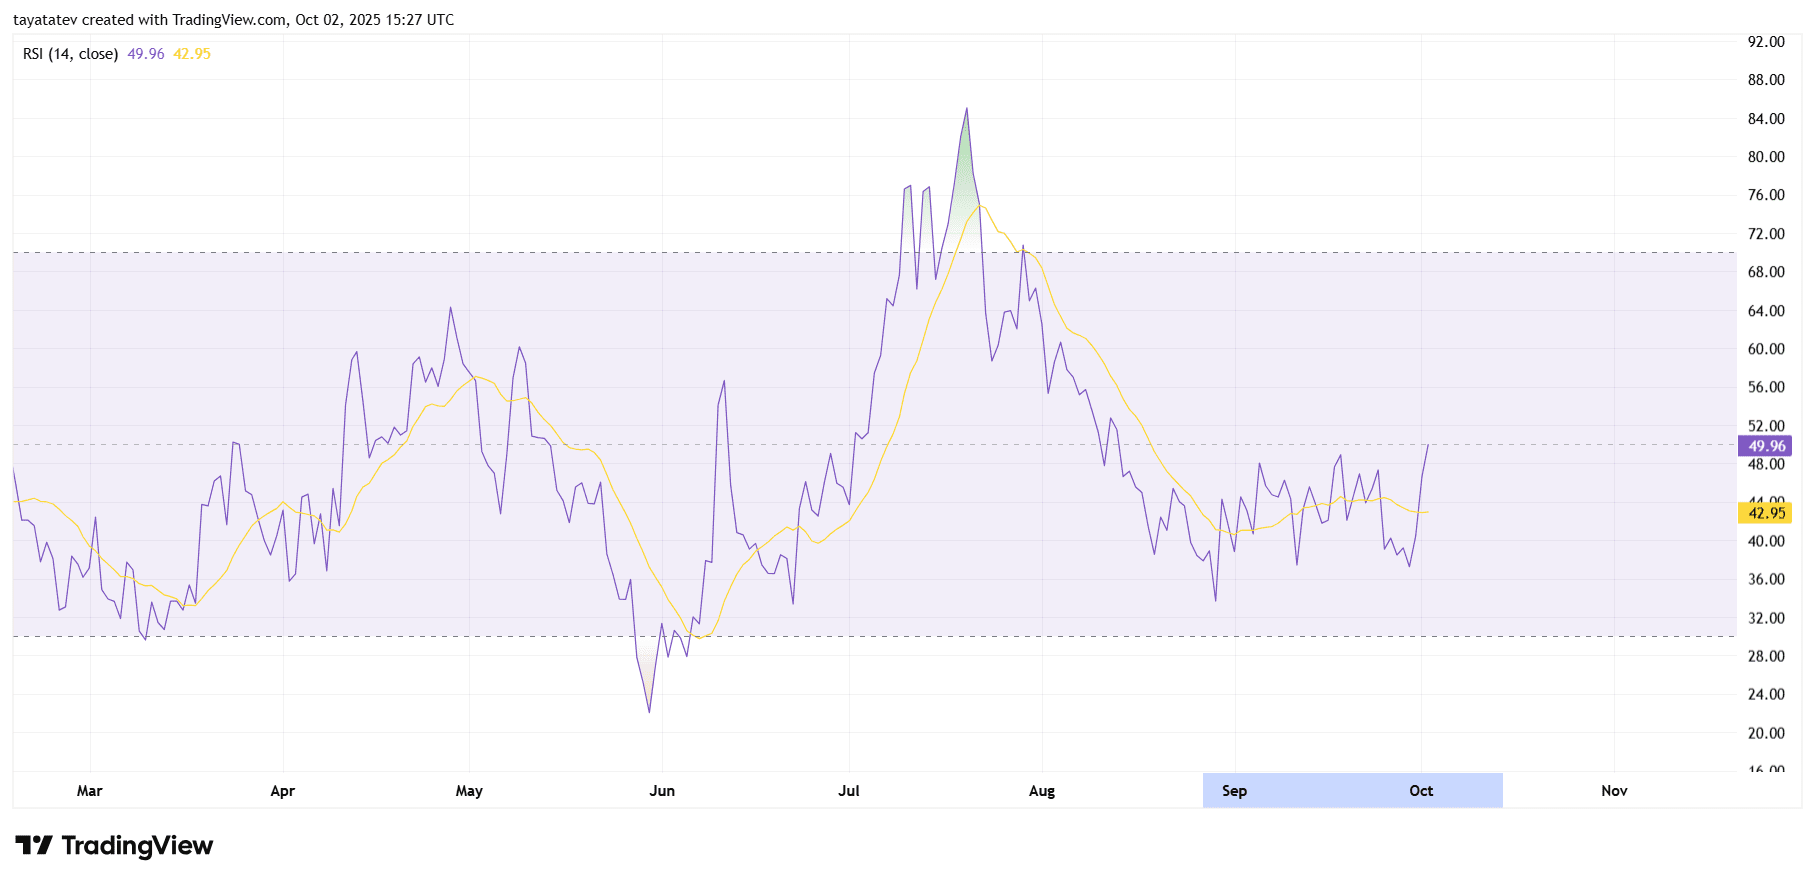
Earlier, RSI trended below 50 for most of September, which confirmed a cooling phase after the July–August momentum spike. Then, the curve based out near the low-40s and crossed up through its average, a classic early recovery tell. Now, with the slope positive and the average still lagging, buyers control short-term swings more often than sellers.
However, confirmation still depends on follow-through. If RSI can hold above 50 and push into the 55–60 band, momentum typically supports trend extension on daily time frames. Conversely, a quick slip back under 45 would indicate fading impulse and a return to rangebound behavior.
XDC daily MACD tilts bullish on October 2, 2025
XDC’s Moving Average Convergence Divergence on the daily timeframe shows the MACD line curling above the signal line in late September and holding that posture into October 2, 2025 at 15:30 Coordinated Universal Time. The histogram has shifted to small positive prints near the zero line, which indicates emerging upside momentum after a multi-week slump.
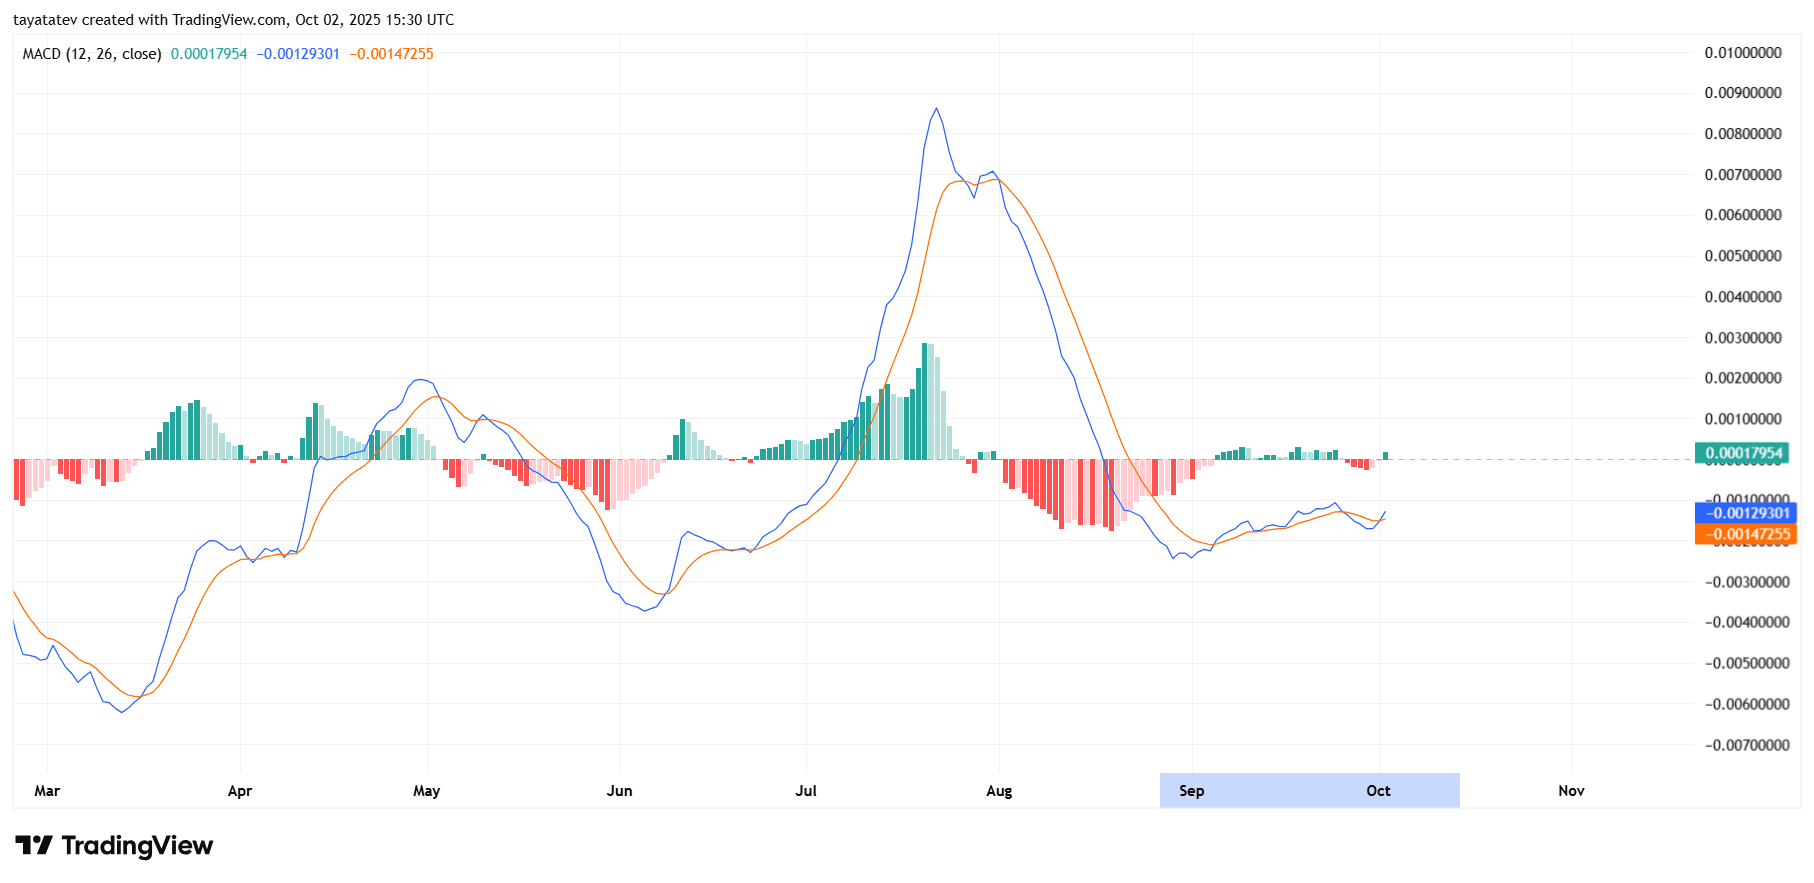
Moreover, both lines still sit just below the zero baseline, so the signal remains early. A decisive move through zero would typically confirm trend transition from corrective to constructive on daily charts. Until then, momentum reads as improving rather than fully established.
Finally, watch for the MACD–signal spread to widen while the histogram grows consistently. That sequence would validate the crossover and support follow-through from any price breakout attempts visible on the main chart.