
Key Takeaways
-
Analysts are split between SHIB price’s short-term bounces and long-term breakout scenarios
-
Descending triangle signals pressure building toward a decisive move
-
Rally projections leaned more on speculation than fundamentals
The Shiba Inu coin, SHIB, has been in a downtrend since reaching its monthly high on Sept. 13. The memecoin was down more than 21% from its recent high of $0.000015 on Sept. 25, adding pressure to SHIB’s fragile structure.
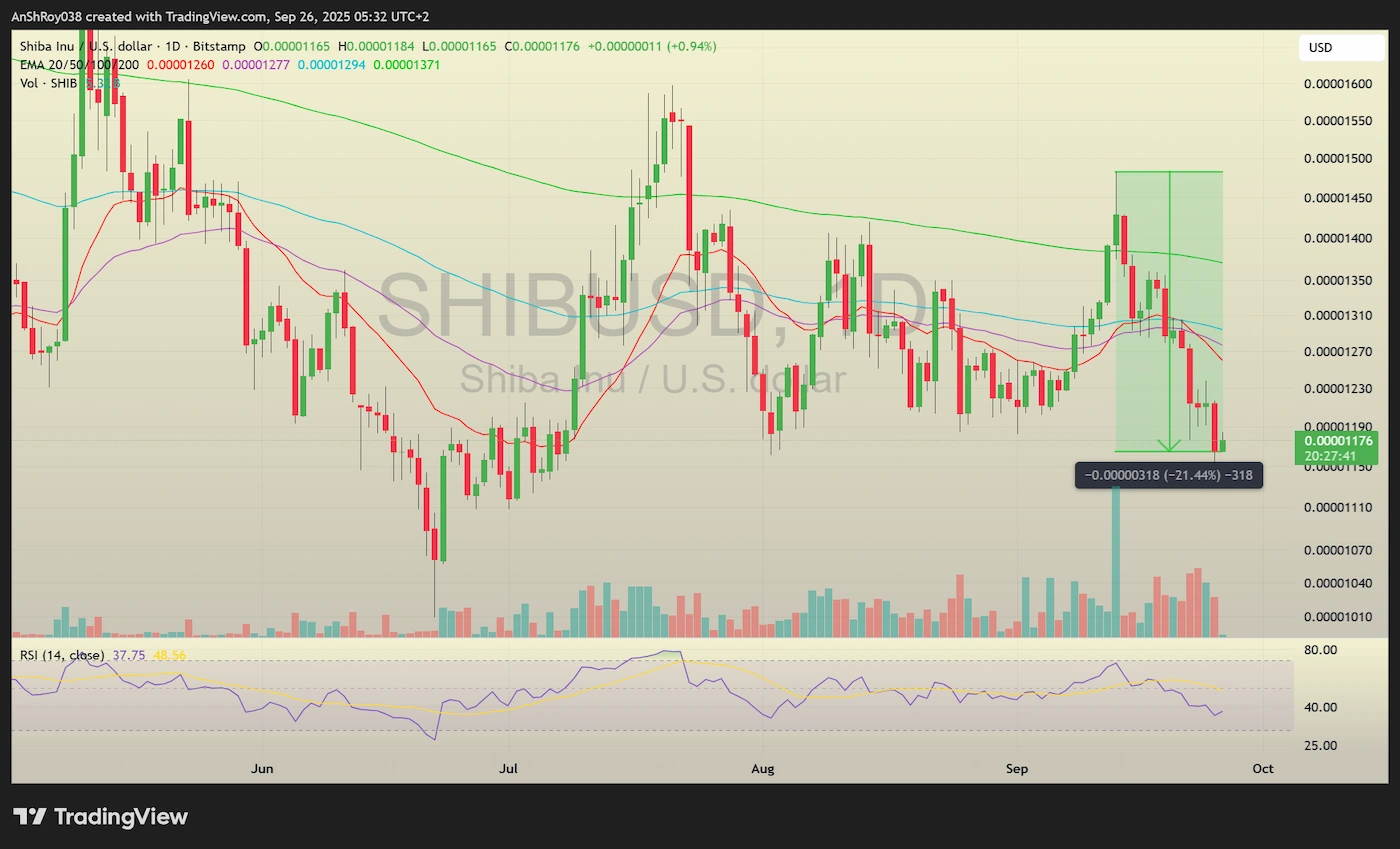
The token hovered near the $0.00001180 zone, struggling to attract buyers. However, the memecoin did start Sept. 26 with a spot of positivity, though it remains to be seen if bulls convert the spike into a rally. Despite the weakness, traders remained very optimistic about the token’s future. Market watchers argued that repeated defenses of lower supports hinted at coiling pressure. The discussion turned to whether SHIB’s dull action could trigger a breakout similar to past rallies.

Analysts Share Wild Predictions For SHIB
Analysts on social media highlighted SHIB’s structure after the latest consolidation, relying on speculation that the token could repeat past rallies. The posts framed the current range as both a risk and an opportunity, depending on how the price responded to resistance barriers.
MMBTtrader highlighted SHIB’s position on what he described as a major weekly support.
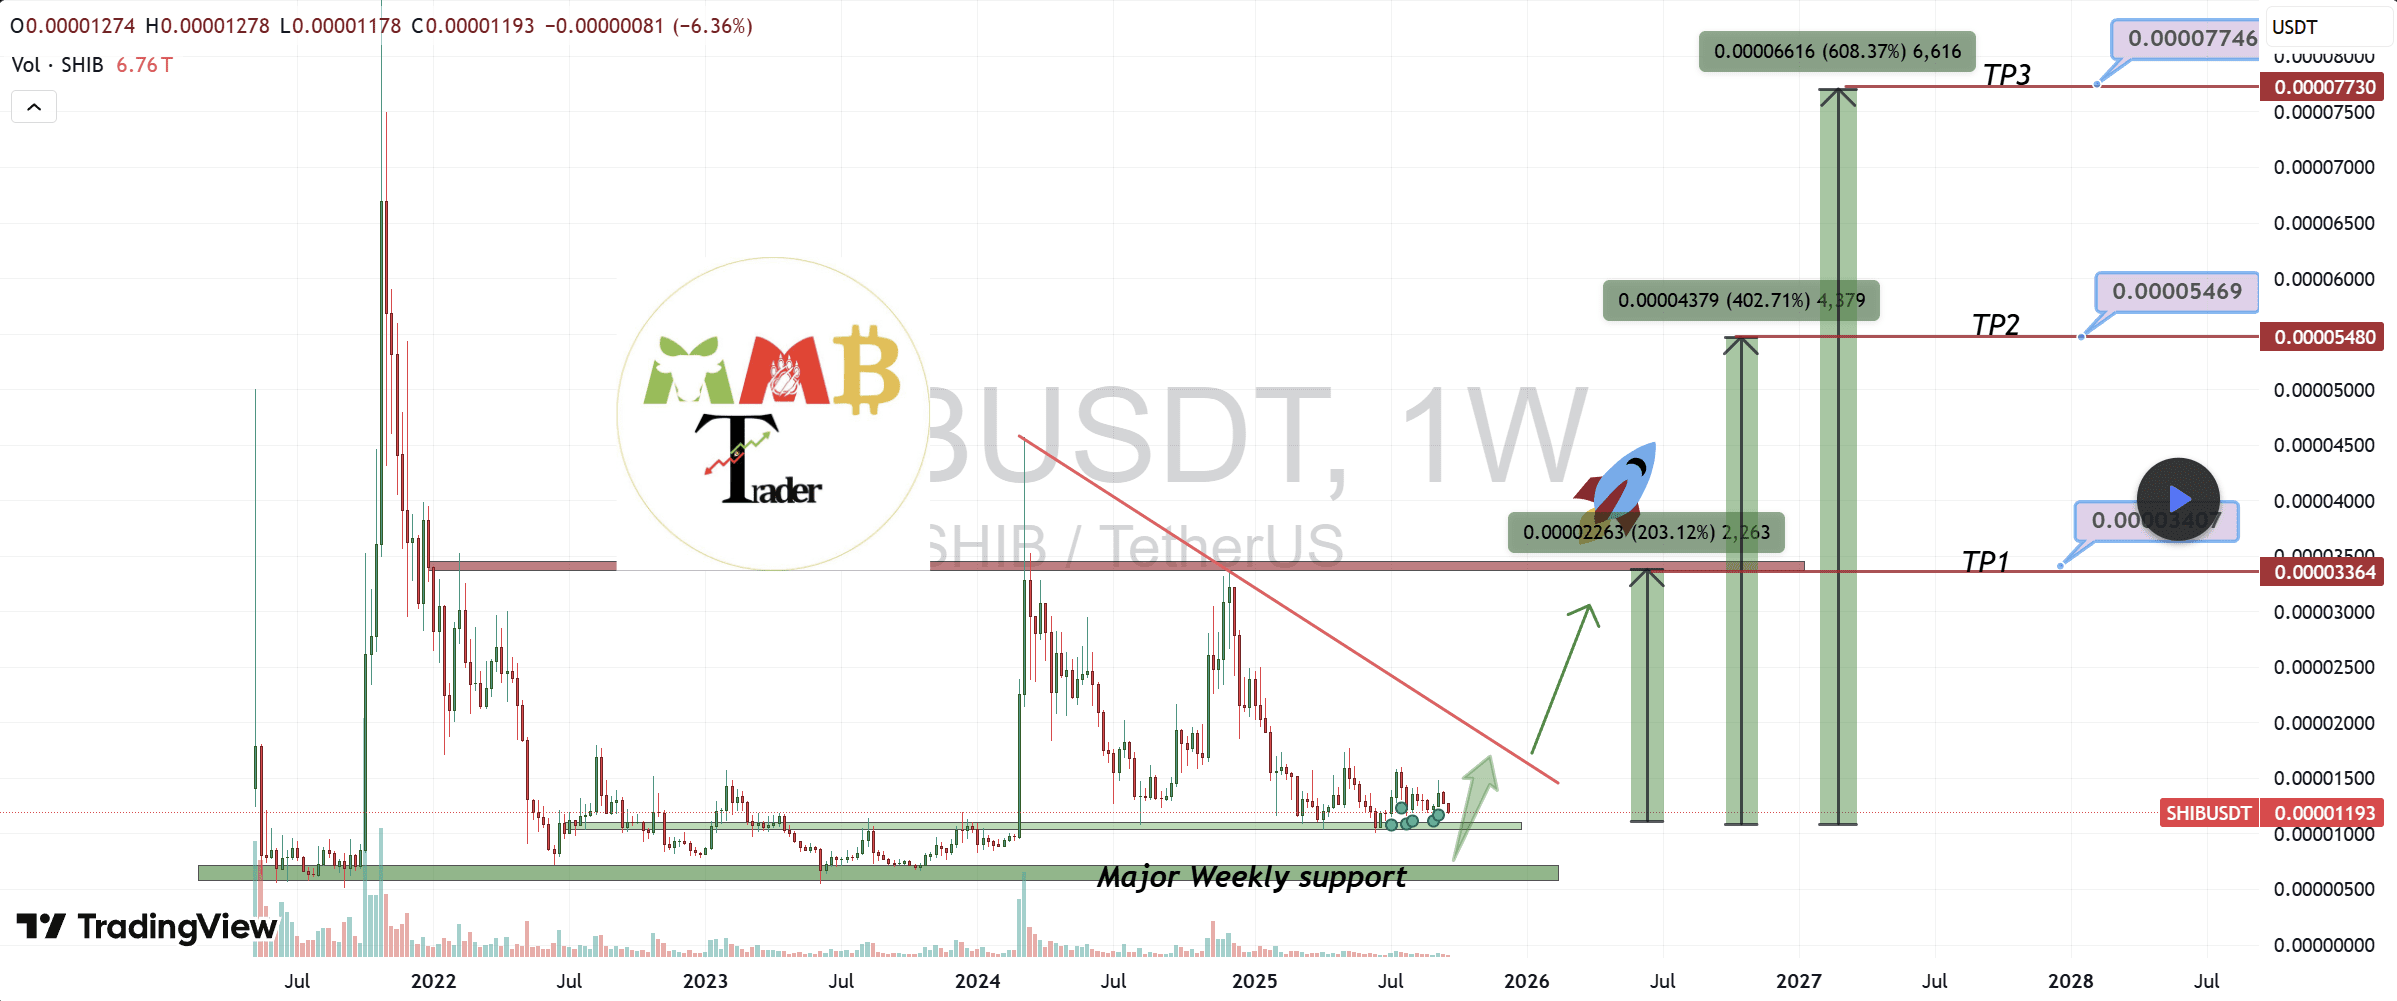
Analyst MMBTtrader’s chart outlined three distinct upside targets. These were each linked to potential rallies of 200%, 400%, and 600%. The projections mirrored price zones last seen during 2021’s surge, comparing periods when “dead markets” suddenly flipped into panic-driven pumps. MMBTrader’s post emphasized that the first barrier near 0.00003364 remained the key trigger for any wider advance.
However, targets like these, based on historical gains, often result from hopium-fueled optimism than technical cues. This is very much like how Pi Network fans keep hoping for the token to reach $314,159, or even $1, in the current markets.
Some Analysts Looking at Shorter Horizons
Other posts kept attention on shorter horizons. Crypto T marked SHIB’s repeated tests of a lower yellow support line. The analyst noted how the token bounced from that region. T stressed immediate resistance near 0.00001217, which had acted as a ceiling several times during the month.
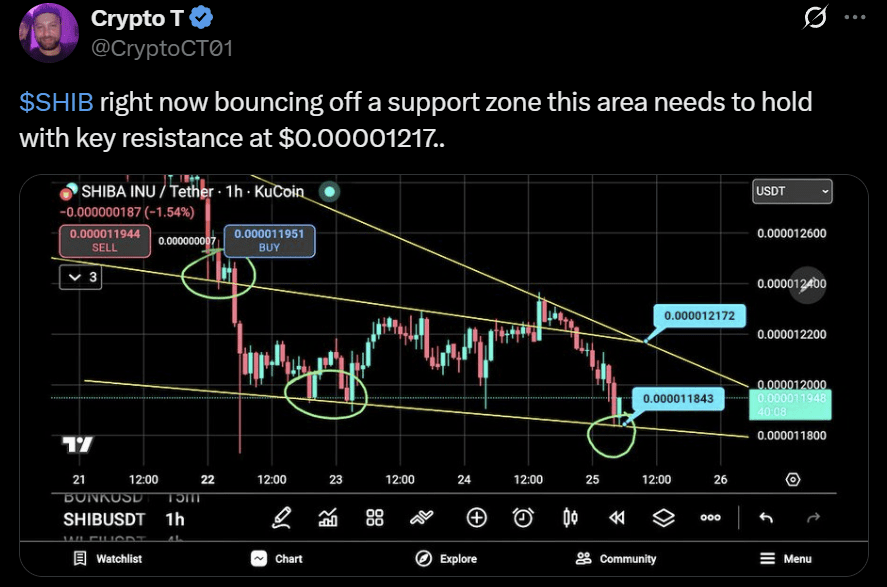
Analyst Crypto T’s chart suggested that reclaiming the zone could unlock short bursts of momentum, but failure risked further consolidation. With Dogecoin getting its own ETF, market interest in the DOGE rival might be diminishing. This is despite the team’s efforts to establish Shiba Inu as an ecosystem-like project.
On higher timeframes, independent analyst BKCRT mapped a broader descending trendline that had dictated price action for weeks. His post highlighted how SHIB “walked the line,” grinding under the diagonal barrier while coiling inside a tightening range.
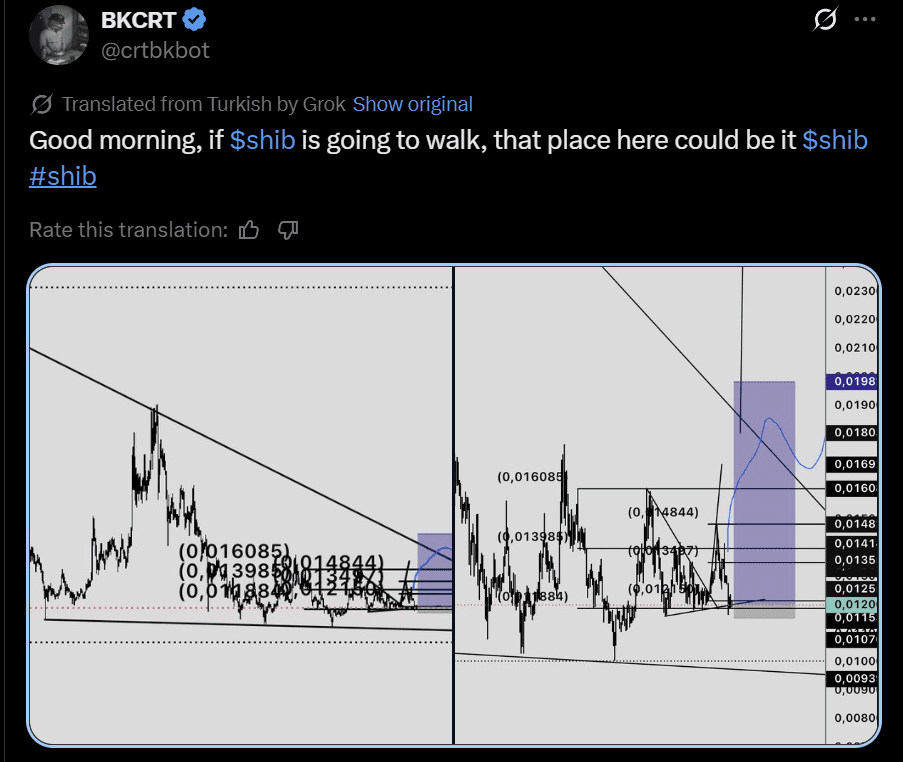
The attached chart projected a potential breakout window, placing a purple target box near 0.0198. That scenario implied a steep extension from current prices. This is provided SHIB could first flip the trendline. The analysis underscored the gap between tactical resistance battles and larger structural triggers.
Descending Triangle Raises Questions on SHIB’s Next Move
Meanwhile, the SHIB USD pair formed a bearish technical setup called the descending triangle pattern. The pattern consisted of a flat base and a series of lower highs pressing against resistance. It reflected a gradual tightening of price action, where sellers consistently forced lower peaks while buyers repeatedly defended a specific support floor. Such formations often highlight weakening momentum and foreshadow sharp directional breaks once pressure resolves.
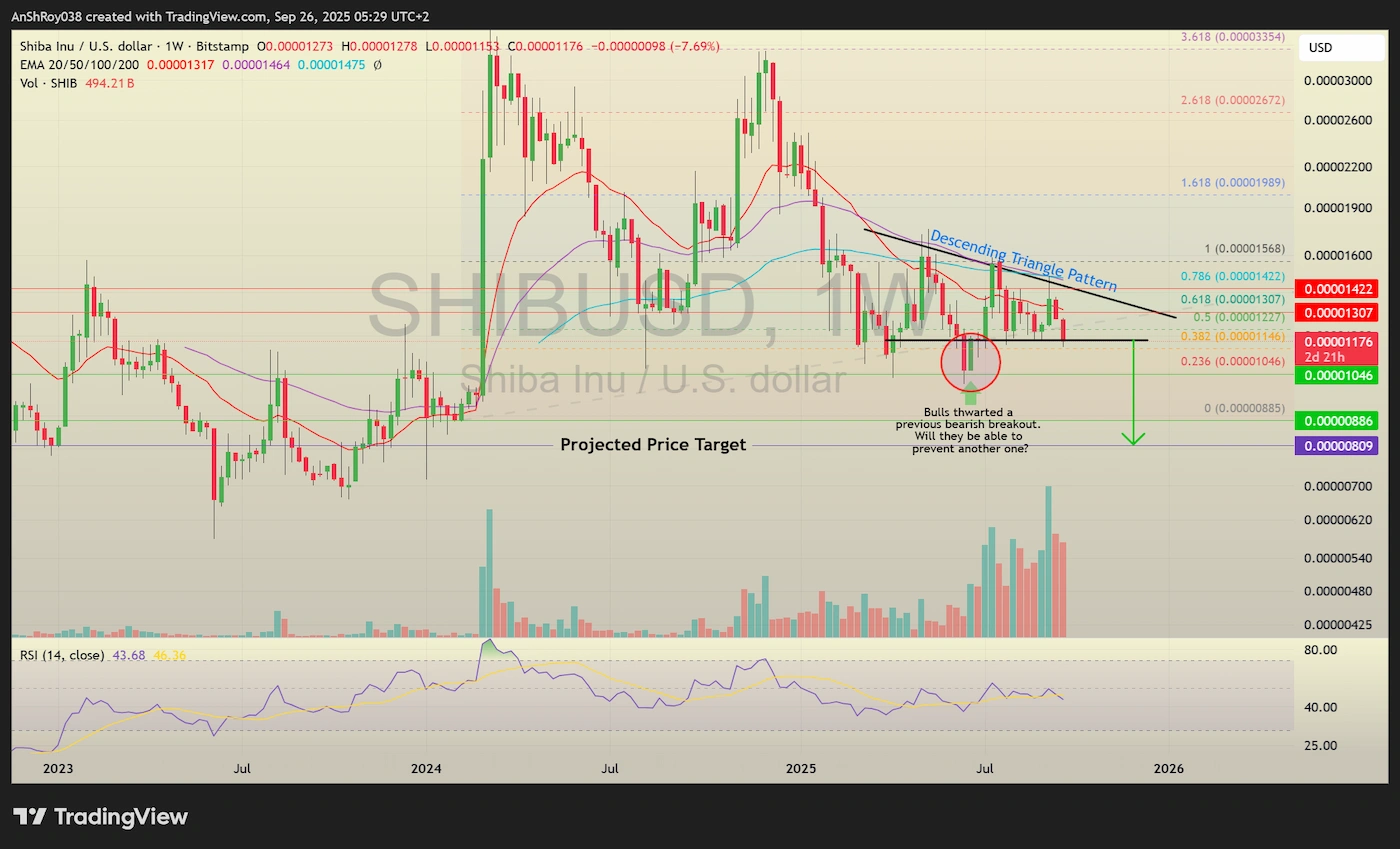
For the Shiba Inu coin, a breakout would see bulls scampering to check the downtrend at the support near $0.00001046. The support is psychologically vital since it keeps SHIB from adding another zero in its price label. Breaching the immediate support could send SHIB price spiralling to $0.00000886, a level last seen in Jan. 2024.

The triangle’s theoretical price target is at $0.000008, a drop of 31% from current levels.
The pattern’s immediate resistance rested near $0.0000131, a ceiling that marked the upper boundary of the descending structure. Flipping this resistance would invalidate the bearish setup and instead create conditions for a structural reversal. Breaking out above the bearish setup would engage the resistance near $0.0000142 for the Shiba Inu coin.
Disclaimer: The analysis above reflects the author’s personal view and is provided for informational purposes only. It should not be considered financial advice. Readers must conduct their own research before making investment decisions. Any losses incurred from acting on this analysis will not be the responsibility of the author or CoinChapter in any way.
What is happening with Chainlink? Check it out next.