
Dogecoin’s ecosystem is evolving as developers explore new tools designed to extend its use beyond its meme origins. One of the notable projects under discussion is DogeOS, a proposed bridge that would connect Dogecoin with Ethereum’s decentralized finance applications.
By enabling access to DeFi platforms,the project seeks to expand Dogecoin’s functionality and create avenues for lending, staking, and cross-chain transactions.

The initiative highlights an effort to transform Dogecoin from a community-driven digital asset into a network with tangible applications. Bridging with Ethereum would position Dogecoin to interact with one of the largest ecosystems in blockchain, reinforcing its utility narrative. Developers emphasize that improving interoperability remains a critical step for Dogecoin’s long-term relevance in the digital asset economy.
Whale Activity Underscores Long-Term Confidence
Large holders of Dogecoin, often called whales, have increased accumulation in recent weeks. Blockchain data indicates that significant volumes of DOGE continue to shift into long-term storage, suggesting confidence in the token’s durability. This behavior mirrors trends seen during earlier phases of Dogecoin’s growth, when accumulation periods preceded surges in adoption and visibility.
Whale activity does not only impact liquidity but also signals investor sentiment. In this case, accumulation appears to align with ongoing efforts to expand Dogecoin’s role in digital finance. Analysts note that sustained interest from major holders provides a stabilizing force for the network as it navigates technological changes and regulatory developments.
Dogecoin’s Payment Use Case Gains Attention
Discussions within financial media and policy circles continue to revisit Dogecoin’s potential as a global payment method. Unlike Bitcoin, which has capped supply, Dogecoin follows an inflationary issuance model. Proponents argue that this design makes it suitable for everyday transactions, as it discourages hoarding and supports continuous circulation.
Dogecoin already enjoys broad community recognition, which strengthens its positioning in the payments debate. Businesses experimenting with cryptocurrency adoption often include Dogecoin in their accepted payment lists, citing ease of use and community-driven branding. Analysts in recent reports stress that if interoperability projects succeed, Dogecoin could emerge as more than a speculative asset, potentially gaining traction as a medium for global digital commerce.
Dogecoin Forms Bearish Pennant on the Four-Hour Chart
The chart captured on August 26, 2025, shows Dogecoin paired with Tether United States Dollar (DOGE/USDT) on Coinbase. The four-hour timeframe reveals a bearish pennant formation. At the time of the snapshot, the price stood at 0.21088 USDT, while the 50-period Exponential Moving Average (EMA) rested higher at 0.22384 USDT. The pattern developed after a sharp downward move, followed by consolidation inside two converging trendlines. Volume has been shrinking during this phase, which is typical of a pennant structure.
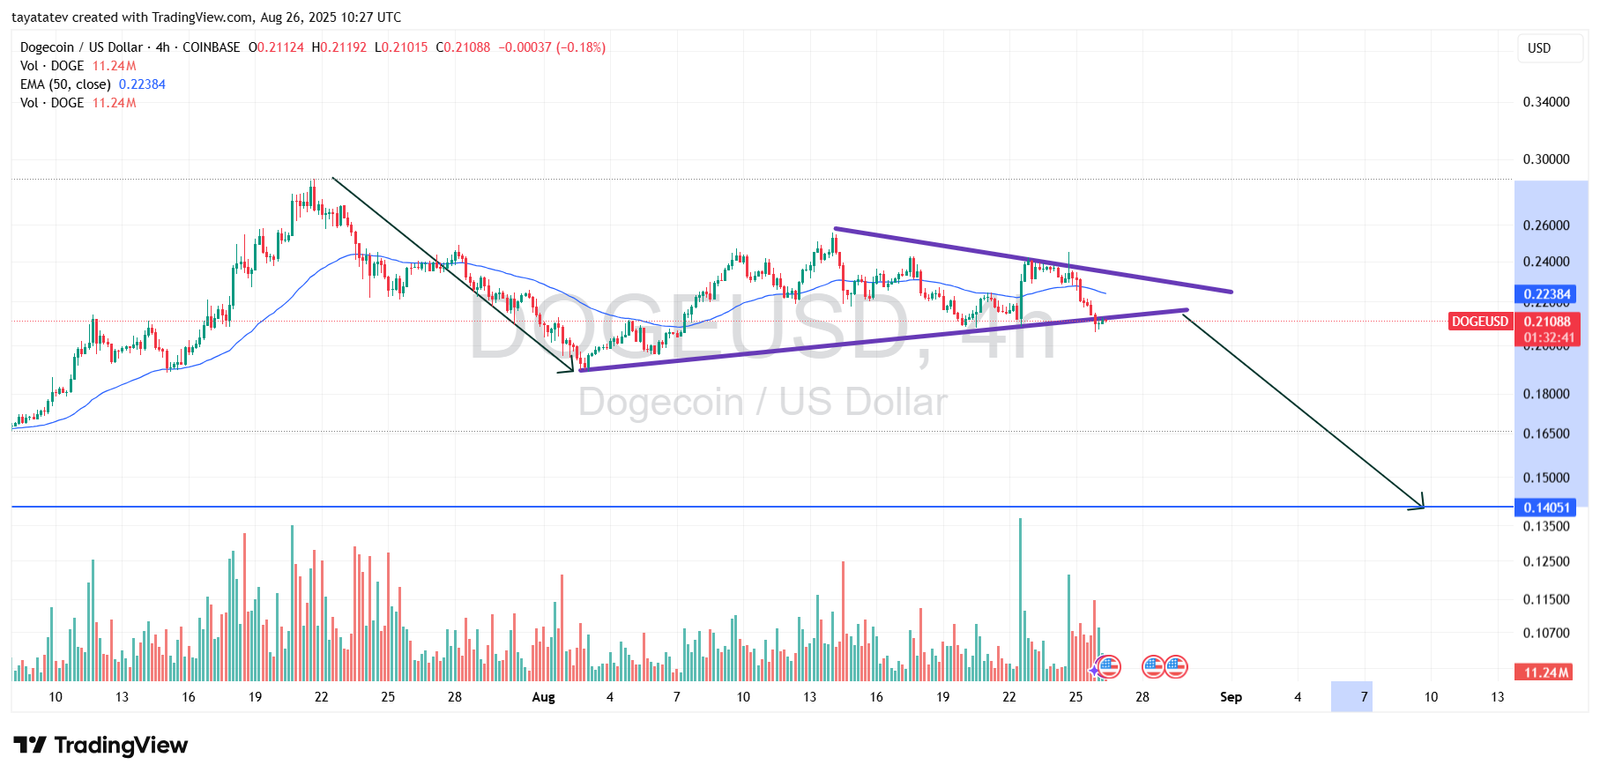
A bearish pennant forms when a steep decline, known as the flagpole, is followed by a tightening range where price oscillates between two converging lines. This consolidation phase often acts as a pause before another leg down. Traders monitor the lower boundary closely. If price closes decisively beneath it, the move usually resumes in the same direction as the initial drop.
Based on the measured move projection, the pennant implies that Dogecoin could fall further if the breakdown confirms. A fifty-one percent decline from the current price of 0.21088 USDT would bring the target close to 0.14051 USDT. This level matches the horizontal line marked on the chart. The setup aligns with the idea that a confirmed break beneath the rising support trendline could unleash a continuation of bearish momentum.
For now, Dogecoin trades just below its Exponential Moving Average, signaling that sellers hold control. If the lower trendline fails, the pennant confirms, and downside pressure could accelerate toward the 0.14 region. If the boundary holds, the consolidation may extend, but the pattern remains valid until broken. The four-hour chart therefore highlights a bearish pennant pointing to a potential fifty-one percent slide, with confirmation still depending on a clean breakdown and sustained momentum.
Dogecoin Relative Strength Index Analysis
The chart captured on August 26, 2025, shows the 14-period Relative Strength Index (RSI) for Dogecoin on the four-hour timeframe. At the snapshot, the RSI sits at 34.62, while its moving average line is at 43.51.

The Relative Strength Index tracks momentum by comparing the magnitude of recent gains against recent losses. Readings above 70 indicate overbought territory. Readings below 30 mark oversold conditions. With the RSI positioned near 34, Dogecoin trades close to the oversold zone but has not yet fully entered it. This suggests weakening momentum, with sellers maintaining control.
The decline from the mid-50s into the mid-30s reflects heavy selling pressure over recent sessions. The distance between the RSI line and its moving average signals that bearish momentum remains in play. If the RSI dips below 30, the indicator would confirm oversold conditions, which often precede a rebound.
For now, Dogecoin shows subdued strength on this timeframe. If momentum stabilizes and the RSI crosses back above its average, it could mark the start of a short-term recovery. If the indicator continues lower, the market may face further downside. The chart therefore highlights soft momentum, with conditions edging toward oversold territory but not yet confirming a reversal.
Dogecoin Balance of Power Analysis
The chart captured on August 26, 2025, shows the Balance of Power (BOP) indicator for Dogecoin on the four-hour timeframe. At the snapshot, the BOP reading is –0.02, which places it slightly below the neutral line at zero.
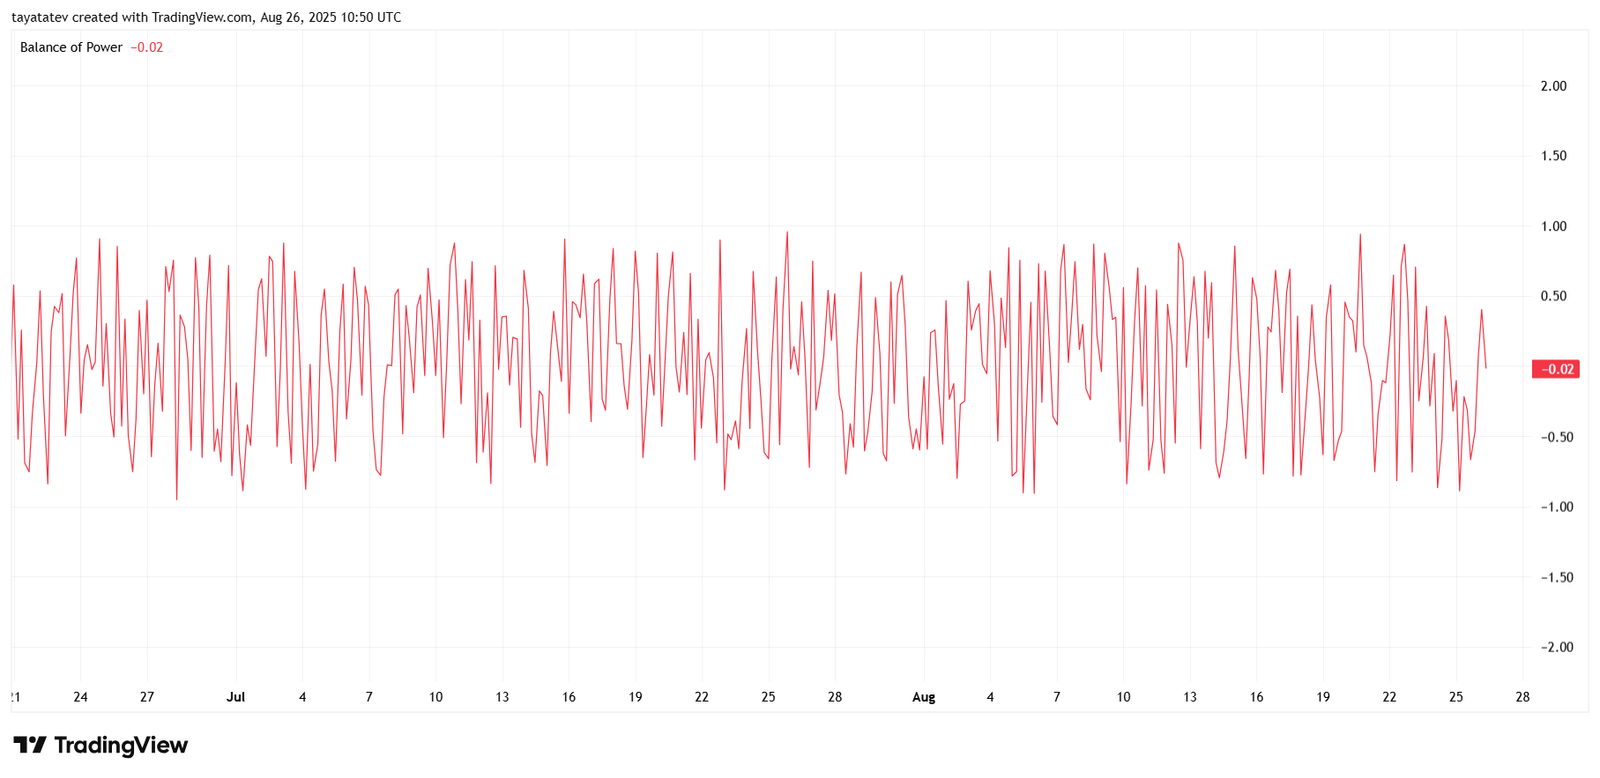
The Balance of Power indicator measures the relative strength of buyers and sellers by comparing the closing price against the trading range. Positive readings suggest buying pressure dominates, while negative readings point to stronger selling activity. A value close to zero signals indecision between bulls and bears.
In this case, the BOP hovering just below zero shows that sellers have a slight edge, but momentum remains weak on both sides. The erratic swings visible on the chart highlight choppy conditions, with neither buyers nor sellers establishing sustained control. This explains why Dogecoin has struggled to maintain direction over the past sessions.
If the BOP dips further into negative territory and holds there, it would confirm that bears are regaining momentum. On the other hand, a return above zero would mark renewed buying pressure. For now, the indicator suggests balance is tilting slightly toward the downside, but conviction from either side is lacking.