
Pi Coin sentiment has fallen to its lowest level in four months, according to data from Santiment. The weighted sentiment index recorded a notable decline in the past 24 hours. The drop highlights growing caution among investors, with many expressing concern over stagnant price movement.
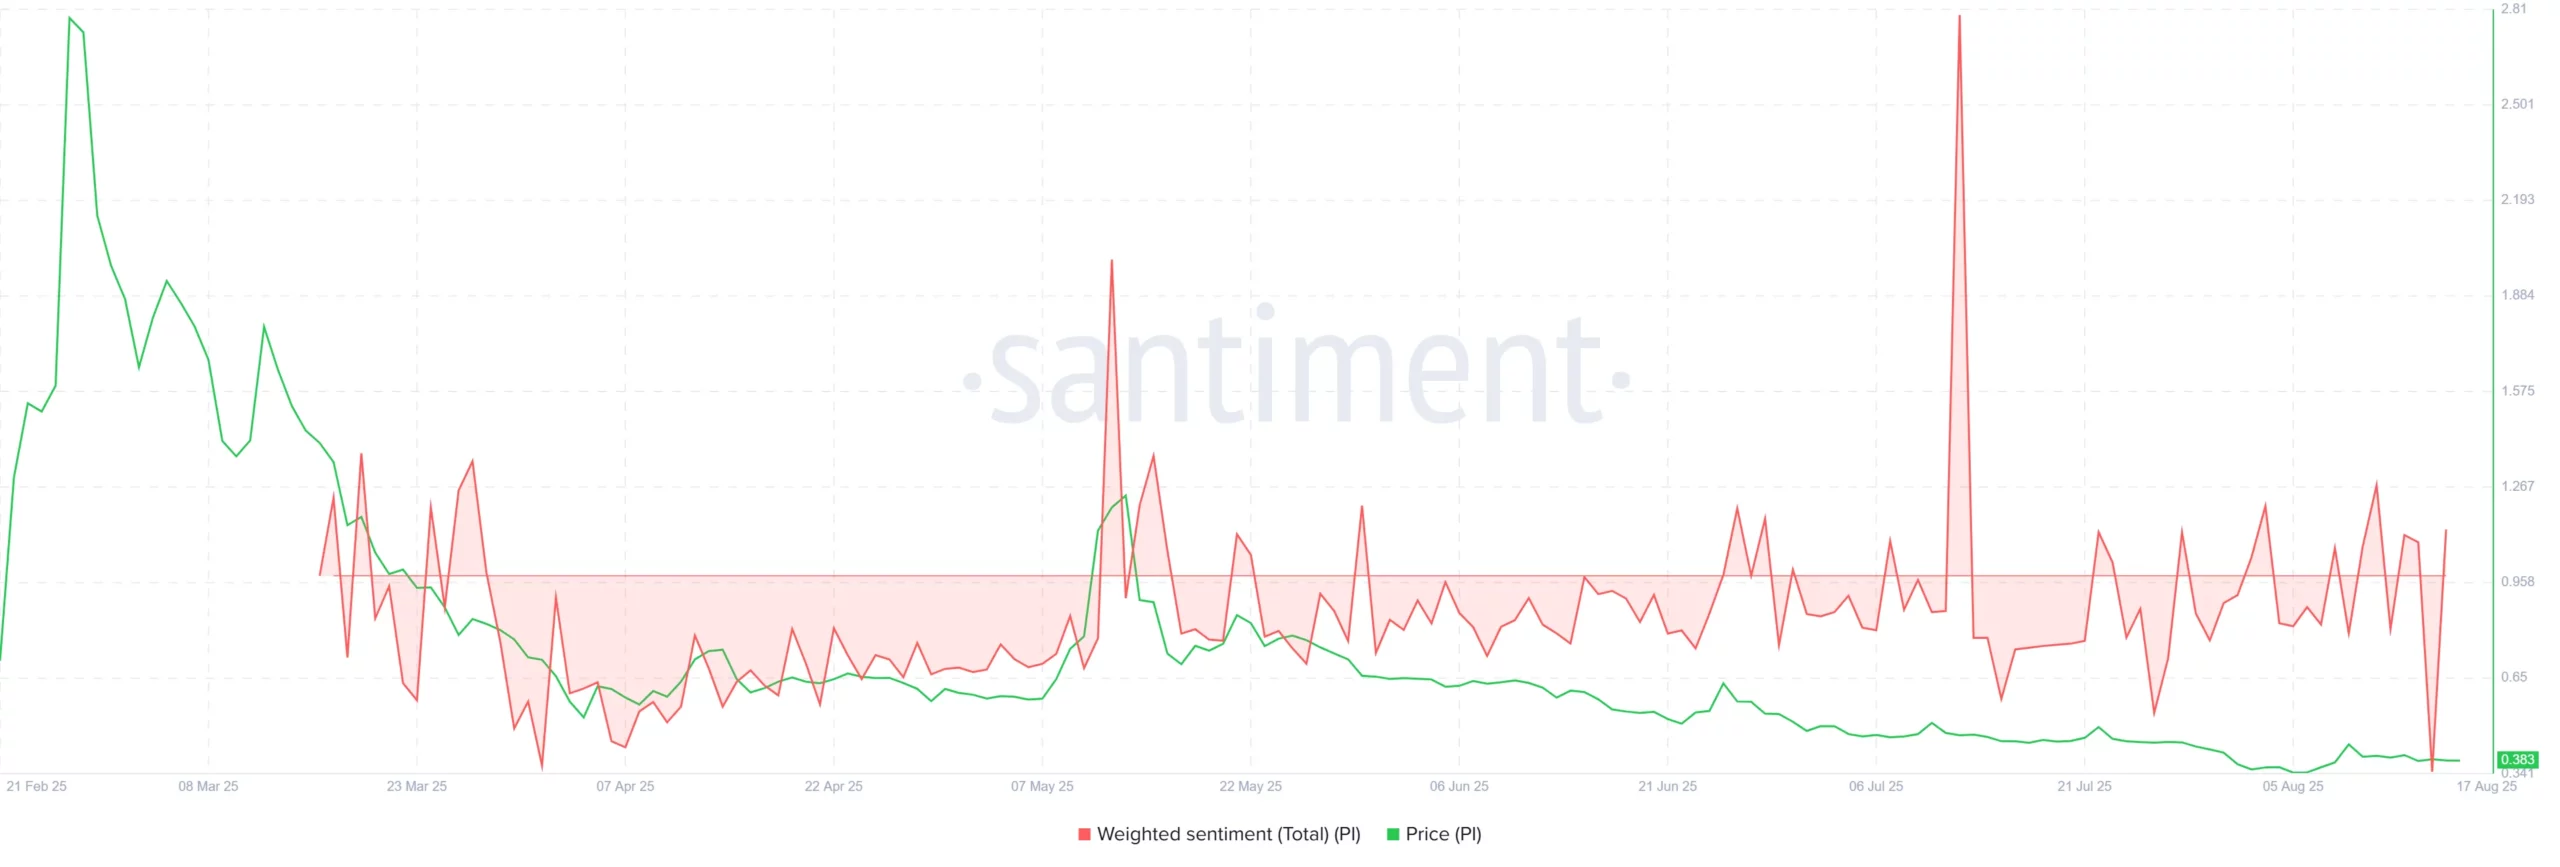
The decline in sentiment reflects fading optimism. Traders who anticipated stronger performance from Pi Coin have instead faced limited price action. This development has added pressure on investor confidence.

Data indicates that the sharp downturn in sentiment is tied to short-term market behavior rather than structural changes. The sudden shift within one day shows how quickly holders adjust to the absence of upward momentum.
Stagnant Pi Coin Price Adds Pressure
The lack of bullish activity has been central to the negative turn in Pi Coin sentiment. Market participants expected Pi Coin to generate steady gains. However, the asset has struggled to produce any clear upward trend.
This lack of movement has fueled caution across trading communities. Investors who entered the market seeking stronger momentum are now facing uncertainty. The limited progress in price charts has made the drop in sentiment more pronounced.
Chaikin Money Flow Shows Positive Inflows for Pi Coin
Despite the weaker outlook in sentiment, some technical indicators continue to reflect resilience. The Chaikin Money Flow (CMF) indicator, which measures inflows and outflows, remains above the zero line.
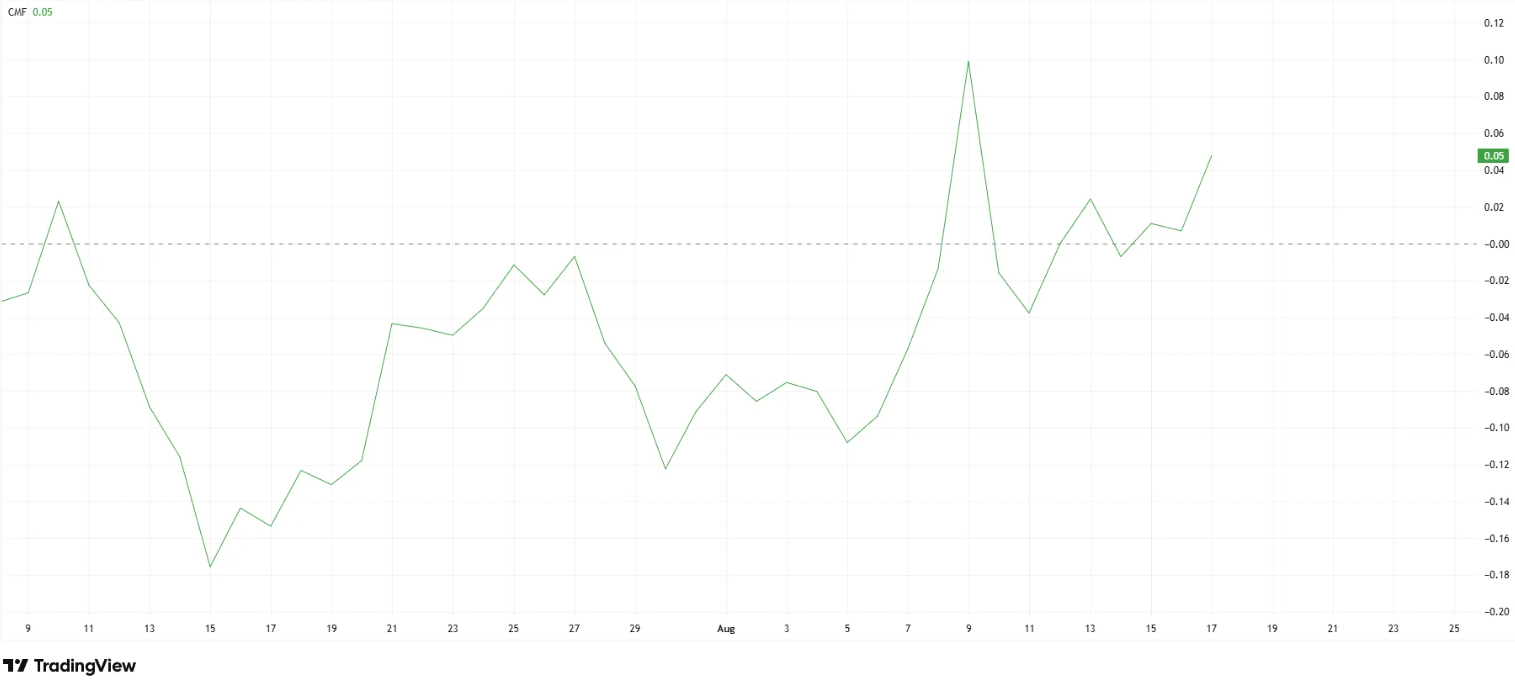
This level signals that Pi Coin is still receiving net inflows, even as weighted sentiment moves lower. The presence of capital entering the asset contrasts with the negative mood shown in trader psychology.
The CMF data highlights that Pi Coin retains measurable support from investors allocating funds into the asset. While sentiment captures short-term reactions, CMF shows ongoing capital activity in the background.
Santiment’s data presents a mixed picture for Pi Coin. The weighted sentiment index has declined to a four-month low, reflecting weaker confidence among traders. At the same time, the Chaikin Money Flow shows continuing inflows, suggesting that capital support has not fully disappeared.
This divergence highlights the difference between investor psychology and underlying market activity. On one side, sentiment points to caution. On the other, money flow indicators show measurable inflows.
The current data emphasizes both the decline in short-term sentiment and the resilience shown by capital entering Pi Coin. These signals illustrate the complex state of the asset’s market conditions.
Pi Coin Price Struggles Below Resistance
The Pi Coin price against USDT has continued to move within a downward structure, as shown on the 4-hour chart from TradingView. Since late June, the price has trended lower under a descending resistance line, which has capped multiple rebound attempts. On August 17, Pi Coin was trading at $0.3853, slightly below the 50-period EMA at $0.3869, highlighting pressure at the moving average.

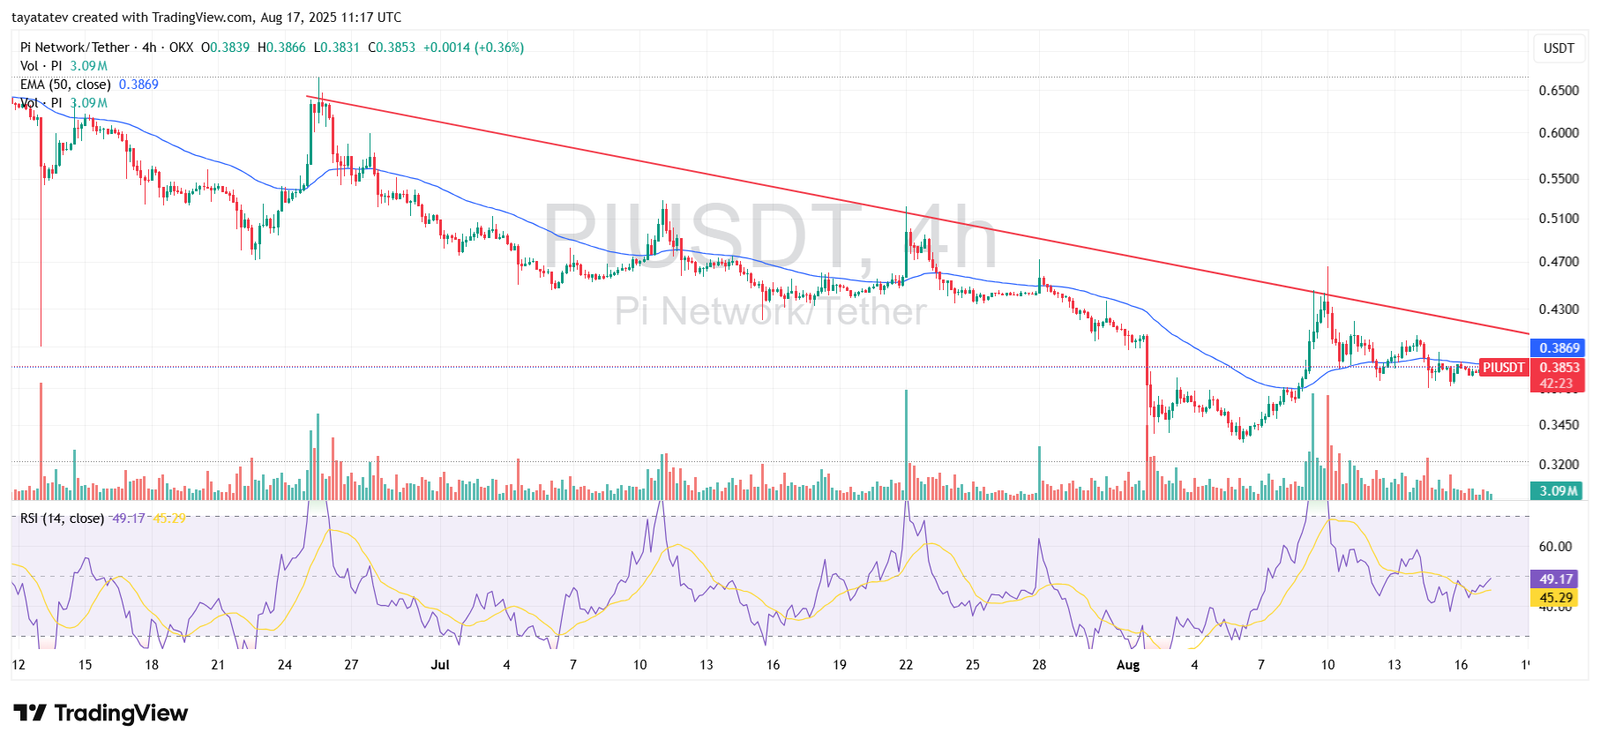
Volume data shows a lack of strong buying activity during recent attempts to break above the EMA. Selling pressure has repeatedly emerged near the red descending trendline, keeping the price confined below it. This ongoing rejection signals that the trend remains under control of sellers.
Momentum indicators add further context. The Relative Strength Index (RSI) currently sits near 49.17, which places it in the neutral zone. The RSI line has attempted to recover from earlier oversold levels but remains unable to cross into bullish territory. The yellow signal line, now at 45.29, indicates that momentum is improving slightly but not yet showing decisive strength.
For now, the key observation is that Pi Coin continues to face resistance from both the trendline and the EMA. Unless the price can sustain a close above these levels, downward pressure is likely to persist. At the same time, RSI data suggests that momentum is stabilizing, meaning traders are watching for whether consolidation leads to another test of resistance or continued movement sideways.
Pi Coin MACD Indicator Shows Weak Momentum
The MACD (Moving Average Convergence Divergence) chart for Pi Coin reveals weakening momentum after a recent attempt at recovery. The blue MACD line currently stands at -0.0011, while the orange signal line is slightly higher at 0.0011, indicating a minor bearish crossover.
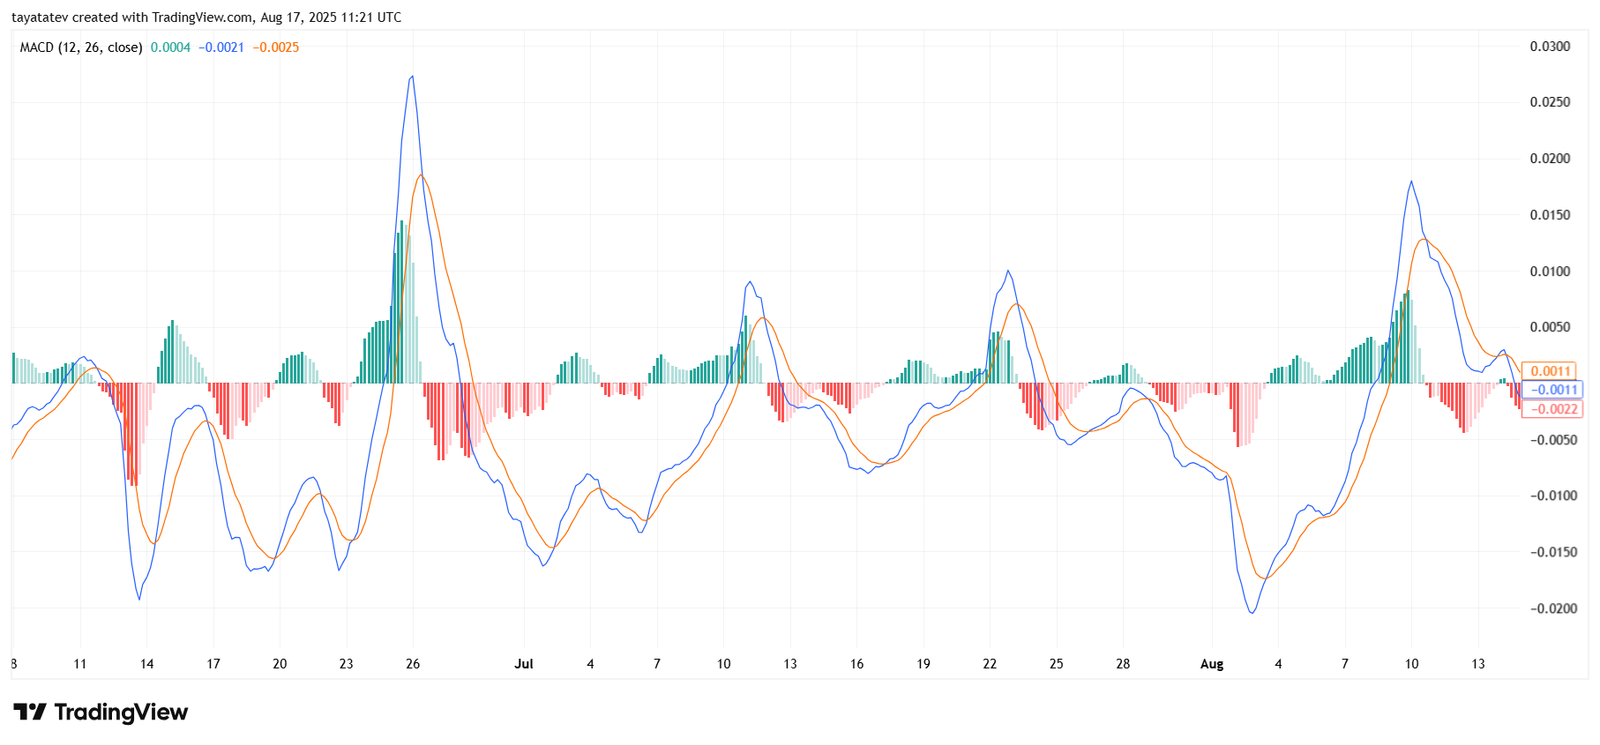
The histogram bars, which measure the distance between the two lines, have shifted back into red territory. This movement highlights the loss of bullish strength that briefly emerged earlier in August. The tall green bars recorded on August 10 showed strong buying pressure, but that momentum quickly faded as sellers regained control.
Since then, the MACD lines have moved closer together, reflecting indecision in the market. The crossover near the zero line signals that Pi Coin is at a key stage, with either renewed selling pressure or potential consolidation ahead. The absence of a strong upward divergence confirms that momentum remains fragile.
Overall, the MACD indicator suggests that Pi is struggling to maintain bullish momentum. While earlier gains hinted at recovery, the current bearish crossover points to continued caution as the asset trades under its resistance levels.