
On June 24, 2025, the Pi Network (PI) price against Tether (USDT) formed a rising wedge pattern on the 1-hour chart, as shown on the OKX crypto exchange. The chart displays two upward-sloping trendlines gradually converging, which creates the wedge shape.
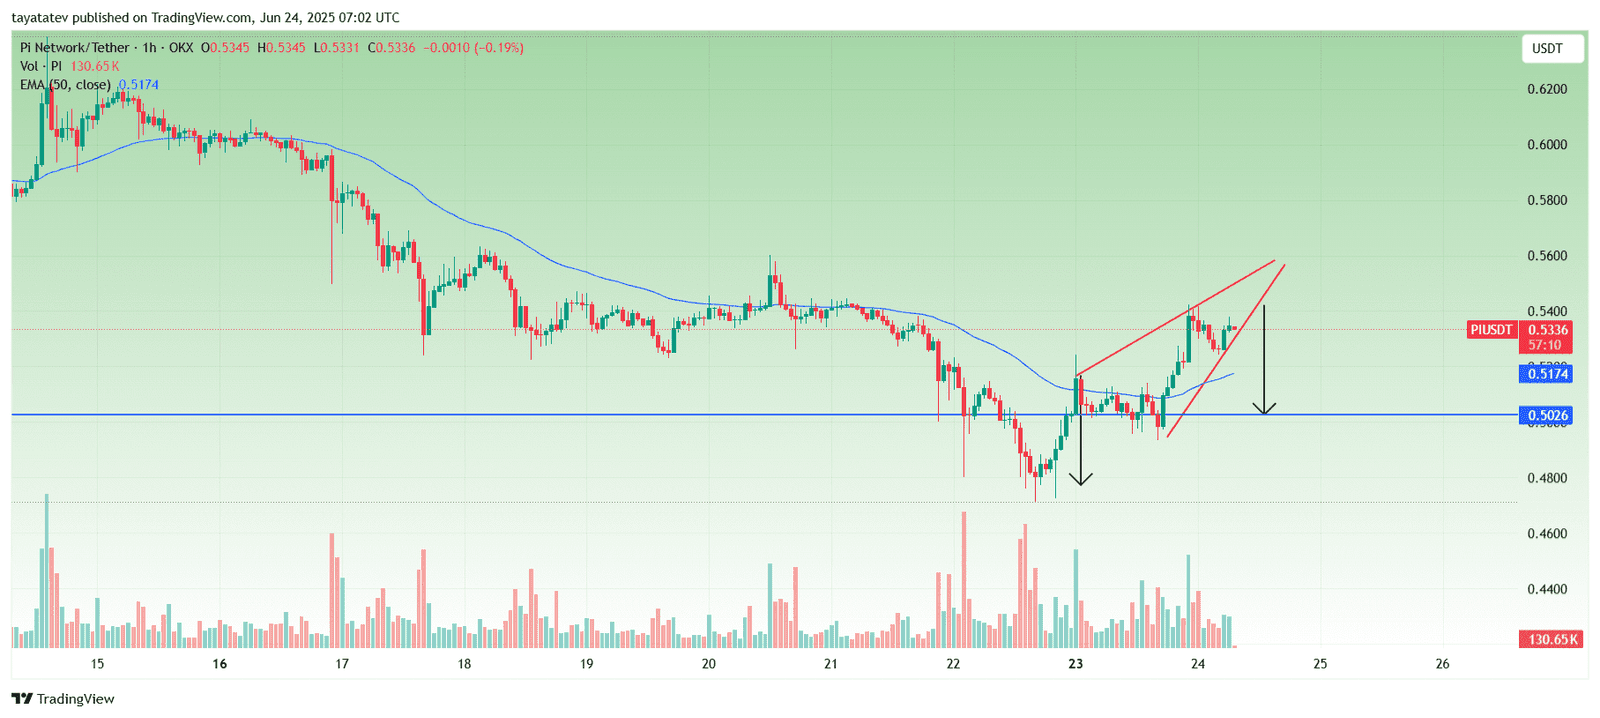
A rising wedge is a bearish technical pattern. It appears when the price rises while the range between highs and lows narrows. This structure often signals that buyers are losing strength and a downward reversal could follow.
In this setup, the pattern formed above the 50-period Exponential Moving Average (EMA), which is currently at $0.5174. The Exponential Moving Average gives more weight to recent prices and helps identify short-term trends.
If the price breaks below the lower support line of the wedge, the bearish pattern will be confirmed. In that case, PI/USDT could fall approximately 6% from the current price of $0.5336. This drop would bring the token down to the next key horizontal support near $0.5026.
The volume bars also suggest weakening buying pressure, which supports the idea of a possible reversal. If the breakdown happens, sellers may gain control and push the price lower toward the projected target.
PIUSDT Balance of Power Indicator Stays Neutral on June 24, 2025
The Balance of Power (BOP) indicator for Pi Network (PI) against Tether (USDT) hovered near the neutral zone at 0.02, according to data from the TradingView chart on the OKX exchange.
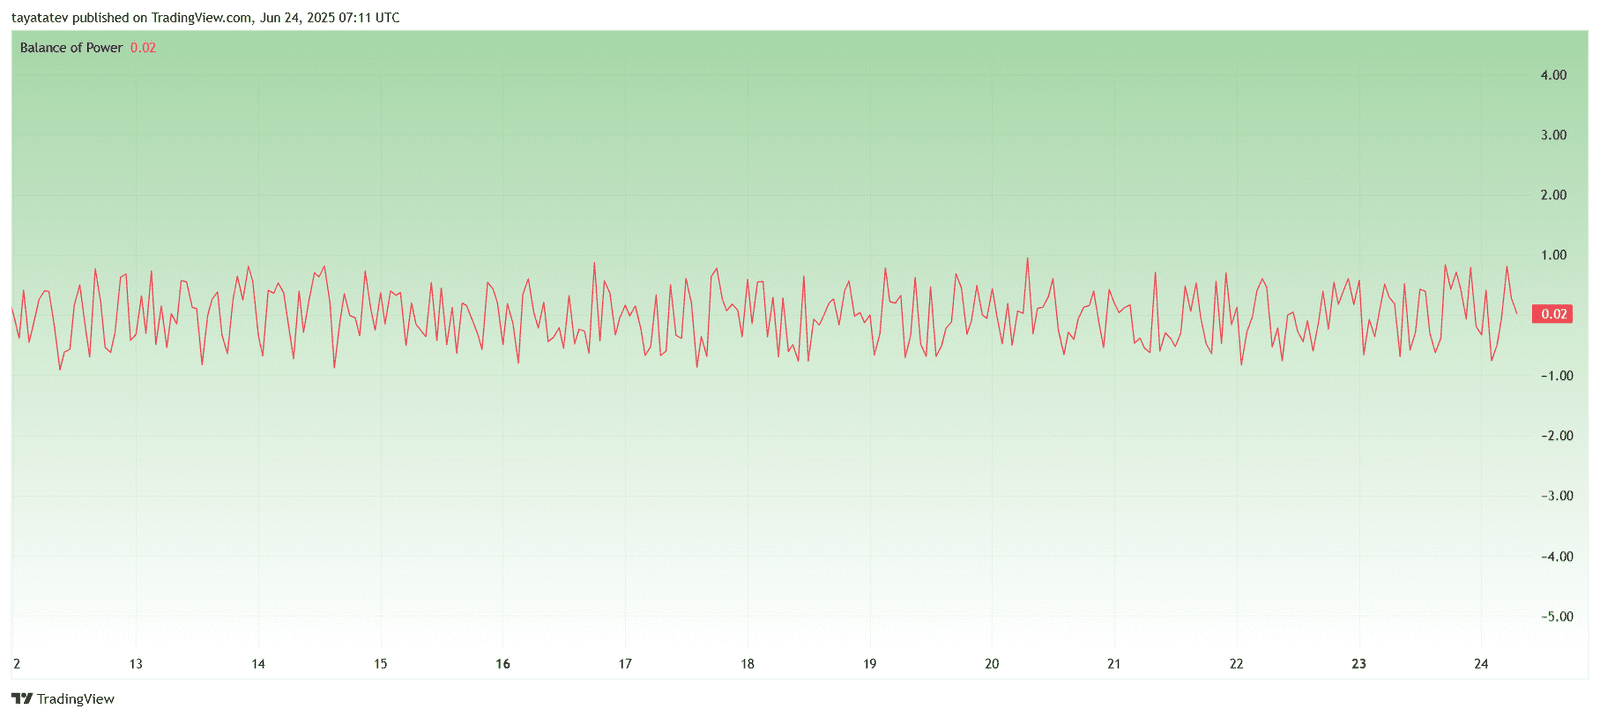
The Balance of Power (BOP) is a momentum-based indicator that measures the strength of buying versus selling pressure. It ranges between -1 and +1. Positive values suggest buyers dominate, while negative values indicate sellers are in control.
In this case, the BOP reading near zero shows that neither buyers nor sellers have a clear advantage. This neutral position supports the weakening momentum observed in the rising wedge pattern on the 1-hour price chart. If selling pressure increases, BOP may turn negative, reinforcing the case for a potential price drop.
PIUSDT RSI Approaches Overbought Zone on June 24, 2025
On June 24, 2025, the Relative Strength Index (RSI) for Pi Network (PI) against Tether (USDT) reached a reading of 64.15 on the 14-period setting, according to the chart on TradingView. The RSI line is shown in purple, with the yellow line representing the RSI-based moving average, currently at 63.77.
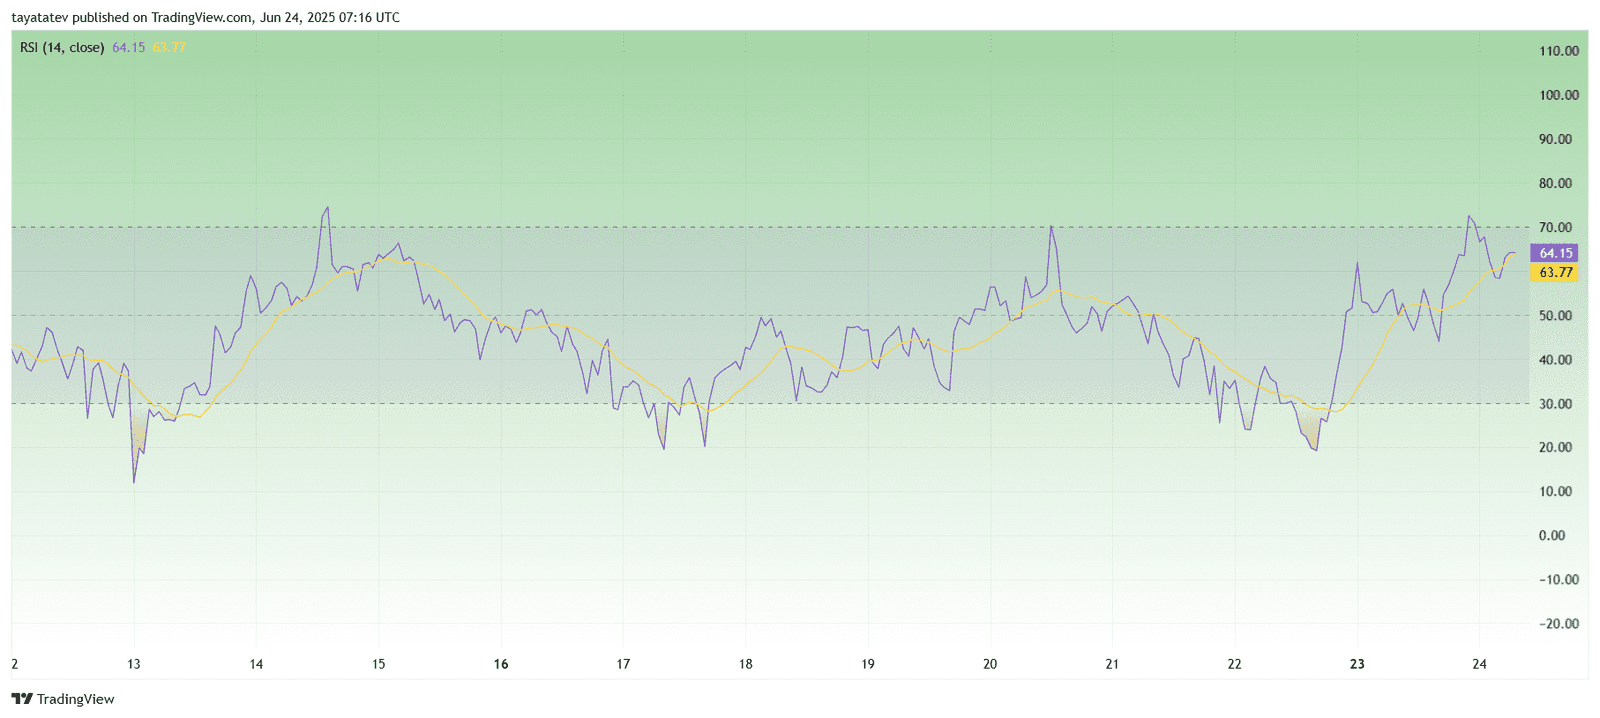
The Relative Strength Index (RSI) is a momentum oscillator that measures the speed and change of price movements on a scale from 0 to 100. A reading above 70 signals overbought conditions, while below 30 indicates oversold conditions. Traders use RSI to detect potential reversals or continuation trends.
Currently, the RSI is nearing the 70 threshold but remains below it. This shows moderate bullish momentum without confirming overbought conditions yet. However, since the RSI is rising and approaching overbought territory, the asset may face selling pressure soon—especially as it aligns with the weakening structure seen in the rising wedge pattern.
PIUSDT MACD Shows Bullish Crossover on June 24, 2025
Meanwhile, the Moving Average Convergence Divergence (MACD) indicator for Pi Network (PI) against Tether (USDT) displayed a bullish signal. According to the TradingView chart, the MACD line (blue) is currently at 0.0073, while the signal line (orange) is at 0.0066, creating a positive gap.
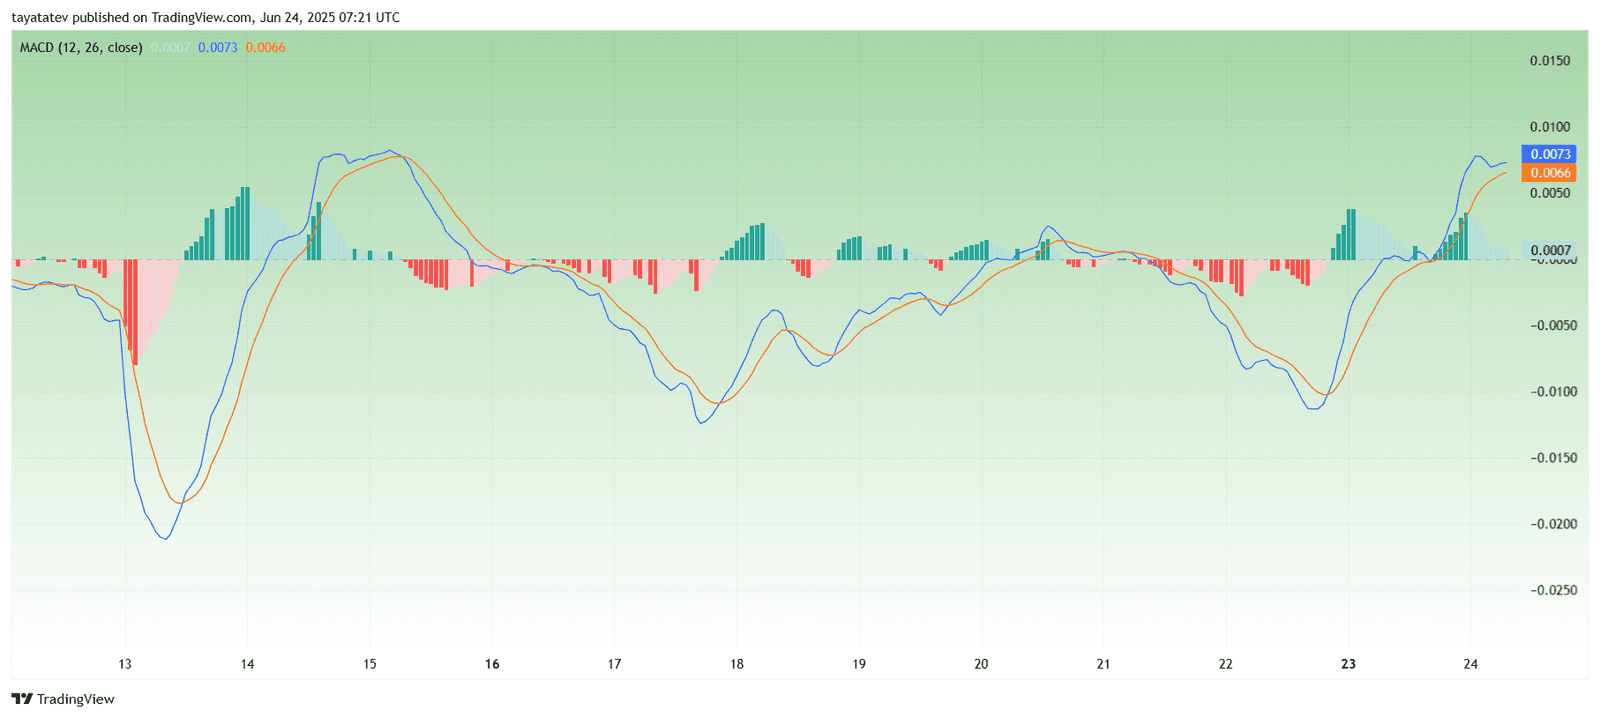
The MACD is a momentum indicator that tracks the relationship between two exponential moving averages—typically the 12-period EMA and the 26-period EMA. A bullish crossover happens when the MACD line crosses above the signal line, indicating increasing upward momentum. The histogram bars, shown in green, represent the difference between the MACD and signal line.
The current MACD reading confirms a bullish crossover that occurred recently. However, the bars are beginning to shorten, suggesting early signs of waning strength. If the histogram continues to contract, it may signal weakening bullish momentum—especially when combined with the rising wedge pattern on the price chart and the neutral Balance of Power indicator.
Pi Network Prepares for Pi2Day Amid AI Hints and KYC Rollout
As June 28, 2025, approaches, Pi Network’s community, known as “Pioneers,” is preparing for Pi2Day—an annual event often marked by announcements and ecosystem updates. This year, the network may introduce major changes that go beyond user speculation.
In the lead-up to Pi2Day, the Pi Core Team hinted at a potential link between Pi Network and generative artificial intelligence (AI). Co-founder Nicolas Kokkalis recently appeared on a generative AI panel, prompting discussion about upcoming integration.
Users now expect that AI tools could enhance in-app functionality, streamline mining mechanisms, or improve network security. The Core Team has not confirmed these changes, but a detailed update is expected on June 28. Google Trends data shows a notable increase in searches for “Pi2Day,” reflecting growing public attention.
KYC Sync Feature Released After Years of Delay
Alongside AI-related developments, Pi Network released its long-awaited Know Your Customer (KYC) sync feature. This rollout resolved long-standing verification issues and marked a critical step toward wider user onboarding.
The update now allows users to synchronize their KYC status across devices, reducing errors and duplicate submissions. With this fix in place, expectations for more technical upgrades on Pi2Day have intensified.
Despite growing anticipation, the supply of Pi on centralized exchanges has surged. Piscan data shows that holdings jumped from 345 million to 362 million Pi coins in one week. Gate.io currently holds 168 million, while Bitget controls 122 million—together accounting for most of the exchange-based liquidity.
This increase suggests growing readiness for trading activity but also adds selling pressure. The network’s circulating supply remains a major factor in user sentiment.
Analyst Outlook and Event Expectations
Crypto analyst Dr. Altcoin stated that Pi Coin may stay near the $0.40 level through August unless broader market dynamics shift. He acknowledged that Pi2Day could spark renewed interest but emphasized that the event alone may not push the price beyond $0.60.
Still, rumors persist. Community posts suggest that Pi Network might announce new listings or AI-based tools on June 28. However, no official confirmations have been made as of June 24.
With AI integrations teased and the KYC sync feature now live, Pi Network enters Pi2Day week on a wave of development. The Core Team is expected to release more information on June 28. Until then, the community continues to monitor updates, hoping this year’s event will deliver meaningful utility rather than hype.