
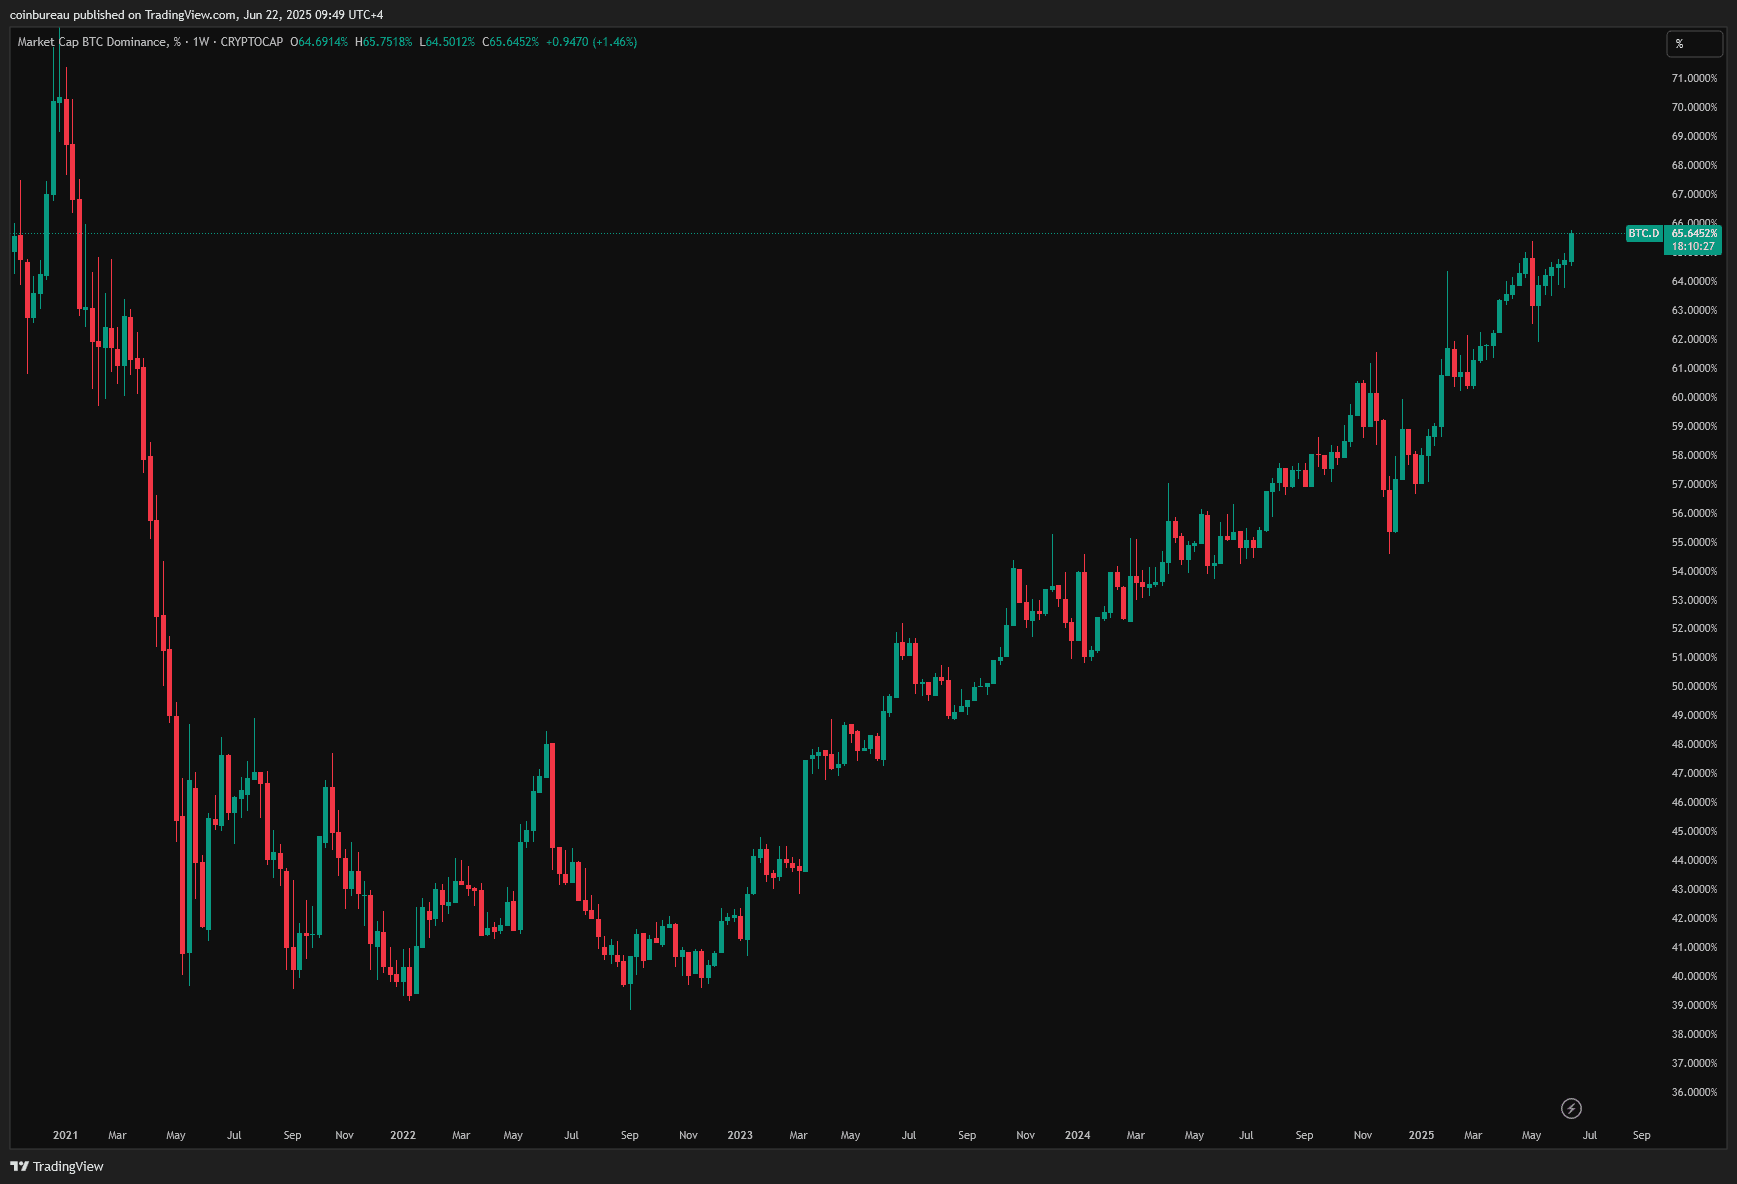
Bitcoin Dominance (BTC.D) rose past 65% on June 23, 2025, marking its highest level since February 2021. This metric shows Bitcoin’s share of the total crypto market capitalization. According to TradingView, BTC.D has now increased for seven quarters in a row without any major correction.
The rise in Bitcoin Dominance reflects capital inflows into Bitcoin, as both retail and institutional investors reduced exposure to altcoins. The move comes amid increasing geopolitical tensions between the United States and Iran.
Crypto analyst Rekt Capital stated,
“Now Bitcoin Dominance is only 5.5% away from 71%. Altcoins won’t go to zero. Instead, they may react similarly to Feb 2025.”
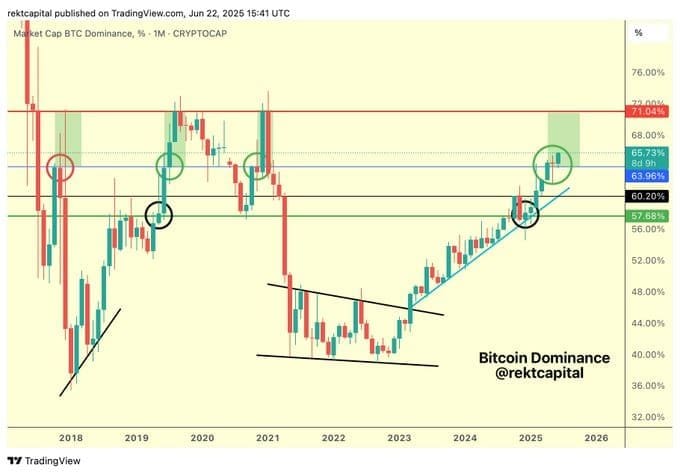
Back then, Bitcoin Dominance peaked, and the altcoin market saw a major drop.
In February 2025, the total altcoin market cap, measured by the TOTAL2 index, dropped from $1.4 trillion to $1 trillion. A similar move today could bring TOTAL2 below $700 billion if BTC.D rises to 71%.
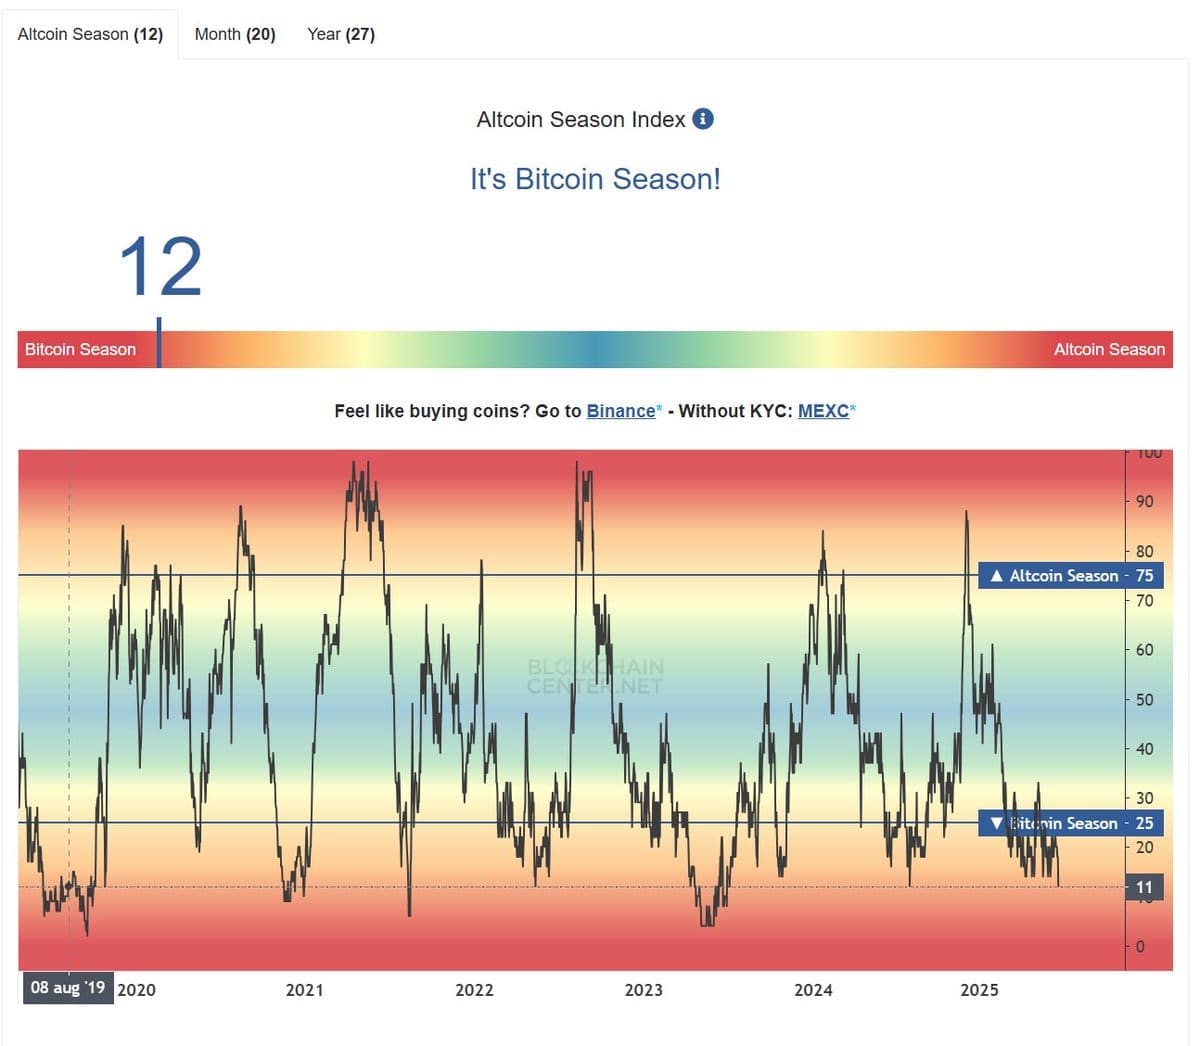
Altcoin Season Index Plummets to 12 Points
As of June 23, the Altcoin Season Index stands at 12—its lowest level in the last two years. The index tracks whether most altcoins have outperformed Bitcoin in the past 90 days. A value of 75 or more indicates a typical Altcoin Season, but current readings remain far below that mark.
CoinBureau co-founder Nic said,
“It’s now the furthest we have been from Altcoin season in almost a year. That’s if you believe the ‘Altcoin Season Index’.”
The index is published by Blockchain Center and highlights changing market sentiment in the altcoin market. Right now, data shows continued underperformance of altcoins against Bitcoin.
Analyst Michaël van de Poppe noted that the index often bottoms in June or July. In past years, this happened before capital rotated back into the altcoin market. 0xNobler also said Altcoin Season often starts in summer. However, with BTC.D still rising, that shift has not started this year.
Geopolitical Tensions Drive Bitcoin Preference
The climb in Bitcoin Dominance also follows political events. Over the past week, U.S. President Donald Trump ordered new military actions targeting Iranian nuclear sites. In response, Iran issued threats of escalation. The market responded by reducing risk, favoring Bitcoin over altcoins.
As a result, the crypto market saw a shift in structure. TradingView data confirms this move, showing long-term inflows into Bitcoin while altcoin market cap declined. Many investors now focus on BTC’s relative stability as conflict concerns remain.
The latest seven-quarter rise in Bitcoin Dominance marks the longest consistent gain since 2017. No quarter in that period showed a decline in BTC.D, underlining how much capital has moved into Bitcoin in recent months.
Altcoins Trail as Bitcoin Dominance Rises
As of June 23, the Altcoin Season Index remains far below the Altcoin Season threshold, while Bitcoin Dominance continues to climb. Analysts referenced past cycles, noting that June often marks a low point for altcoins before any rotation begins. But current data does not yet show signs of a shift.
The latest readings from Blockchain Center, TradingView, and public commentary from analysts like Rekt Capital, Michaël van de Poppe, and 0xNobler show that Bitcoin remains the focus. The altcoin market continues to lag while Bitcoin Dominance holds above 65%.