




TLDR
- ETH is trading near $2,486–$2,500, stuck in a tight range for over three weeks.
- Open interest has lagged price growth, pointing to weak conviction from leveraged traders.
- US spot ETH ETFs saw $24.3 million in net outflows on Tuesday.
- Key resistance sits at $2,525–$2,535; a close above could target $2,550–$2,600.
- Downside support levels to watch are $2,478, $2,435–$2,445, and $2,350–$2,360.
Ethereum is trading near $2,486 on September 9, holding just below the $2,500 mark after several weeks of tight consolidation. The price has been range-bound between $2,431 and $2,544 with no clear breakout in either direction.
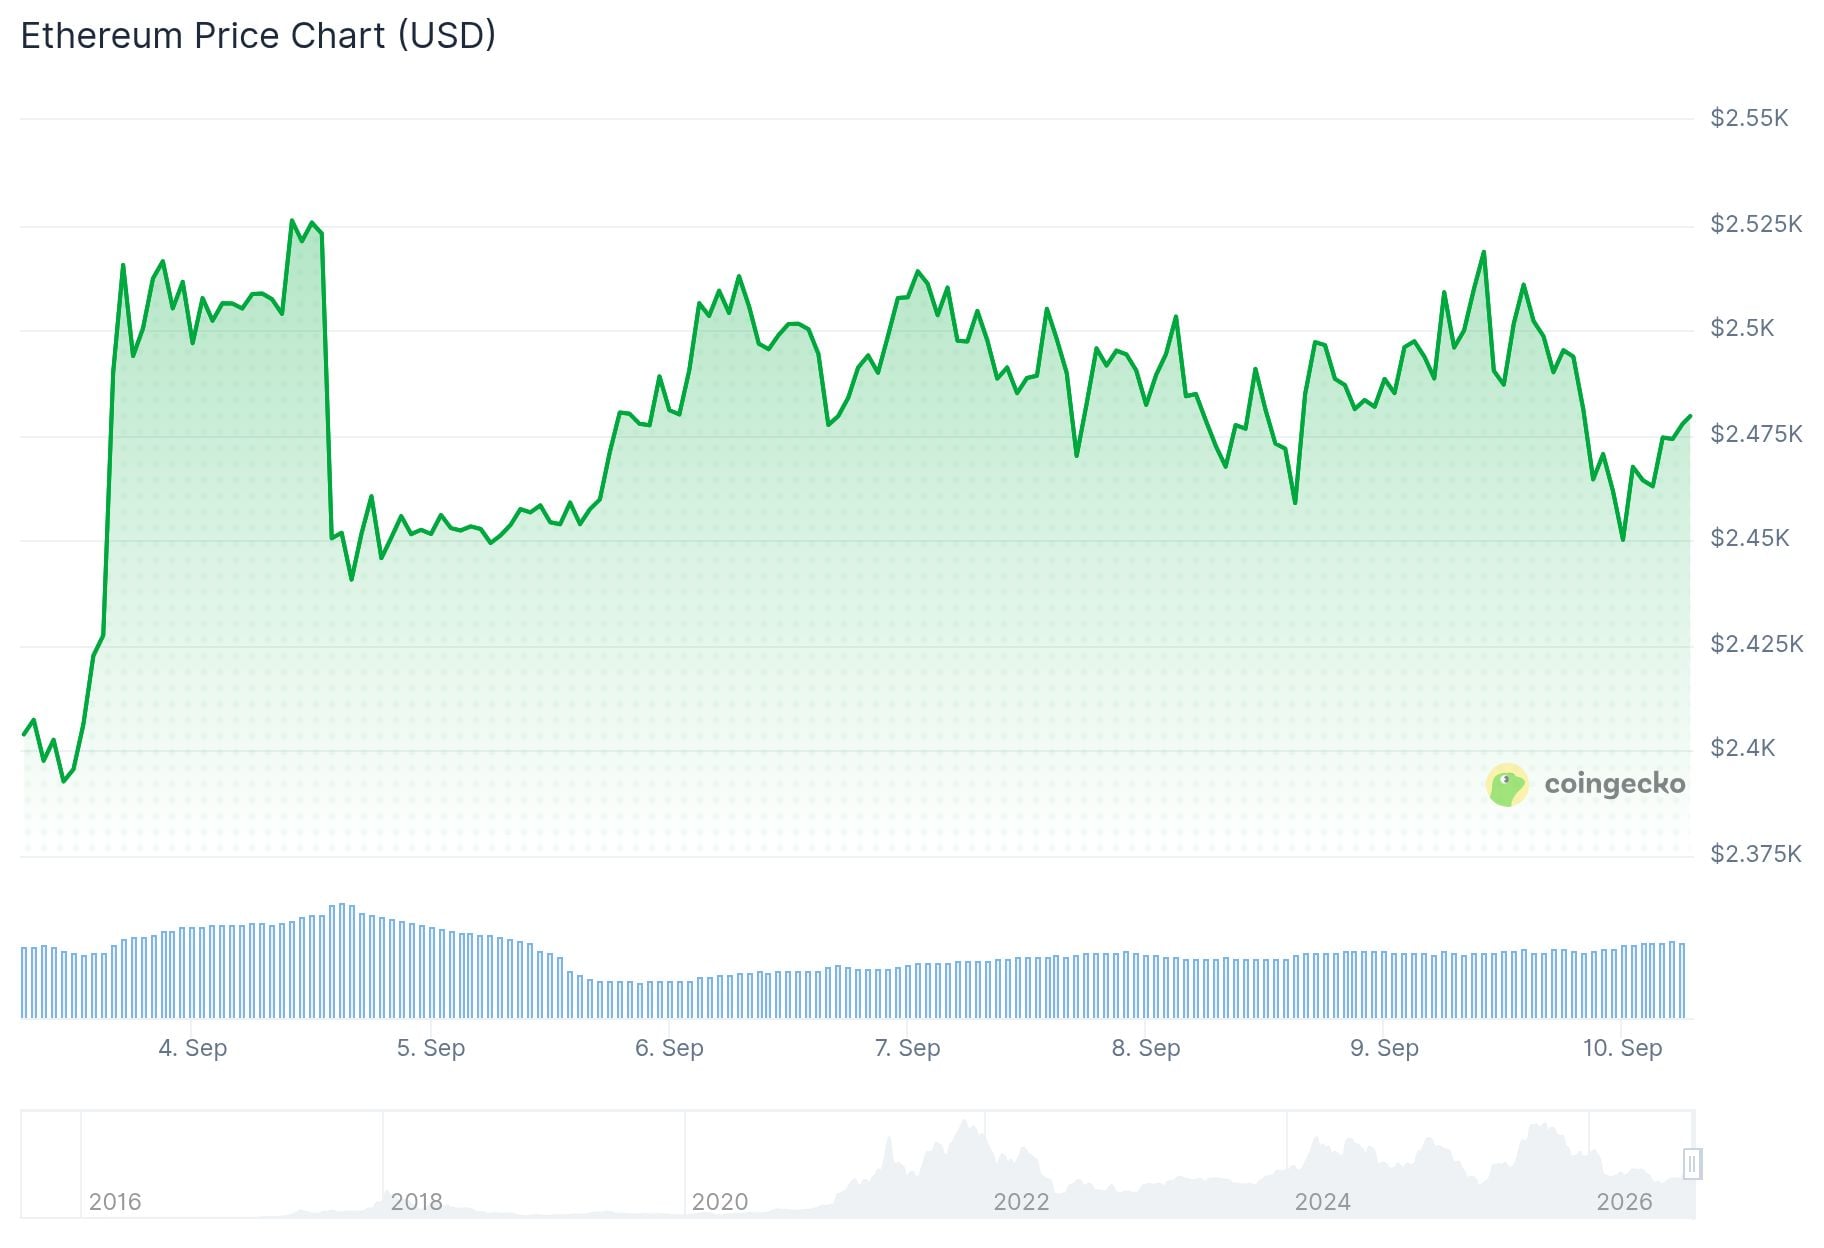
Buyers have stepped in repeatedly around the $2,478–$2,485 zone, but each recovery attempt has run into selling pressure between $2,525 and $2,535. That resistance band has capped price action consistently since ETH’s August rally.
ETH currently trades above its 20-, 50-, 100-, and 200-day Exponential Moving Averages, which keeps the broader technical picture leaning bullish. The 20-day EMA near $2,403 is acting as the closest dynamic support below price.
The 14-day RSI is sitting in the low 60s, and the Stochastic Oscillator is around 62. These readings suggest buying pressure exists but is not strong enough to force a breakout.
Derivatives Show Weak Conviction
Open interest in ETH futures has dropped by roughly 1 million ETH since July, even as ETH’s price climbed 58% over the same period. In dollar terms, open interest rose 54% to $33.7 billion — but price outpacing open interest suggests leveraged long traders are not piling in with fresh capital.
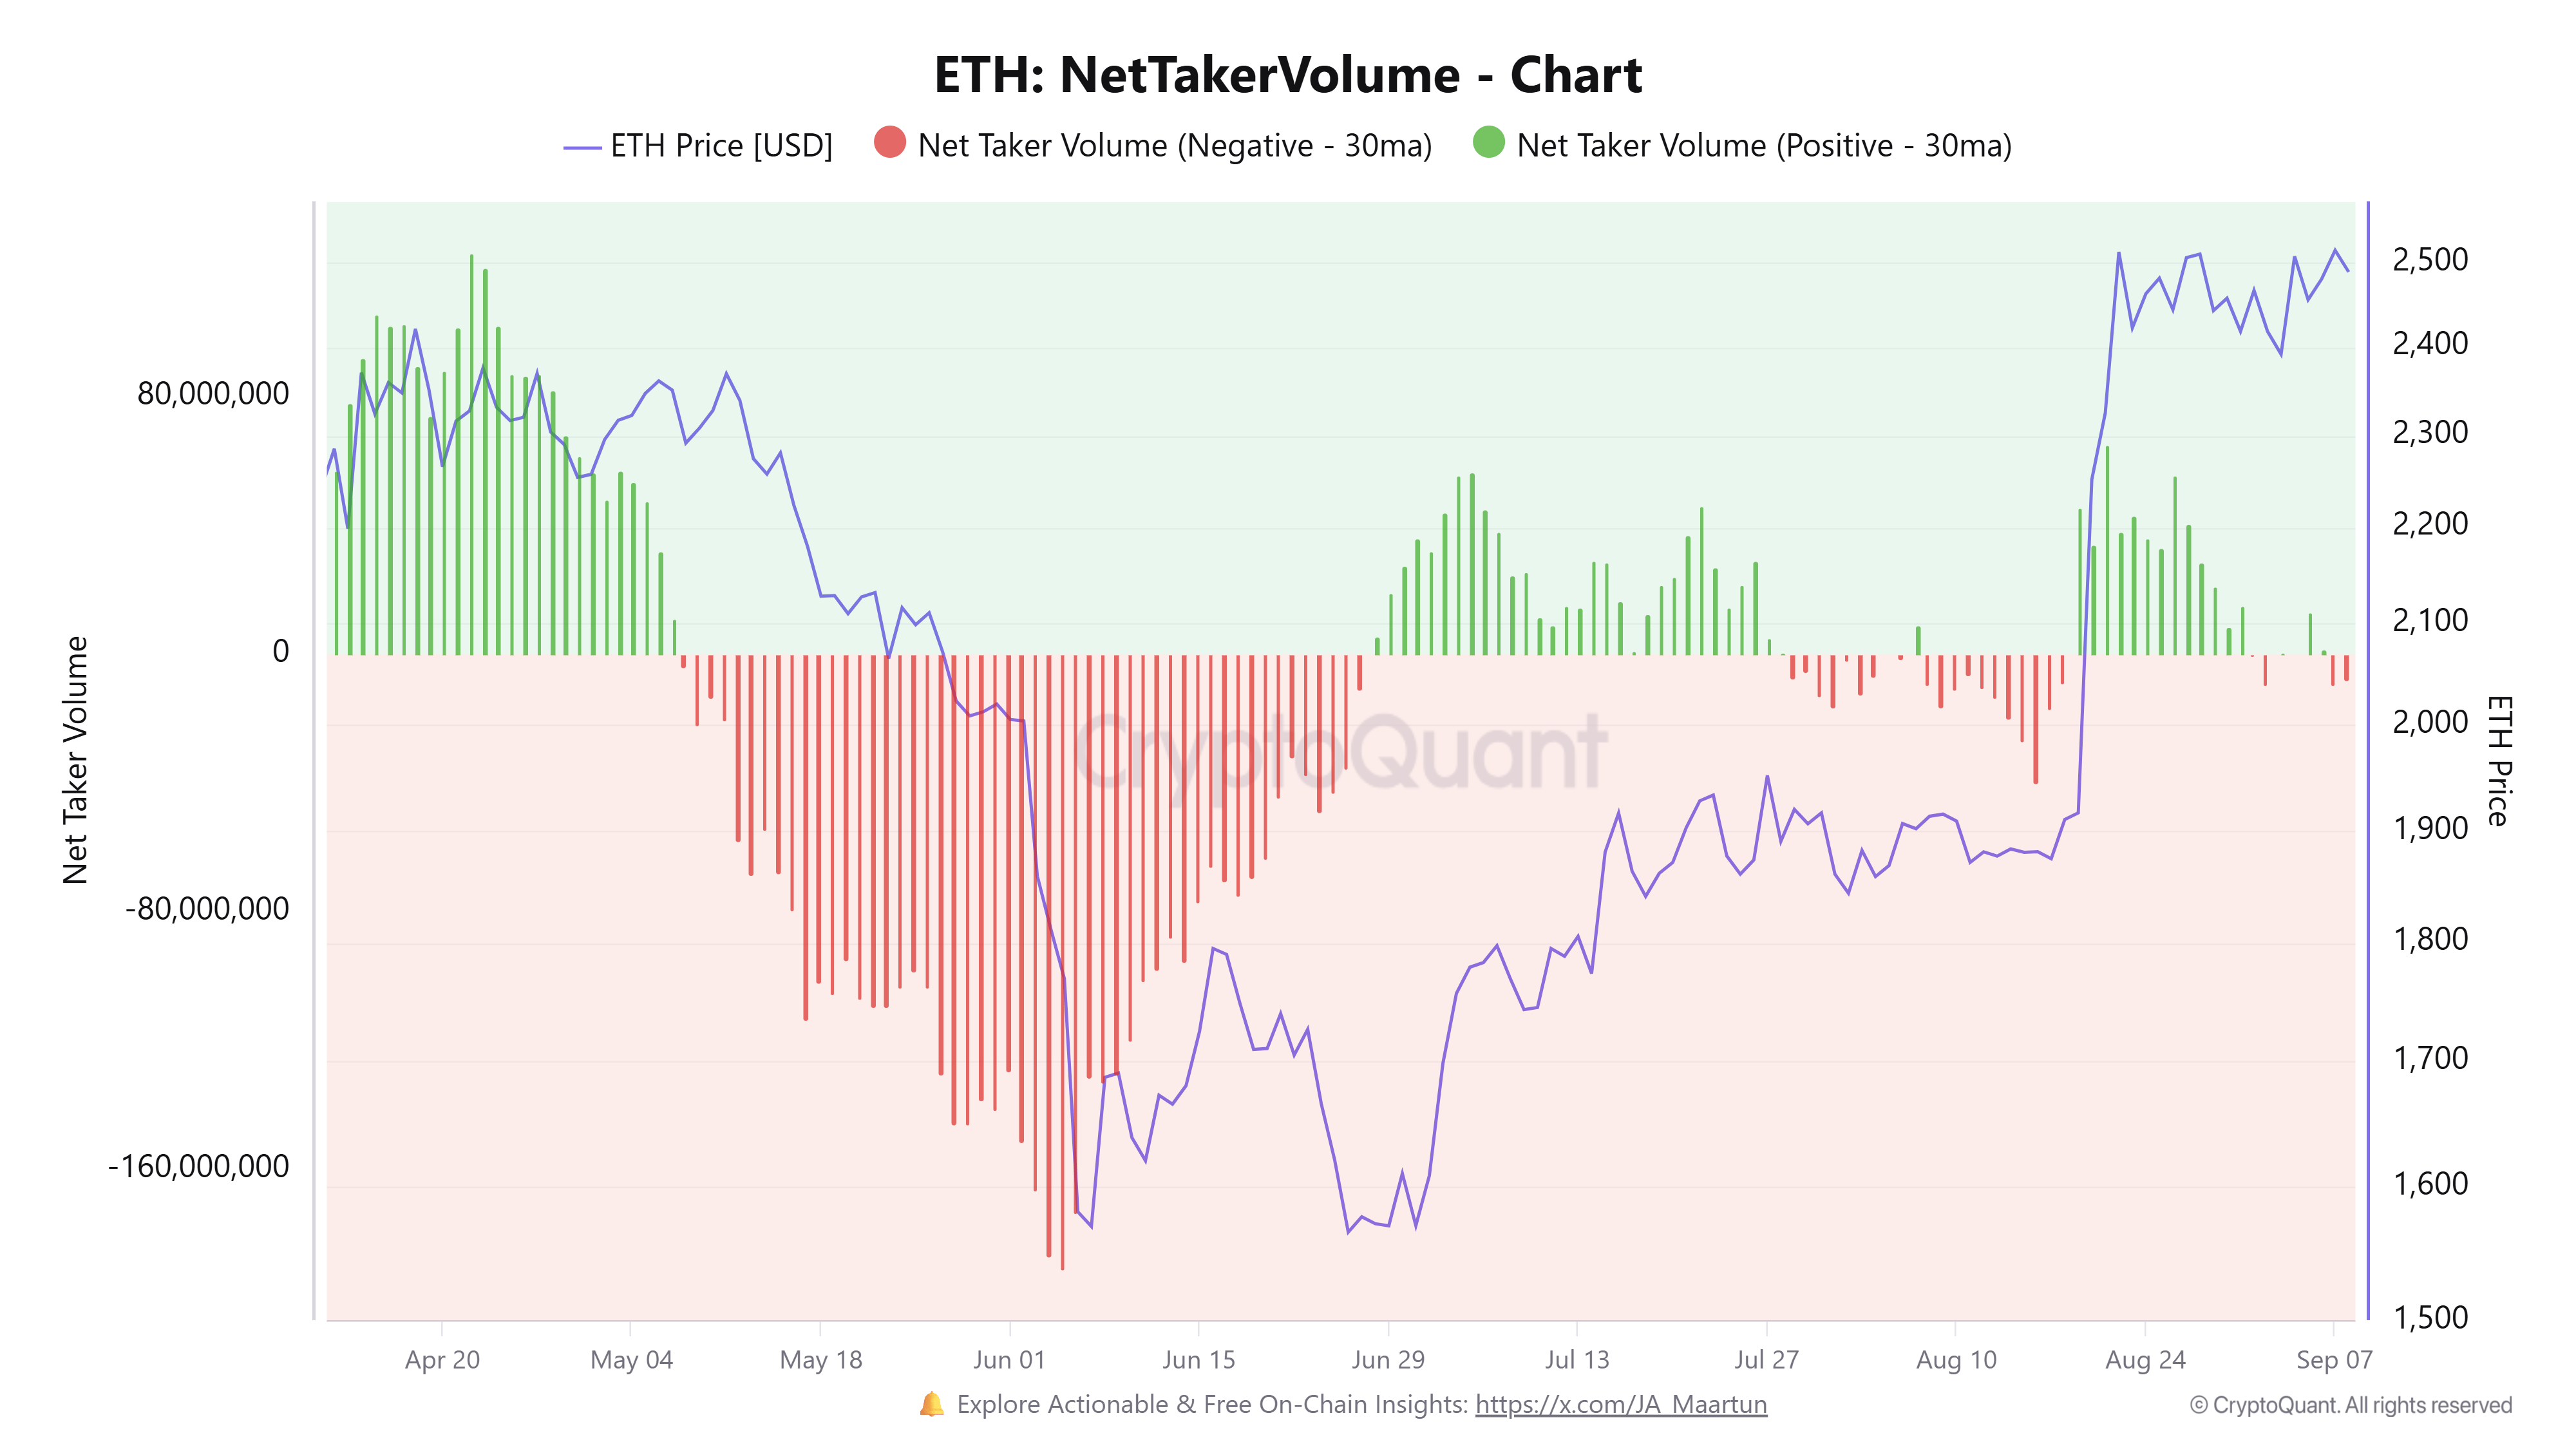
Net Taker Volume in perpetual futures has flashed negative over recent days, showing bulls and bears are evenly matched in derivatives markets.
On-chain data shows ETH withdrawals from exchanges have slightly outpaced deposits over the past week. That points to mild buying pressure in spot markets, though the margin is small.

US spot ETH ETFs started the week with $24.3 million in net outflows on Tuesday, reducing one source of institutional demand during this consolidation period.
Key Levels to Watch
Analyst Jules flagged $2,478–$2,485 as the key short-term pivot, noting that repeated bounces from the zone show active demand. Jules stated: “Both sides have clean levels. The longer this squeeze lasts, the more the eventual break will matter.” Jules added that a strong close above $2,525–$2,535 could open a path toward $2,580–$2,600.
$ETH is moving towards the $2,550 resistance again.
One strong weekly close above this could push Ethereum to $3,000. pic.twitter.com/METZhCuZTK
— Ted (@TedPillows) September 9, 2026
Analyst Ted Pillows identified $2,550 as a major resistance level, saying a strong weekly close above it could support a move toward $3,000.
$ETH Sitting right above its break out point and has been chopping around in a tiny range for the past 3 weeks.
This will eventually lead to a large move again from this compression, similar to the initial breakout that got us here.
For the bulls it is critical to hold that… pic.twitter.com/ifUIButY4L
— Daan Crypto Trades (@DaanCrypto) September 9, 2026
Crypto trader Daan Crypto Trades (@DaanCrypto) posted on X that $ETH has been “chopping around in a tiny range for the past 3 weeks” and that this compression would eventually lead to a large move. He highlighted $2,350 as critical support for bulls and $2,550 as the overhead cap to break.
The CoinGlass liquidation heatmap shows large short liquidation clusters between $2,520 and $2,550, with downside liquidity concentrated near $2,430 and a larger band around $2,355–$2,365.
ETH saw $30.6 million in total liquidations over the past 24 hours, with $15.6 million coming from short positions.