




TLDR
- Solana slipped 1.7% but held above key support levels while Bitcoin and Ethereum ETFs saw outflows
- U.S.-listed spot Solana ETFs pulled in $5.75 million in net inflows during the same period
- Weekly non-vote transactions topped 1 billion for the first time in Solana’s history
- Weekly active addresses surged from 16.8 million to 29.7 million in just two weeks
- Solana ranked #1 across all Layer 1 and Layer 2 chains in DApp revenue and DEX volume
Solana (SOL) dipped 1.7% to around $79–$80 during the latest reporting period, following Bitcoin’s 1.65% drop. The total crypto market cap fell 1.47% to $2.14 trillion. Despite the price slip, SOL held above key support.
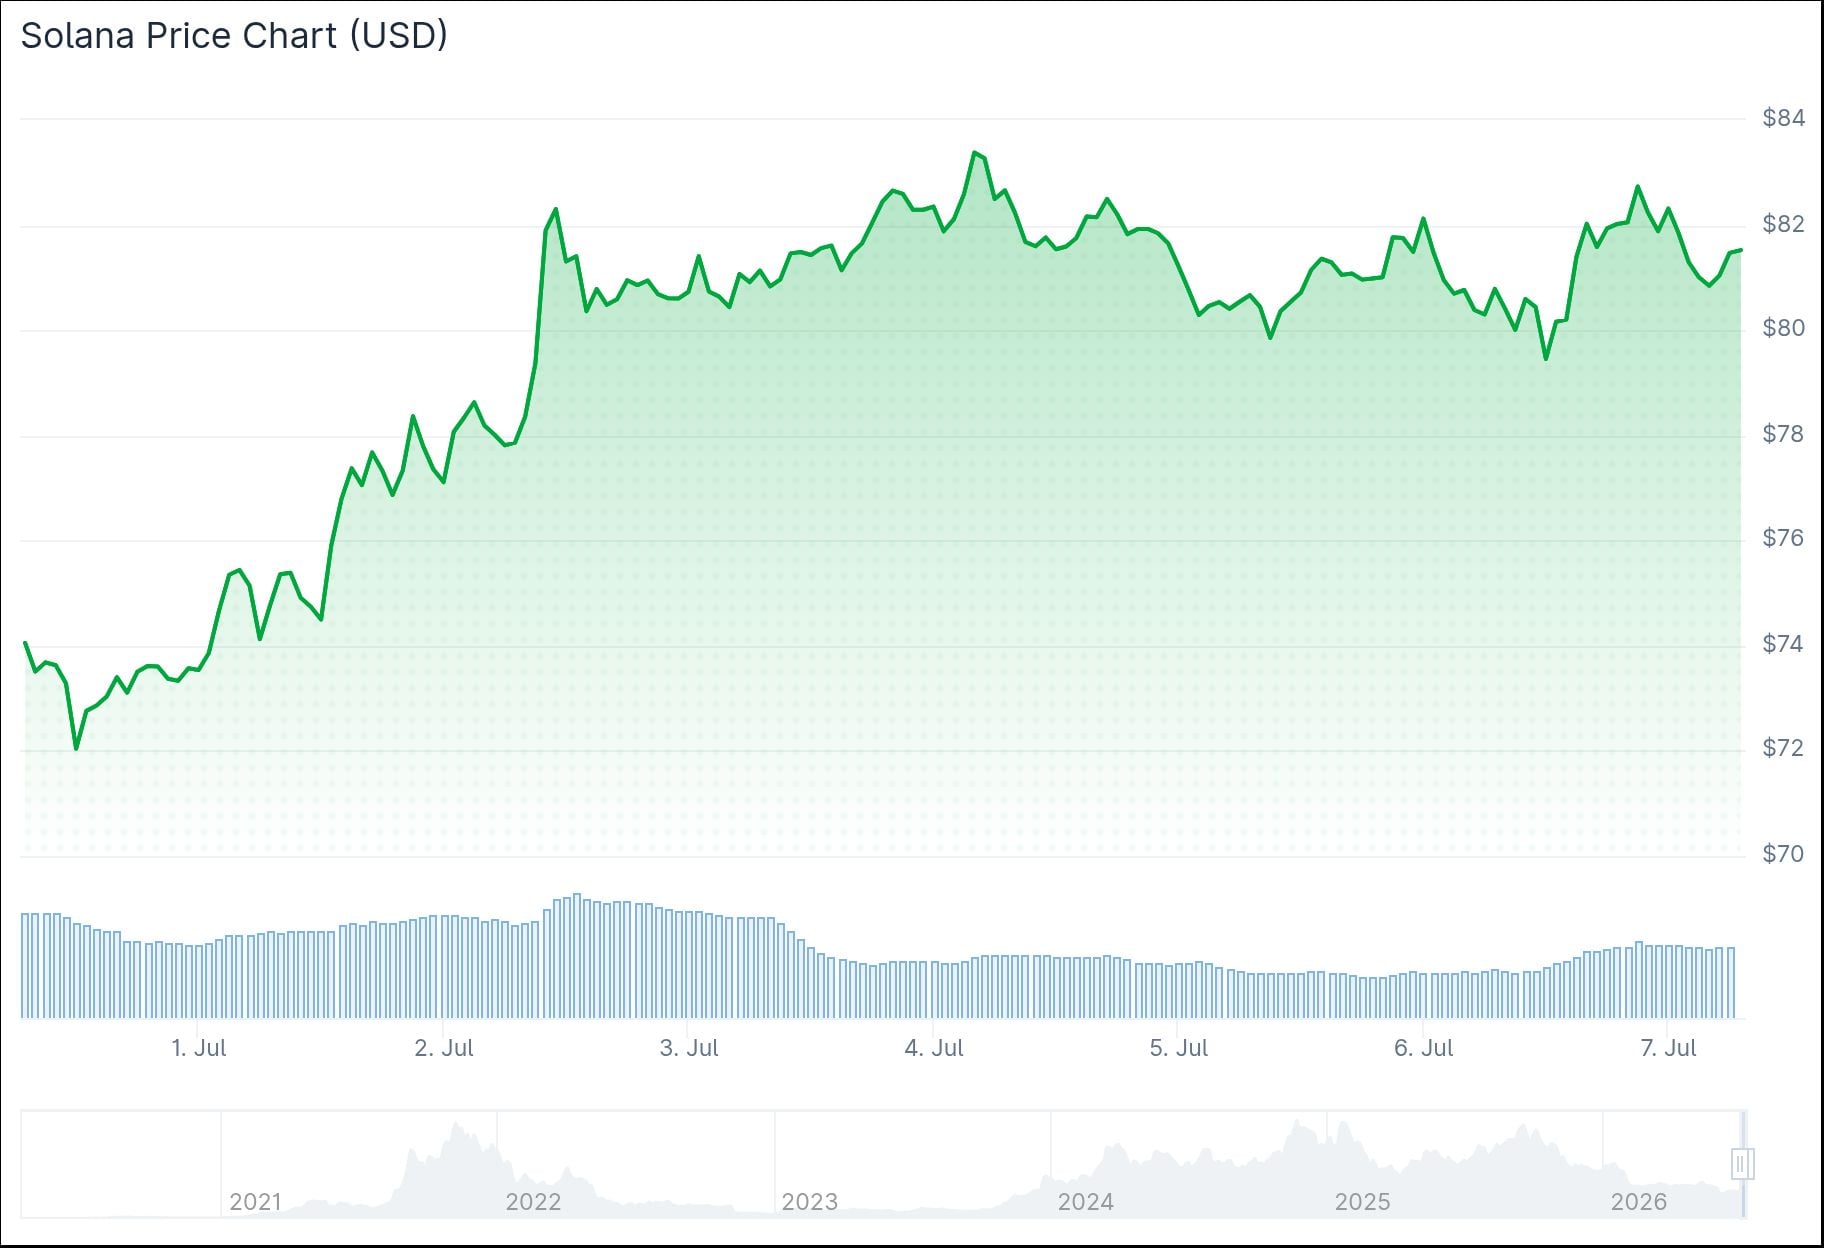
The token is still roughly 73% below its all-time high of $294.33, set on January 19, 2025.
What stood out this week was how Solana’s ETF flows diverged from the rest of the market. Spot Bitcoin ETFs posted $527 million in net outflows between June 29 and July 2 — their eighth straight week of withdrawals. Spot Ethereum ETFs lost $13.67 million during the same stretch.
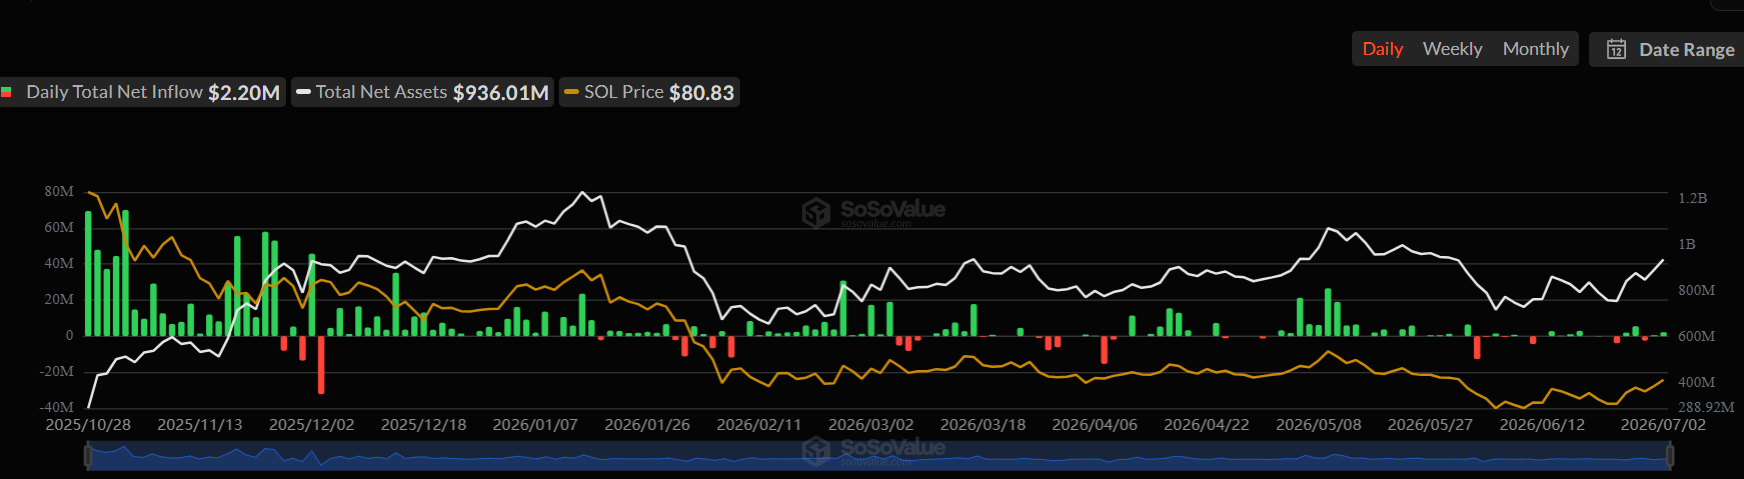
Solana went the other way. U.S.-listed spot SOL ETFs recorded $5.75 million in net inflows. XRP ETFs added $17.19 million, and HYPE ETFs brought in $4.32 million.
On-Chain Activity Breaks Records
Network usage hit a new milestone last week. SolanaFloor confirmed that weekly non-vote transactions crossed one billion for the first time. These are transactions from real users, apps, and traders — not validator votes — making this a meaningful measure of genuine activity.
🚨BREAKING: @Solana’s weekly transaction activity hit a new all-time high, with 1B+ non-vote transactions processed last week. pic.twitter.com/x3GBDFHO6Q
— SolanaFloor (@SolanaFloor) July 6, 2026
Analyst Michaël van de Poppe weighed in on Solana’s price setup. He said the theory on $SOL remains unchanged — the price is breaking back into the range and a slight pullback before an upward continuation is expected. He said he wants to see $75–$77 hold as support, and if it does, he sees a move toward $100 and possibly $120 over the coming weeks and months.

The theory on $SOL remains the same.
It’s breaking back into the range, and having a slight pullback before upwards continuation is on the board.
I’d want to see $75-77 hold as support.
If that holds, we’ll be seeing a continuation towards $100 and most likely $120 over the… pic.twitter.com/aIuDdIjnpC
— Michaël van de Poppe (@CryptoMichNL) July 5, 2026
Weekly active addresses also jumped, climbing from 16.8 million to 29.7 million in two weeks — a rise of roughly 76.8%. Solana also ranked first among all Layer 1 and Layer 2 chains in both 24-hour and seven-day DApp revenue, and led DEX volume across both timeframes. Polygon, Ethereum, Base, BNB Chain, and Hyperliquid followed.
Price Sits Between $80 Support and $85 Resistance
In terms of trading volume, Solana ranked second globally for the second straight week, processing $12.25 billion across centralized and decentralized exchanges. That beat Bybit’s $10.57 billion, though Binance held the top spot overall.
On the daily chart, SOL sits above its 20-, 50-, and 100-day moving averages. The MACD remains in bullish territory, though momentum has eased since last week’s 15% rally.
The RSI on the four-hour chart sat near 51–53, showing neutral momentum. The Supertrend indicator held below price near $78.30. Immediate resistance sits around $84–$85, while support levels at $78 and $76 are the key zones to watch.
The latest price at time of writing was approximately $80.34.