
Gold has fallen into bear-market territory after giving up its gains for the year, even as US spot Bitcoin exchange-traded funds (ETFs) continued to attract fresh money, pushing the two assets onto sharply different paths.
Spot gold traded near $4,388 an ounce on March 23, according to goldprice.org, down about 22% from its Jan. 29 record of $5,594.82. The decline accelerated after the latest Middle East conflict began on Feb. 28. Since then, gold has dropped about 17%, reversing the advance that had carried it higher in the opening weeks of 2026.
At the same time, institutional money continued to flow into the US spot Bitcoin ETF market. Data from Farside Investors show the funds took in about $2.42 billion of net inflows across the four calendar weeks ended March 20.
The divergence has drawn attention across macro and digital-asset markets because gold and Bitcoin are often discussed in similar terms during periods shaped by inflation concerns, currency dilution, and geopolitical stress.
Over the past month, however, investors treated them very differently. Gold faced liquidation pressure as cash demand rose and rate expectations stayed elevated. Bitcoin, through the ETF structure, continued to draw allocations through brokerage and advisory channels.
The move also stands out because gold had entered 2026 with strong momentum. Its retreat now meets the widely used market definition of a bear market: a decline of 20% or more from a recent peak. Bitcoin, by contrast, has held up well enough to keep ETF buyers engaged through the same stretch of volatility.
Gold gives back early-year gains as rates stay high and investors raise cash
Gold’s decline has unfolded against a macro backdrop that has become less supportive for assets that tend to benefit from lower yields and a softer dollar.
The Federal Reserve held interest rates steady in March and projected the benchmark rate at 3.4% at the end of 2026, while core personal consumption expenditures inflation remained at 2.7%. That combination reinforced the view that policy may stay restrictive longer than investors expected earlier this year.
For bullion, the effect is direct. Higher rates raise the opportunity cost of holding a non-yielding asset. A firmer dollar adds pressure by making gold more expensive for buyers using other currencies.
Those forces intensified as investors also sought cash and liquidity after the Middle East shock forced a repricing of growth, inflation, and energy expectations.
Fund-flow data captured the shift quickly. LSEG Lipper data showed global gold and precious-metals funds posted about $5.19 billion in weekly net outflows through March 18, the largest weekly withdrawal since at least August 2018. In the same week, money market funds took in $32.57 billion.
That rotation suggests investors moved toward liquidity and away from positions that had benefited from earlier inflation and geopolitical hedging demand.
Gold’s decline, therefore, fits into a broader portfolio adjustment in which preserving flexibility became more important as markets reassessed the likely path of monetary policy and commodity prices.
The selloff also arrived after a period in which gold’s long-term support looked firm. Central-bank demand had helped underpin the bullion market through 2025, and the reserve case remained intact as 2026 began.
The recent drop shows how forcefully short-term macro conditions can overwhelm that structural support over a matter of weeks.
Additional fund data point in the same direction. The largest US gold-backed ETF, SPDR Gold Shares (GLD), recorded $7.07 billion in outflows in March, according to market data.
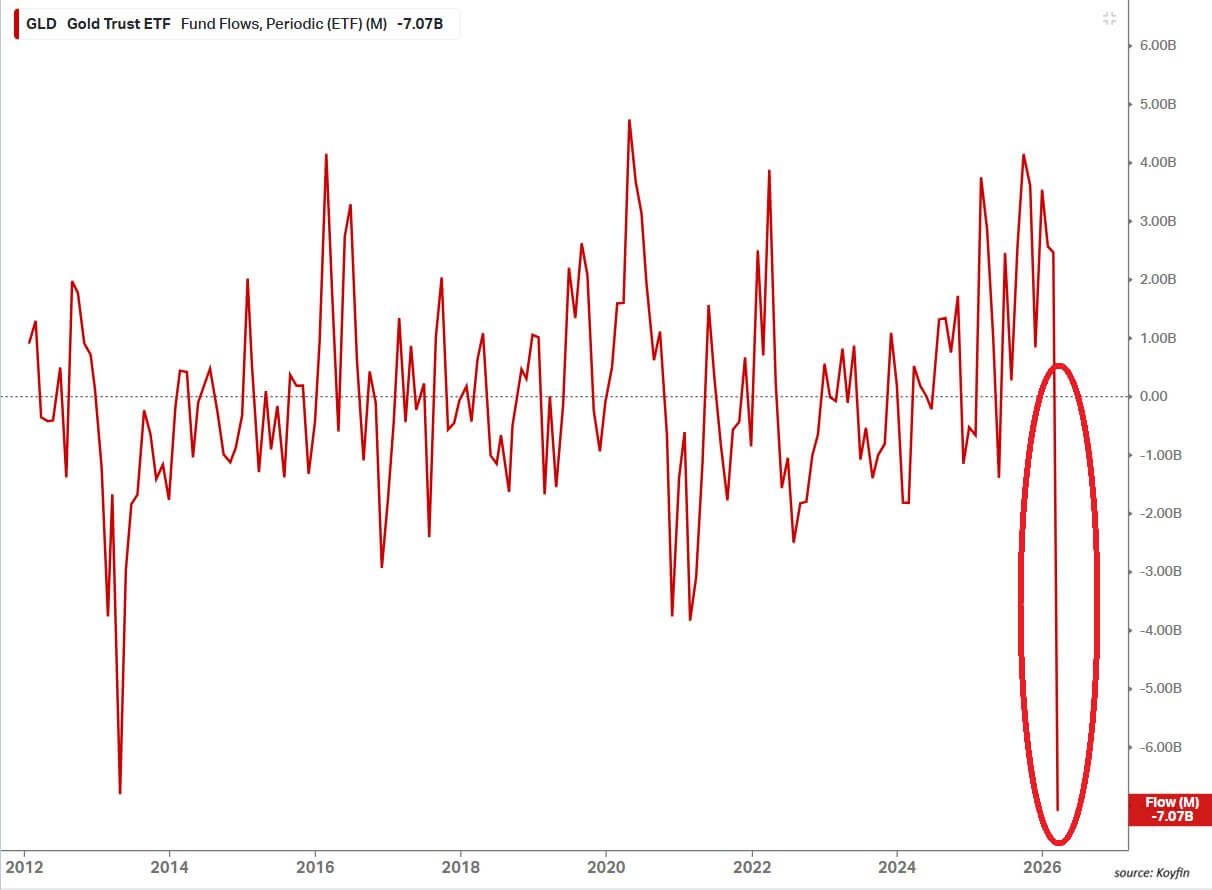
That exceeded the previous monthly record withdrawal of $6.8 billion in April 2013. The pace of redemption reflected the speed of the reversal in investor positioning after gold’s run higher earlier in the year.
By the standard used in financial markets, a 22% decline from a January peak marks a clear transition into bear-market territory.
Gold’s drop, therefore, represents more than a routine pullback after a rally. It signals a broad withdrawal from a trade that had been supported by reserve accumulation, geopolitical hedging, and concern over inflation persistence.
Bitcoin funds extend their strongest inflow streak of 2026
While gold was losing ground, US spot Bitcoin exchange-traded funds posted their strongest inflow streak this year.
Farside data show the 12 US spot Bitcoin funds recorded four consecutive weeks of net inflows, with more than $2 billion added during that period. It is the longest run of 2026 and the strongest since August and September 2025, when the funds absorbed more than $3.8 billion.
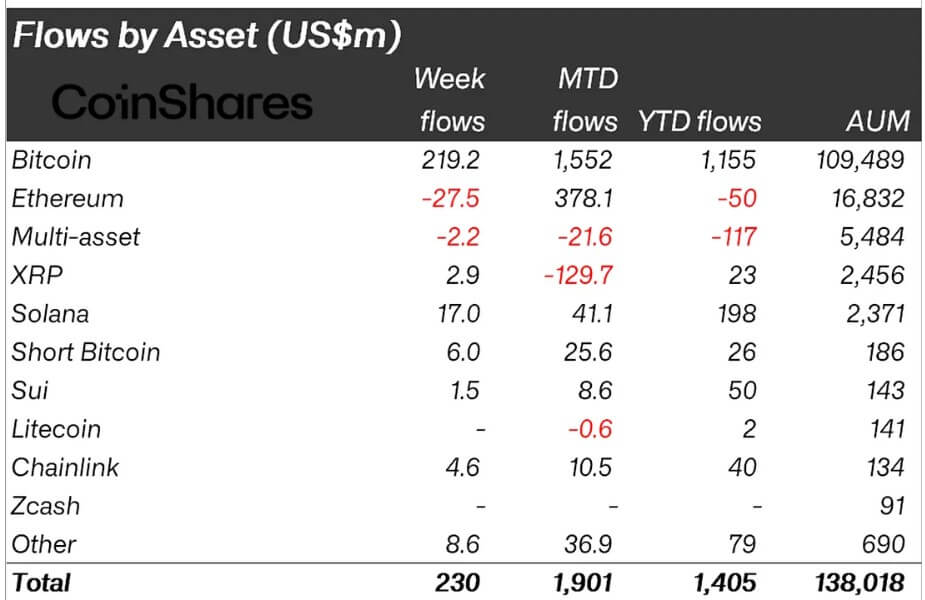
CoinShares data show a similar trend globally. The firm said Bitcoin exchange-traded products have registered $1.5 billion in inflows so far this month.
Those inflows came during a period that included war risk, shifting expectations for US interest rates, and renewed volatility across commodities. Even in that backdrop, institutions continued to use the ETF wrapper to add or maintain Bitcoin exposure, while gold funds were experiencing large redemptions.
Last week, Bitwise said Bitcoin and other major cryptoassets have outperformed US equities and gold since the beginning of March.
The asset manager said the move could point to the early stages of a rotation, while also cautioning that recent price action may reflect temporary volatility or isolated liquidity events. Bitwise added that gold has historically led Bitcoin by four to seven months.
State Street Global Advisors outlined the volatility gap in its March gold monitor. Over a trailing 10-year period, rolling 30-day volatility for Bitcoin averaged about 52.0, compared with 13.6 for gold.
From January 2016 through February 2026, Bitcoin recorded 30 months with losses greater than 8%, while gold recorded one such month, according to the report.
Those figures show the type of exposure investors were taking through Bitcoin ETFs. Buyers were accepting wider swings and deeper drawdowns in return for access to an asset some investors view as a hedge against fiat dilution and policy risk.
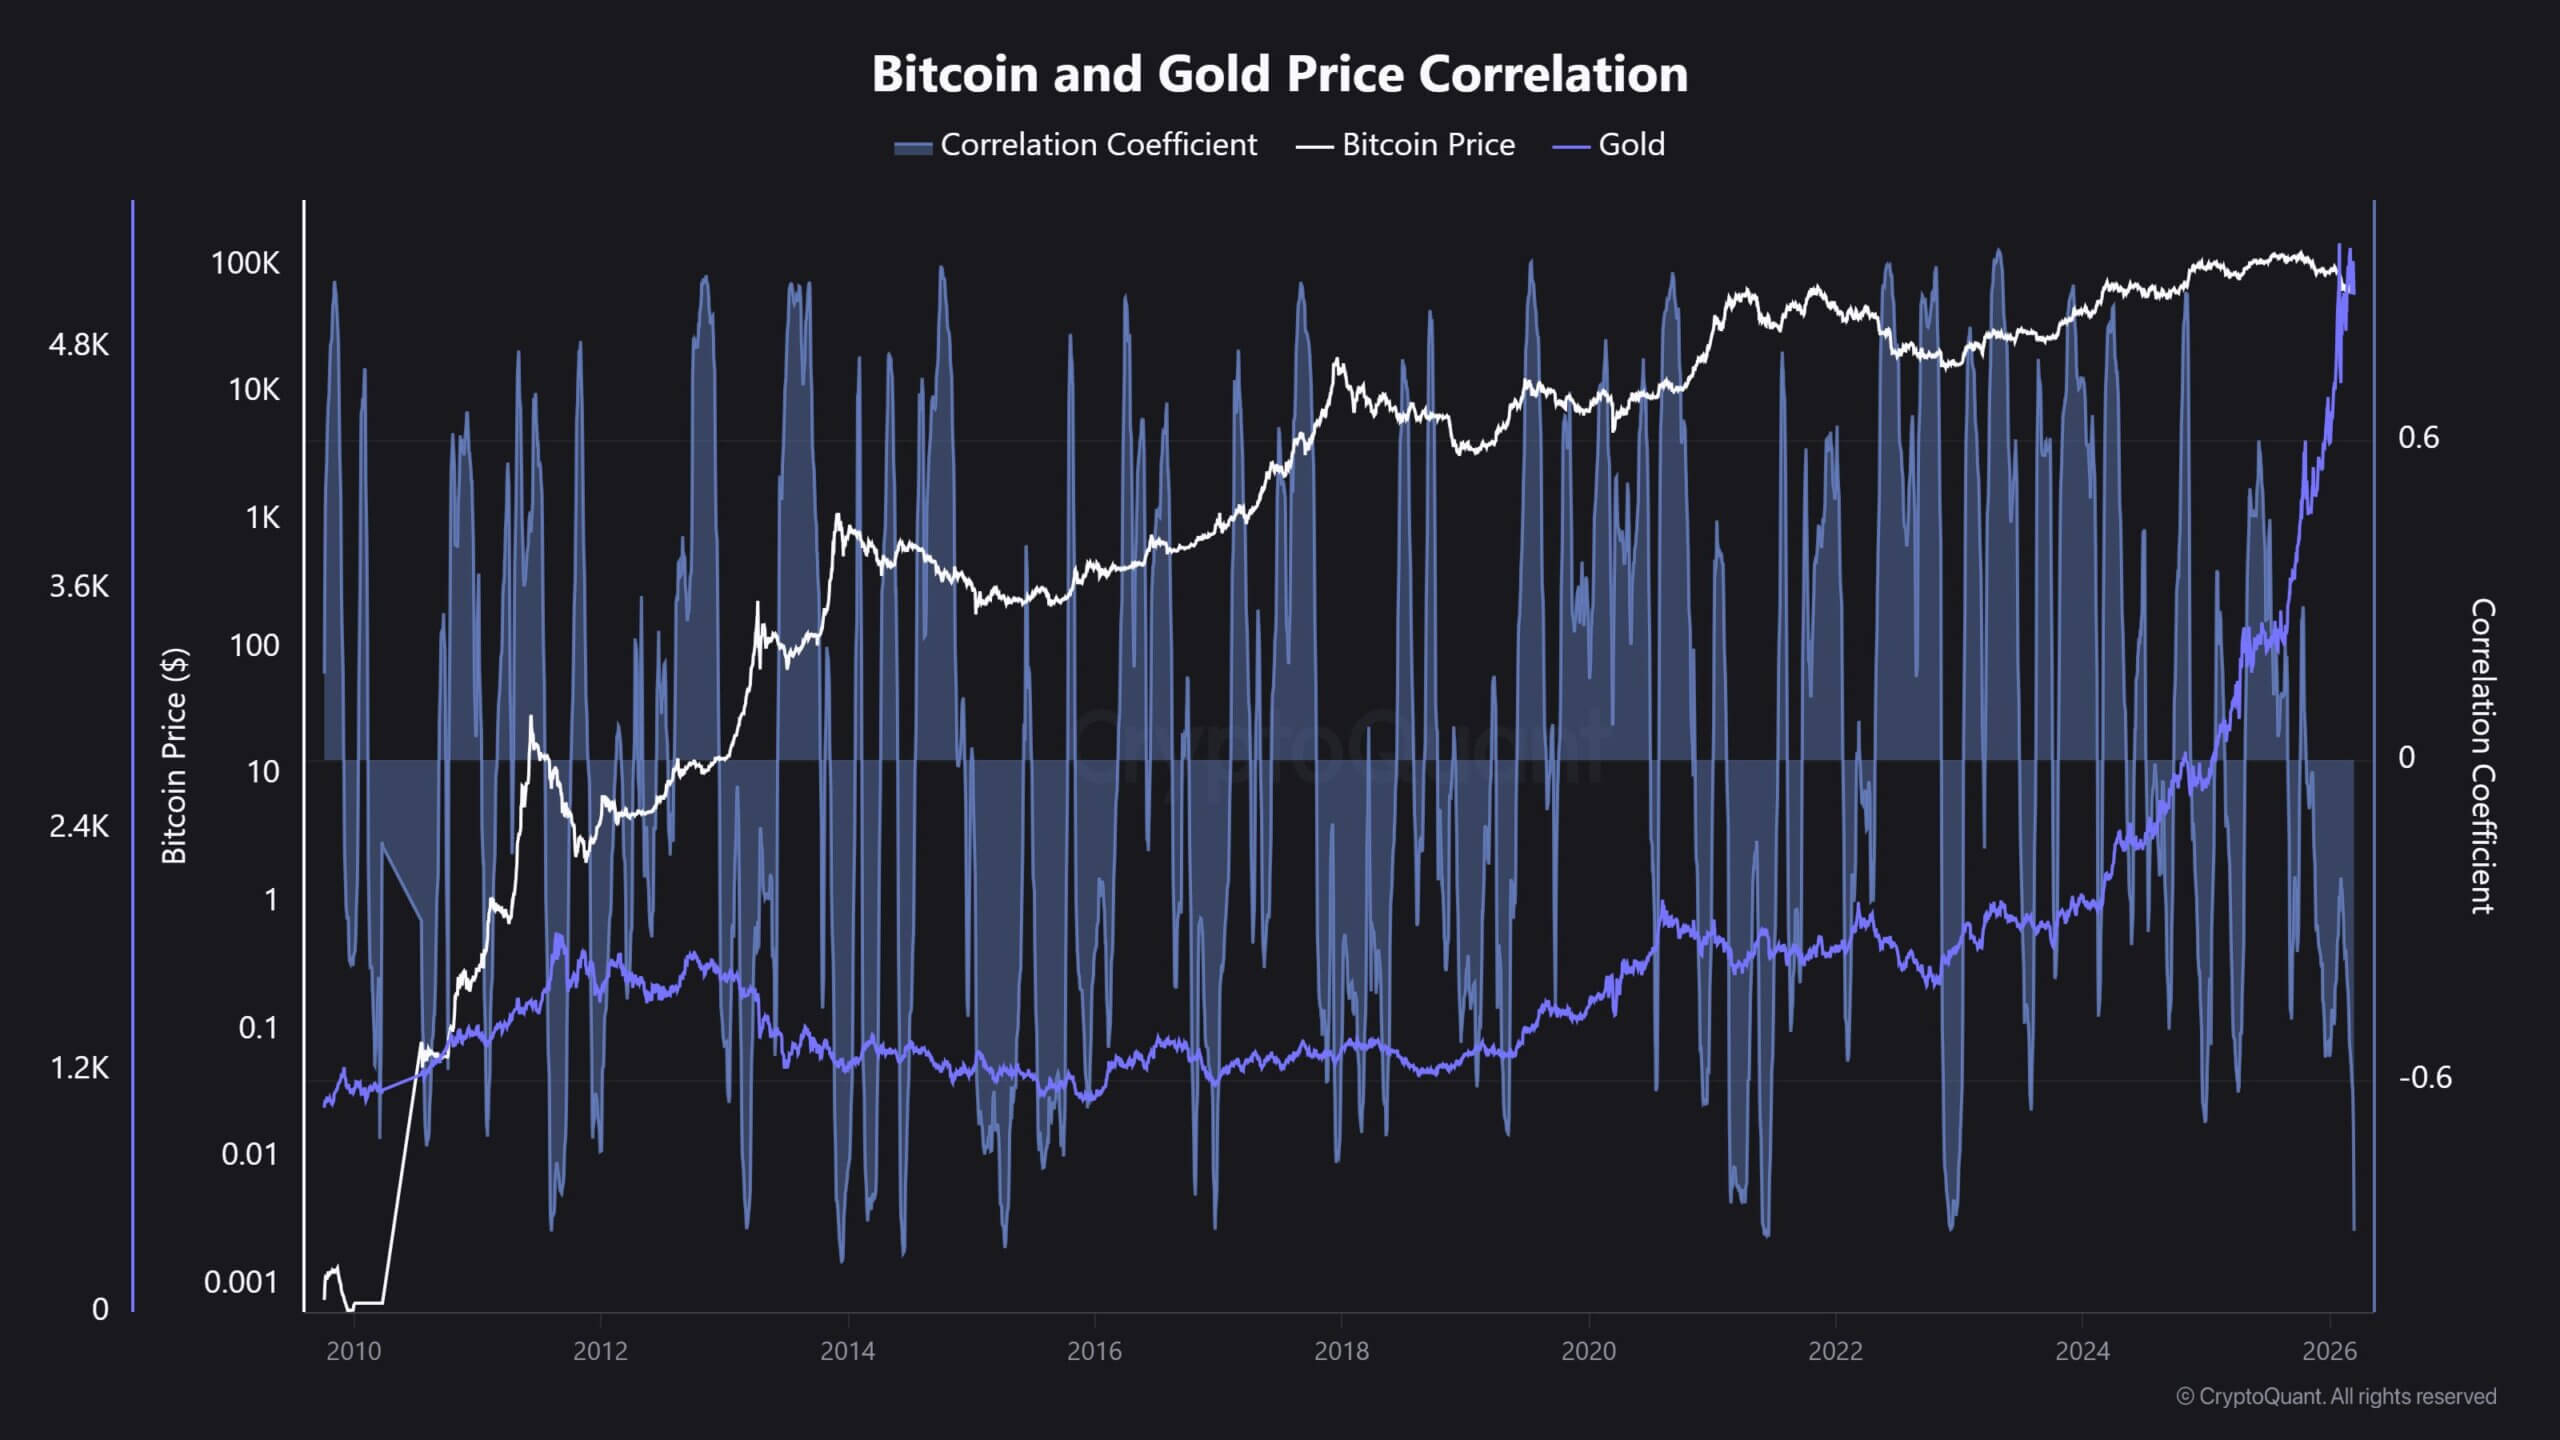
CryptoQuant data also show how far the two assets have diverged. The firm said Bitcoin-to-gold correlation fell to minus 0.88, the lowest reading since November 2022, indicating the two assets were moving in opposite directions with unusual force over the measured period.
Oil and rates may shape the next phase
Gold’s longer-term support has not disappeared, even after the March selloff, and that is part of what makes the current split between gold and Bitcoin more closely watched.
The World Gold Council said total gold demand, including over-the-counter activity, exceeded 5,000 metric tons for the first time in 2025. Gold ETF holdings rose by 801 tons last year, and central banks bought 863 tons. In February 2026 alone, physically backed gold ETFs took in $5.3 billion globally.
Those figures show official-sector buying and long-duration investment demand remained strong heading into this quarter.
The current drawdown, therefore, leaves investors balancing two forces: short-term macro pressure from rates, dollar strength, and liquidity demand, and a structural reserve bid that remained in place through last year and into early 2026.
Oil prices may play a central role in how that balance develops. Several banks raised their 2026 Brent forecasts after the latest Middle East shock. Bank of America lifted its view to $77.50 a barrel, while Standard Chartered raised its forecast to $85.50. Bank of America also outlined an upside path toward $130 in the event of a prolonged supply disruption.
Higher oil prices would feed inflation expectations and could keep the Federal Reserve cautious for longer. That would affect gold and Bitcoin through different channels.
Gold would continue to face pressure from elevated real yields and dollar strength if policy remains restrictive. Bitcoin would remain tied more closely to liquidity conditions, institutional risk appetite, and the willingness of ETF buyers to keep adding exposure through regulated products.
For now, the clearest market signal is the split itself. Gold, long treated as a traditional store-of-value asset during periods of stress, has entered a bear market after falling more than 20% from its January high. Bitcoin, an asset more commonly associated with larger price swings, has continued to gather ETF inflows through the same period.