
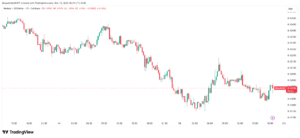
Hedera’s native token HBAR dropped to around $0.11 over the weekend after breaking below the $0.1235 support level on Dec. 14, ending several weeks of sideways trading and shifting the short-term structure lower. The breakdown triggered heavier selling and marked a clear exit from the prior consolidation range, putting HBAR among the weaker large-cap altcoins during the period.
Macro Headwinds Add Pressure to Altcoins
Broader market conditions have remained unfavorable for risk assets. Despite a rate cut on Dec. 10, HBAR declined about 8%, as investors interpreted the move as cautious. Policymakers signaled a slower pace of easing in 2026, dampening expectations for sustained liquidity support.
Bitcoin’s drop below $90,000 over the weekend further weighed on sentiment across the altcoin market. At the same time, rising real yields added pressure. The U.S. 10-year Treasury yield climbed 12 basis points, reducing appetite for speculative assets such as smaller-cap cryptocurrencies, including HBAR.
You May Also Like: Anchorage Digital Supports HBAR Custody as Hedera Passes 9M Users
While price action remains under pressure, on-chain data shows large holders increased exposure during the decline. Data shows that Hedera whales accumulated 3.42 billion HBAR in less than two days, suggesting buying activity from deep-pocketed participants during the sell-off.

Cumulative HBAR trading volume has also climbed to $327 billion, according to DefiLlama data shared by Marc Shawn Brown. The figure points to sustained long-term activity around the Hedera network, even as short-term price momentum turns negative.
HBAR Technical Structure Turns Bearish After Range Breakdown
From a technical perspective, momentum remains tilted lower. Analyst More Crypto Online described HBAR as a “falling knife,” noting that price action continues to unfold within a downside wave structure, with potential for a move toward $0.1049.

The break below $0.1235, a level that previously acted as repeated support, invalidated the earlier range. Trading volume surged to 166 million HBAR, roughly 175% above average, indicating conviction selling rather than a low-liquidity drift.
Momentum indicators continue to reflect weakness. The RSI (7) stands at 23.41, placing HBAR in deeply oversold territory. However, there are no confirmed signals of a bullish reversal, suggesting sellers still control the near-term trend.
The next support level sits near $0.1176, which marks the June 2025 low. A sustained move below that level would increase the risk of further downside.
For downside pressure to ease, HBAR would need to reclaim $0.1235 and hold above it, restoring the former support as resistance turned support. Until then, HBAR price action remains vulnerable to continued volatility amid fragile market conditions.