 Hits Rare Weekly RSI Level, Echoing Past Market St…")
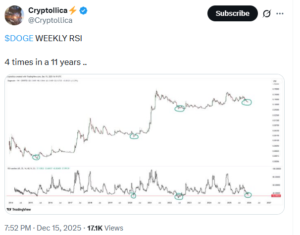
Dogecoin (DOGE) continued to trade under pressure this week as its weekly Relative Strength Index (RSI) dropped to a level that has appeared only a handful of times over the asset’s trading history. The signal has historically emerged during periods of extended selling rather than short-term volatility.
Crypto analyst Cryptollica noted that DOGE’s weekly RSI has fallen to roughly 33.6, a zone that has appeared only four times over the past 11 years. Unlike short-term RSI signals that can fluctuate quickly, weekly readings tend to reflect sustained market conditions and broader trend exhaustion.
At the time of writing, Dogecoin was trading near $0.129, down by mid-single digits on the day.
Why a Weekly RSI Matters More Than Short-Term Signals
The Relative Strength Index measures momentum by comparing recent gains and losses. On higher timeframes, such as the weekly chart, RSI is often used to gauge whether selling pressure has persisted long enough to push the market into an oversold state.
In DOGE’s case, a weekly RSI near the low-30s suggests that sellers have controlled price action for an extended period. This differs from brief intraday dips, which can reverse quickly without affecting the broader trend.
However, an oversold weekly RSI does not indicate an immediate price bottom. Historically, such signals have appeared early during periods of stress, with price stabilization or recovery taking place much later.
Further Reading: Dogecoin (DOGE) Falls to Yearly Lows Despite Surge in ETF Filings
How DOGE Behaved During Past RSI Extremes
The previous instances of Dogecoin’s weekly RSI entering this zone occurred during distinct market shocks.
In May 2015, DOGE traded at fractions of a cent amid weak liquidity and declining community engagement. The market remained subdued for an extended period before eventually participating in the 2017–2018 crypto cycle.
A similar signal appeared in March 2020, when global markets sold off sharply during the early stages of the COVID-19 crisis. DOGE traded near $0.0015 at the time. While price did not recover immediately, the following year saw a sharp repricing during the broader crypto bull market.
The most recent historical occurrence came in June 2022, during the height of the crypto bear market. DOGE traded near $0.053, before later recovering in stages alongside improving market conditions and renewed speculative interest in meme-linked assets.
These examples show that the RSI signal has often aligned with periods of heavy downside pressure, but the timing of any recovery has varied significantly.
Current Context Differs From Past Cycles
Unlike earlier cycles, the current market backdrop includes factors that did not exist during prior RSI extremes. DOGE is now actively traded across spot, futures, and exchange-traded products, with participation split between retail traders and derivatives markets.
Recent sessions have shown zero net inflows into U.S. spot Dogecoin ETFs, even as futures activity and short-term trading volume increased. This suggests that current price behavior is being shaped more by speculative positioning than by long-term capital allocation.

At the same time, broader crypto sentiment remains mixed, with risk appetite uneven across altcoins.
A weekly RSI near historical lows can highlight shifting risk-reward dynamics, but it does not predict direction on its own. Oversold conditions can persist for weeks or months if selling pressure continues or if broader market conditions remain weak.
For DOGE, the signal points to elevated stress in the market rather than a confirmed reversal. Any meaningful shift would likely require price stabilization, improving market structure, and confirmation from volume or capital flows.