
KuCoin enabled deposits and withdrawals for native USDC on the XDC Network. Users can now select “USDC (XDC)” in Funding Accounts to move stablecoin directly on XDC. The exchange framed the integration as live and production-ready.
This adds a fiat-stable settlement path for XDC users without bridge hops. Consequently, custody flows can route stablecoin on and off the network through KuCoin’s standard interface. The platform’s news post and social feed both carried the update.
Moreover, native USDC support aligns with XDC’s trade-finance positioning and ISO 20022-aligned messaging. It also gives market participants a direct option to test settlement speeds and fees on XDC using a widely held stablecoin.
$900K grant backs GoodDollar’s UBI expansion
XDC Foundation confirmed a $900,000 grant to GoodDollar to scale blockchain-based universal basic income infrastructure. The program targets growth across more than 210 countries and cites a user base above 910,000. Foundation channels and ecosystem coverage carried the figures.

The grant seeks to harden core systems and expand distribution rather than chase trading catalysts. Therefore, it places social-impact rails alongside enterprise-finance efforts on the same network. Project write-ups emphasize infrastructure and reach.
Additionally, third-party posts and press recaps mirror the numbers announced by the foundation. They describe the move as a scale-up for on-chain UBI rather than a token event.
New York sessions set for Oct. 21; Dubai side event ran Oct. 16
XDC’s public events page lists T³ — Tokenization, Trade & Treasury in New York on Tuesday, Oct. 21. The schedule shows a full-day meetup and an evening mixer for institutional DeFi, treasury, and private-credit topics, with live registration links.
Organizer posts on X and Instagram promote the New York agenda to financial and enterprise audiences. Therefore, participants can register for both the day program and the networking session the same evening.

Earlier this week, the Dubai side event “DePIN x XDC” ran on Oct. 16 at Emirates Financial Towers during GITEX week, featuring ecosystem projects. Community notices and platform posts recorded the time, venue, and contributors.
The XDC/USD chart shows a falling wedge that formed from late July to mid-October. A falling wedge has two downward, converging trendlines. It often signals bullish reversal when price breaks up through the top line as momentum fades.
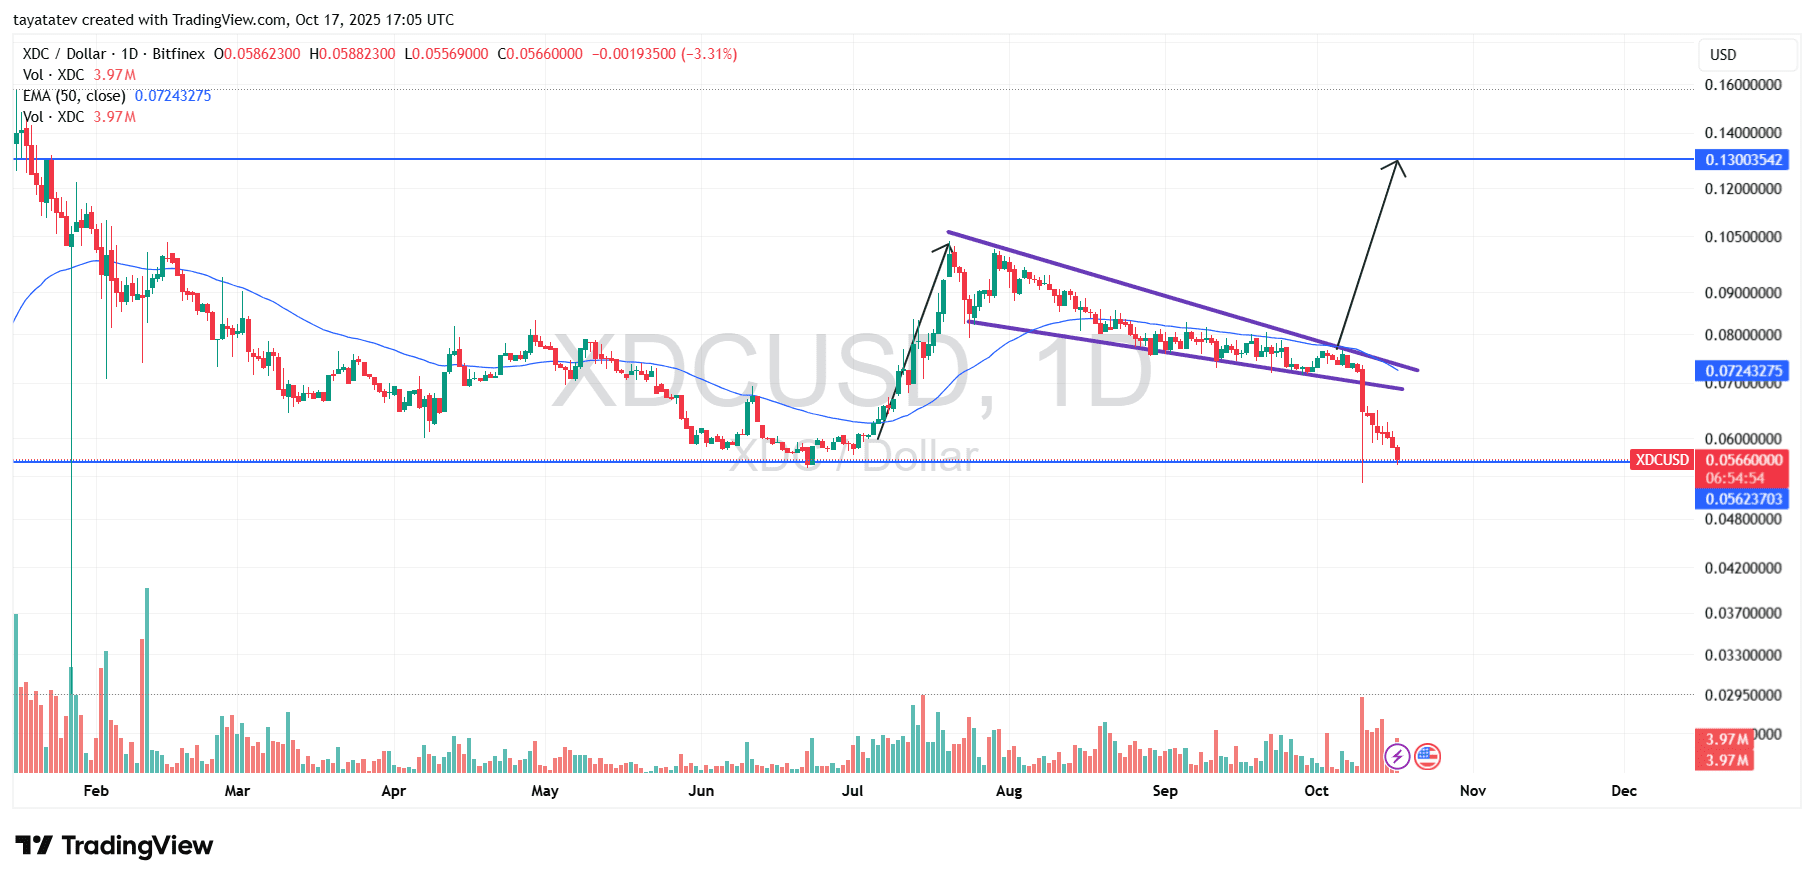
However, this wedge broke down through its lower boundary instead. Sellers pushed price below the trendline in mid-October, invalidating the classic bullish read. The 50-day EMA sits above, near ~$0.072, and now acts as overhead resistance on any rebound.
The breakdown coincided with U.S. tariff headlines on China.President Trump announced an additional 100% tariff earlier this month and later called those levels “not sustainable,” keeping trade risk in focus. That macro shock lined up with the technical failure.
Support test, bounce or extension lower
Price now sits on a marked support zone around ~$0.056. This level capped the June-July base and appears again as a horizontal line on the chart. Buyers often defend prior bases on first touch, so a reflex bounce is plausible from here.
If the bounce develops, watch for a move back toward the broken wedge trendline and the 50-day EMA near ~$0.072. A strong reclaim would open room toward the prior consolidation shelf; the blue horizontal target on the chart flags a higher supply area near ~$0.13.
If ~$0.056 fails on a daily close, downside extension remains likely. The next visible area sits around ~$0.048–$0.050 on the chart scale. As tariff headlines evolve, cross-currents can amplify moves around these levels, so confirm with volume and daily closes.
RSI oversold; bounce needs confirmation
The 14-day RSI sits near 20 on Oct. 17, 2025, which places XDC deep in oversold territory. Momentum remains weak because the RSI stays far below its own signal average in the mid-30s. Therefore, pressure persists despite the possibility of short, reflex bounces.
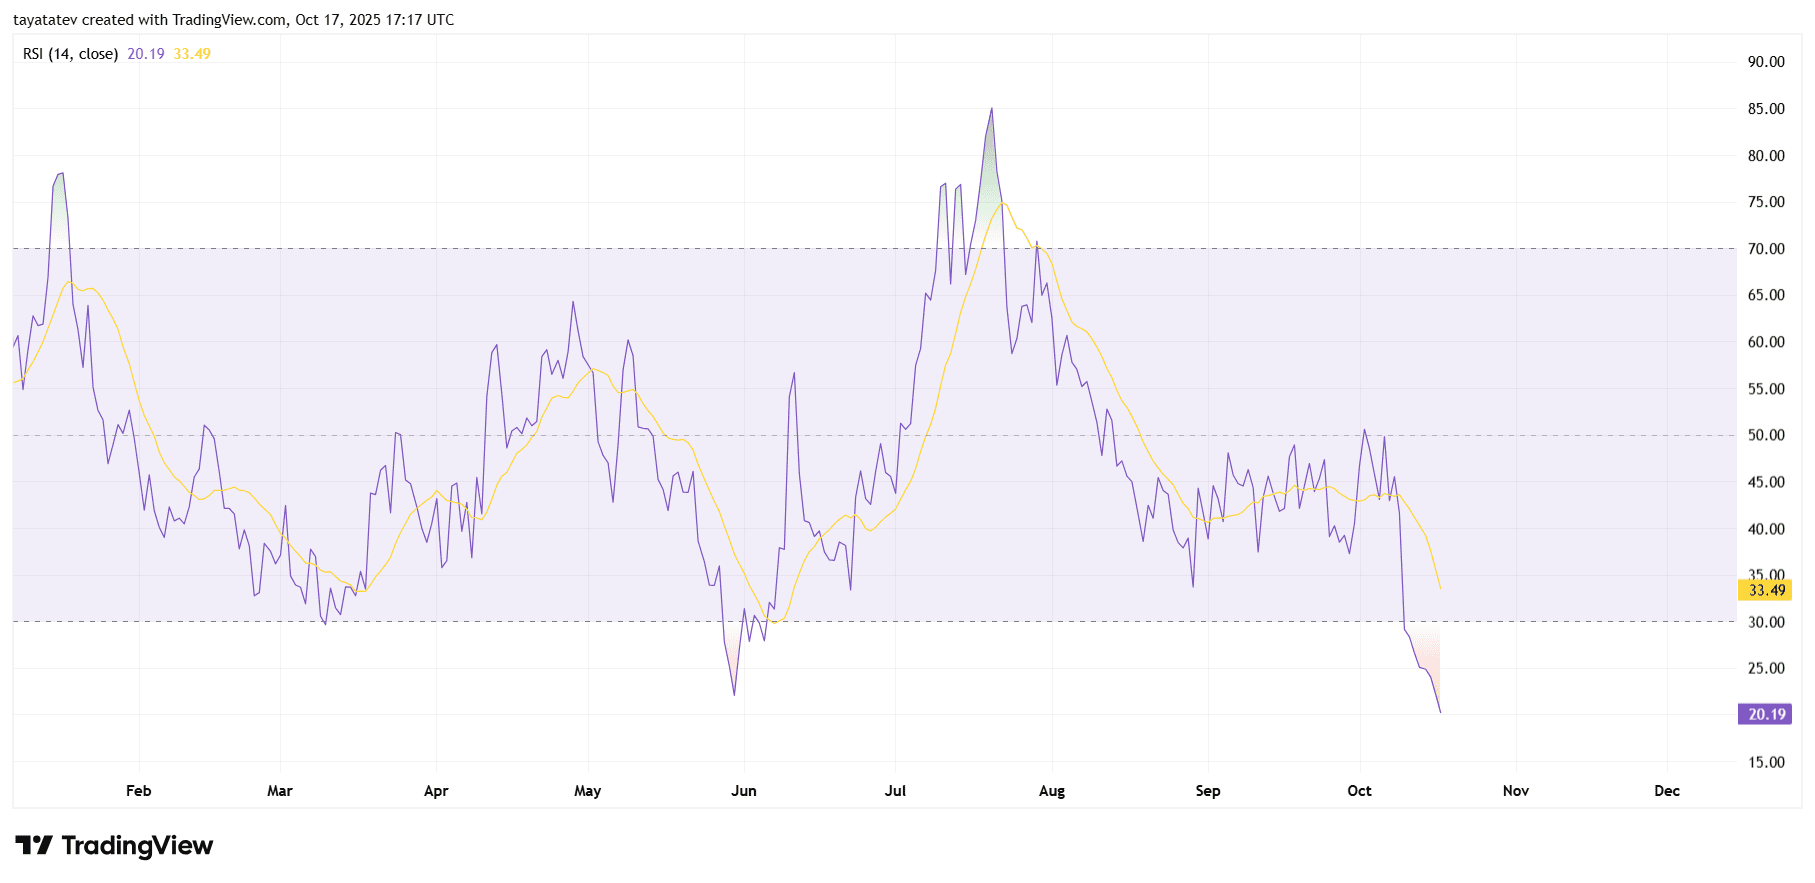
However, oversold alone does not mark a bottom. The indicator can hold under 30 during strong downtrends, and today’s trough undercuts prior September–October lows. That undercut shows acceleration rather than cooling. As a result, buyers need fresh evidence before calling a turn.
Confirmation starts with a daily close back above 30. Then, the RSI should cross up through its signal line to show momentum repair. A bullish divergence would strengthen the case—price makes a lower low while RSI carves a higher low—but the chart does not show it yet.
Context still matters. If price holds the nearby support while RSI reclaims 30, a rebound gains probability. Yet if support fails and RSI stays pinned below 30, continuation lower remains the base case. Rising buy volume during any bounce would add credibility; a weak lift without volume risks fading quickly.
MACD turns decisively bearish; watch for histogram squeeze
The daily MACD for XDC prints a clear bearish read on Oct. 17, 2025. The MACD line sits below the signal line, and the histogram extends deeper into negative territory. Momentum accelerated to the downside after early-October weakness, confirming follow-through rather than a brief dip.
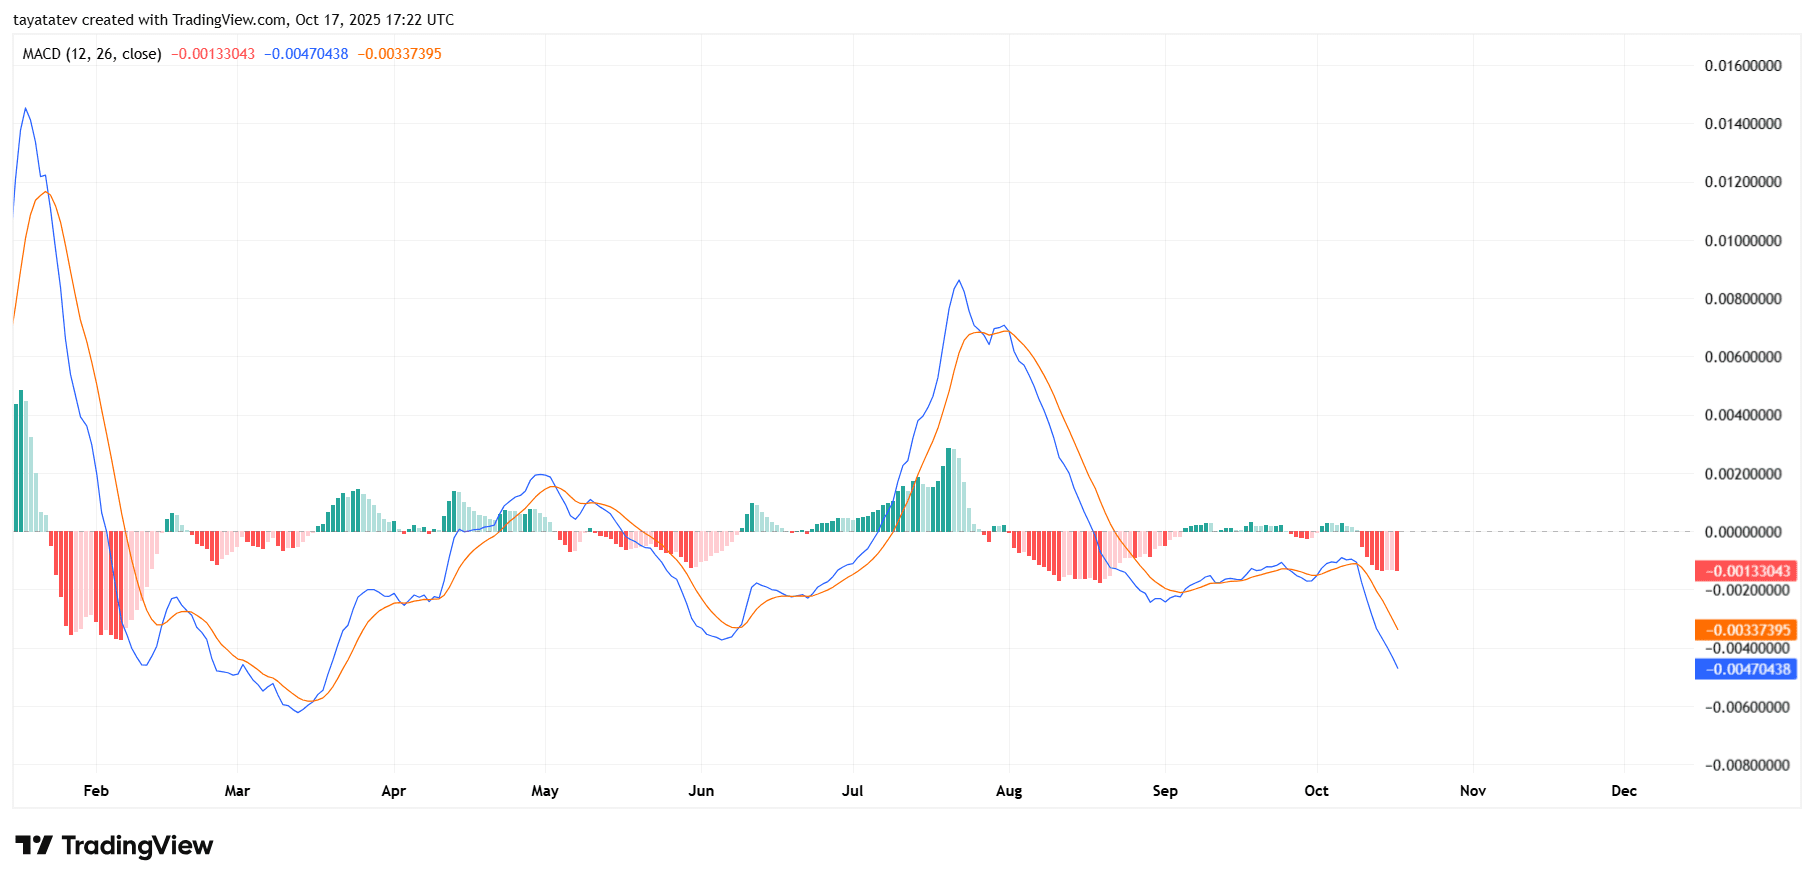
However, MACD trends often lag. Therefore, the first sign that sellers are tiring will be a histogram squeeze—smaller red bars even while both lines remain below zero. That contraction would show downside momentum fading. Without it, the risk of continued pressure remains elevated, and rallies can stall beneath the falling signal line.
Context matters. The last strong bullish phase peaked in late July to early August, when the MACD broke above zero with tall green bars. Since then, successive lower highs in both the MACD and the signal line map a momentum downtrend. To shift the regime, XDC needs three steps in sequence: a histogram squeeze, a bullish cross of the MACD up through the signal line, and then a push back toward the zero line. Until those appear, the indicator supports the bearish tape and warns that any bounce from price support may face resistance on approach to prior trendlines.