
OKX says its wallet integrates with ChainOpera AI, enabling users to connect and access COAI-related flows directly from the wallet interface. The integration emphasizes self-custody and a direct route into the agent ecosystem. The notice went live two weeks ago and remains accessible today. Medium
In addition, OKX’s general airdrop-safety explainer remains available and current, outlining common verification steps for claim flows. While the guide is not ChainOpera-specific, it mirrors industry practices that apply when connecting wallets to claim portals.
ChainOpera’s homepage continues to position the project as a “collaborative intelligence” network that links users, AI agents, models, data, and GPUs. The live site highlights user-facing apps such as an AI Terminal alongside developer-oriented surfaces.
Airdrop claims: verify links amid look-alike sites
Community guides that describe how to claim COAI are circulating, including a step-by-step Medium post published today. These third-party instructions reference connecting an EVM wallet and limiting claims to a single address per participant. They are informational and should be checked against official links before use.
Historical aggregator pages list the ChainOpera airdrop hub URL and summarize expected eligibility parameters. These pages predate today but continue to function as reference points for claim mechanics and deadlines.
Security researchers last week documented a fake “COAI airdrop” website impersonating the project. Their write-up classifies the site as fraudulent and explains how it lures users into connecting wallets. This warning remains relevant for anyone navigating claim links.
ChainOpera’s Quest portal shows “Season 3 — User-Developer Flywheel” live, with tasks that include following the project on X and references to the AI Terminal, Agent Platform, and Model/GPU Platform. The page indicates a points and badges system intended for developer participation.
The Quest interface functions as an on-ramp for builders, pointing them to where they can engage with agent development and ecosystem tasks. It also surfaces a developer point system that tracks progress across activities.
Together with the main site, the Quest page outlines the practical path for contributors: discover tasks, connect social handles, and locate the relevant build surfaces (terminal, agents, models). These materials remain accessible as of today.
Protocol and token utility: what the docs say
ChainOpera’s white paper describes COAI as the network’s native utility token for accessing services, rewarding contributions, and coordinating activity among users, developers, compute providers, and data contributors. The docs also detail token distribution and the unlock schedule.
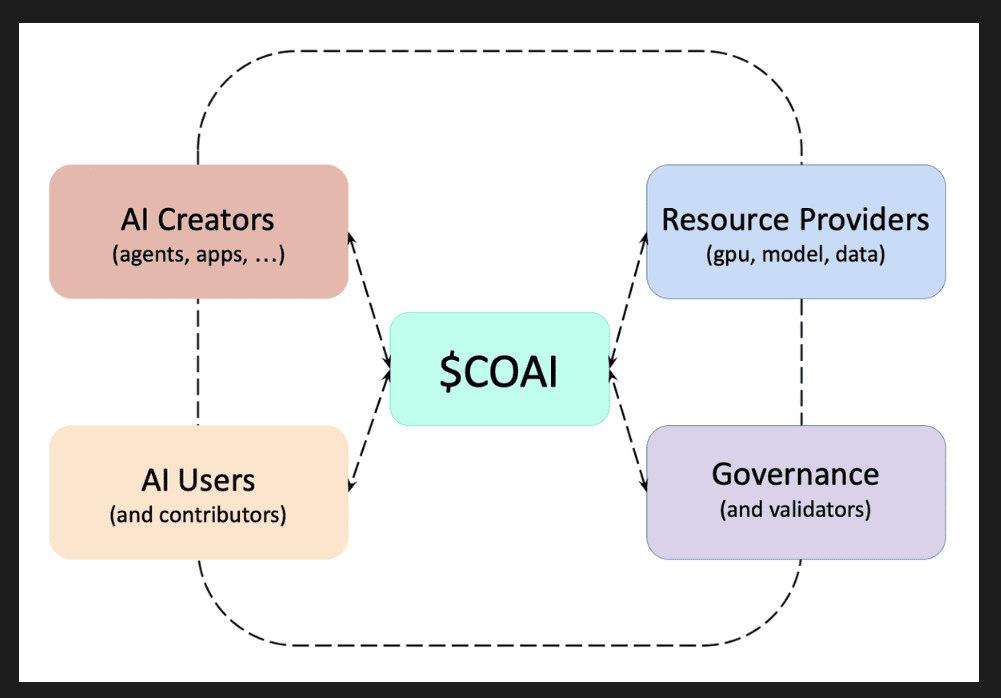
The documentation frames COAI’s role across the stack—agent interactions, model usage, and resource provisioning—so participants can understand where the token appears in daily operations. This remains the primary source for the token’s non-price design.
Additionally, ChainOpera’s public site reiterates the “co-created and co-owned” positioning for its agent network, aligning the app, developer tools, and compute layers with the token utility described in the white paper. That articulation is unchanged today.
COAI builds a rising channel; a confirmed breakout eyes ~64.7 USDT
Oct. 16, 2025 (UTC). The COAI/USDT 1-hour chart shows a clear rising channel with price near 19.90 USDT. The 50-EMA trends higher around 17.31 USDT, while RSI sits near 51, a neutral posture. If price confirms a breakout, a +225% path from the current print projects to ~64.7 USDT.
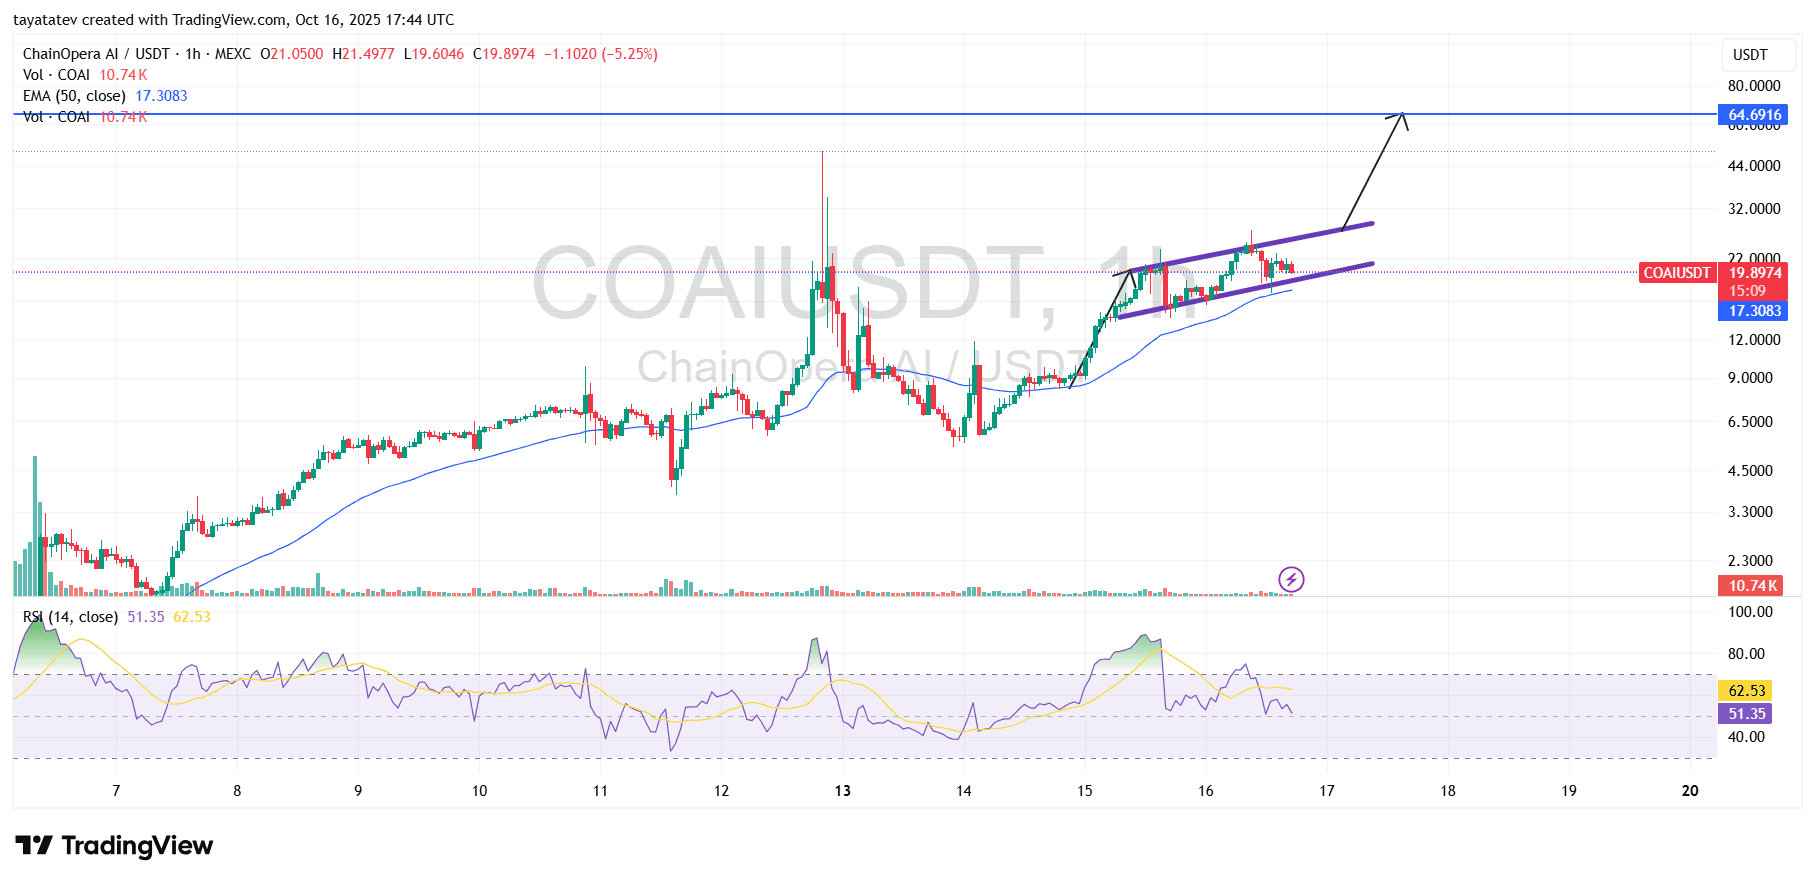
Price makes higher highs and higher lows inside two parallel, upward-sloping rails. Candles cluster in the upper half of the channel, which reflects steady demand. Pullbacks keep finding bids above the rising 50-EMA.
Moreover, intraday spikes fade without breaking the lower rail, so the structure remains intact. Each dip tests, then respects, the dynamic support band around the EMA. This behavior signals control by buyers, not euphoria.
However, momentum cooled after the latest push. RSI eased toward mid-range, and volumes normalized. The setup stays constructive as long as price holds the channel floor and the EMA trend.
What a rising channel pattern signals
A rising channel maps an organized uptrend. The upper rail caps rallies, and the lower rail cushions retracements. Traders watch for clean closes beyond either rail to judge continuation or reversal.
When price closes above the upper boundary on strong participation, trend acceleration often follows. Retests of the broken rail then flip to support. That sequence marks confirmation rather than noise.
Conversely, a close below the lower boundary warns of trend fatigue. Follow-through below the EMA strengthens the reversal case. In short, the rails define both opportunity and risk.
How a +225% objective reaches ~64.7 USDT
From the displayed last price near 19.90 USDT, adding +225% implies multiplying by 3.25. The projection lands around 64.7 USDT. The horizontal mark near 64.69 on the chart aligns with that arithmetic target.
To pursue that path, price should first print an hourly close above the upper rail of the channel. Then it should hold a retest of that rail without losing intraday structure. A push with broader candles and expanding volume would strengthen confirmation.
Additionally, RSI sustaining above 60 would support trend extension. The 50-EMA must keep rising beneath price. As these signals stack, the probability of follow-through toward the measured objective improves.
What would invalidate the bullish read
If price closes below the lower rail, the channel breaks. A second close below the 50-EMA (~17.31) would add weight to a pullback case. Momentum slipping under RSI 40 would further confirm sellers in control.
In that scenario, the market would likely revisit recent demand zones before attempting repair. Recovery would require a swift reclaim of the EMA and the former rail. Until then, upside projections would pause.
Therefore, the channel boundaries and the EMA define today’s line of defense. Hold them, and the structure favors continuation. Lose them, and the bias flips.