
Ether’s liquid supply is tightening across three fronts—digital-asset treasuries, spot ETFs, and staking—while institutional demand rises, an analyst said. As a result, analysts expect upward price pressure.
Three supply vacuums at once
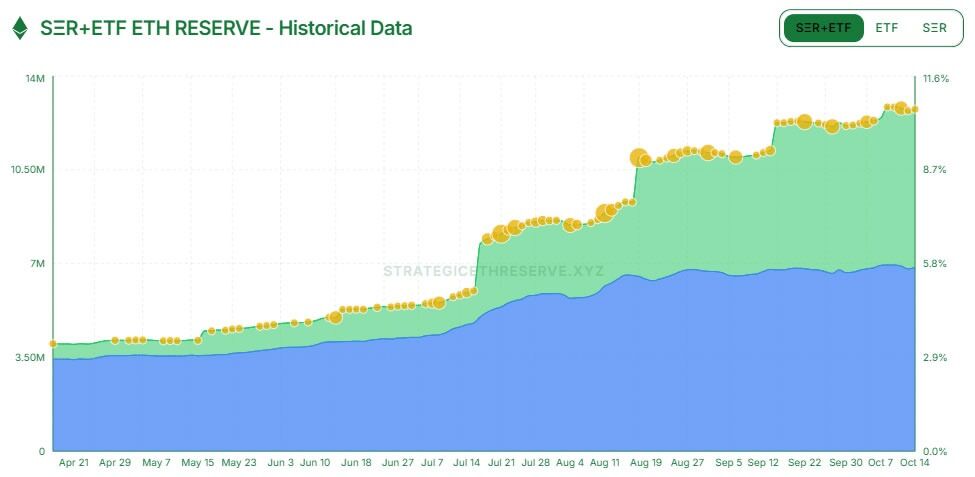
Analyst “Crypto Gucci” said Ethereum has never faced all three forces at the same time. First, digital-asset treasuries (DATs) emerged this cycle and now hold 5.9 million ETH (about 4.9% of supply), according to StrategicEthReserve. Second, U.S. spot Ether ETFs—absent last cycle—have accumulated 6.84 million ETH (5.6% of supply). Third, staking has matured, with 35.7 million ETH staked, roughly 30% of the supply.
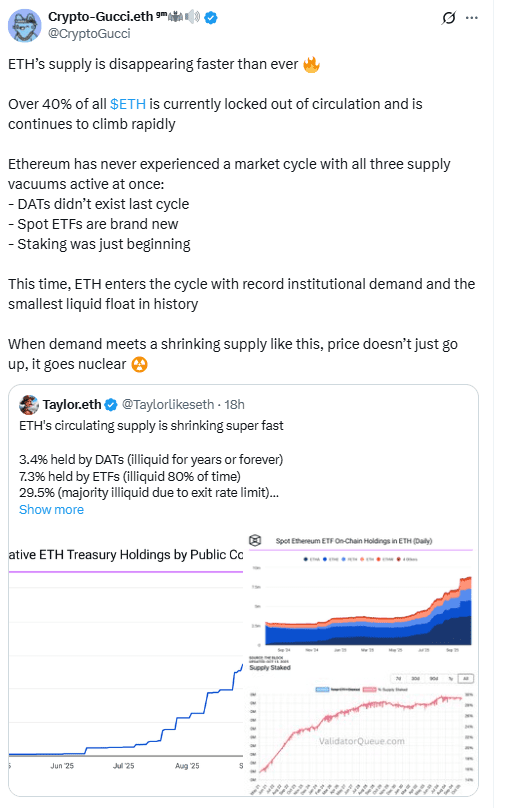
DATs did not exist in the prior cycle. Now, they buy and hold ETH for long-term yield and treasury diversification. Meanwhile, U.S. spot ETFs have continued to add ETH even without staking enabled. Together, these two buyers remove liquid coins from markets and reduce the float available on exchanges.
Staking locks a large share of coins and slows the speed at which ETH returns to the market. Today, about 30% of supply sits in validators. Most of it is illiquid because the exit queue is ~40 days, which delays withdrawals and adds persistence to the supply squeeze.
“Nuclear” quote reflects a simple mechanism
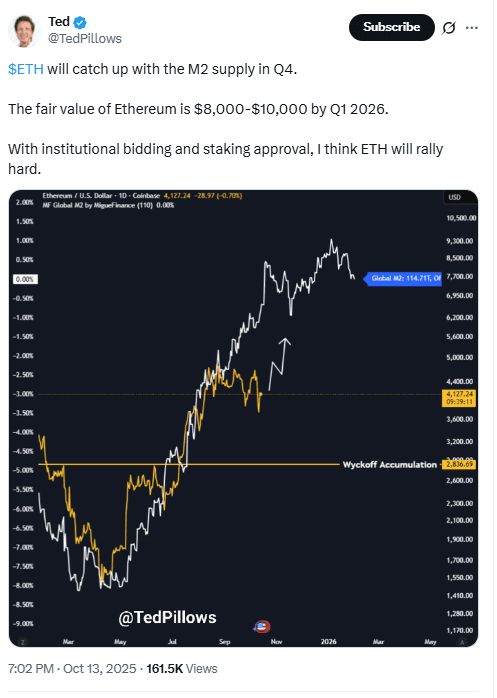
Crypto Gucci argued that record institutional bidding is colliding with the smallest liquid float in ETH’s history. When demand rises while circulating supply falls, prices tend to move higher. Entrepreneur Ted Pillows echoed that view this week, saying ETH could reach $8,000–$10,000 this cycle if ETF staking gains approval and institutional buying continues.
ETH’s supply is marginally inflationary today, but it has grown only ~0.5% since the Merge (2022), per Ultrasound.Money. For context, Bitcoin’s supply rose about 4% over the same period. Lower net issuance supports a tighter market when demand rises.
Possible fourth vacuum: nation-state reserves
A fourth driver could emerge if nation-states start adding ETH to strategic reserves. This week, Bhutan said it is integrating its national ID system on Ethereum. It does not currently hold ETH. As Ryan Sean Adams noted, building on Ethereum does not automatically translate into holding ETH as a store of value, but such holdings—if adopted—would further restrict liquid supply.

Last cycle lacked DATs and spot ETFs, and staking was immature. This cycle combines all three, each removing supply in a different way: treasuries accumulate, ETFs warehouse shares for investors, and staking locks coins behind protocol rules. With these forces active at once, analysts see sustained pressure on the tradable float.
ETH forms bullish flag; EMAs and volume set breakout toward ~$6,425 (Oct 13, 2025)
ETH/USD chart shows a bullish flag after the Q3 rally, with price compressing beneath the upper channel near $4,350–$4,450. A bullish flag is a short, downward pullback inside parallel lines after a strong advance that often resumes higher when price closes above the flag top on rising volume. ETH trades above the 20-day EMA and near the 50-day EMA, while the 200-day EMA trends below, which preserves a constructive stack if price reclaims the flag’s upper boundary.
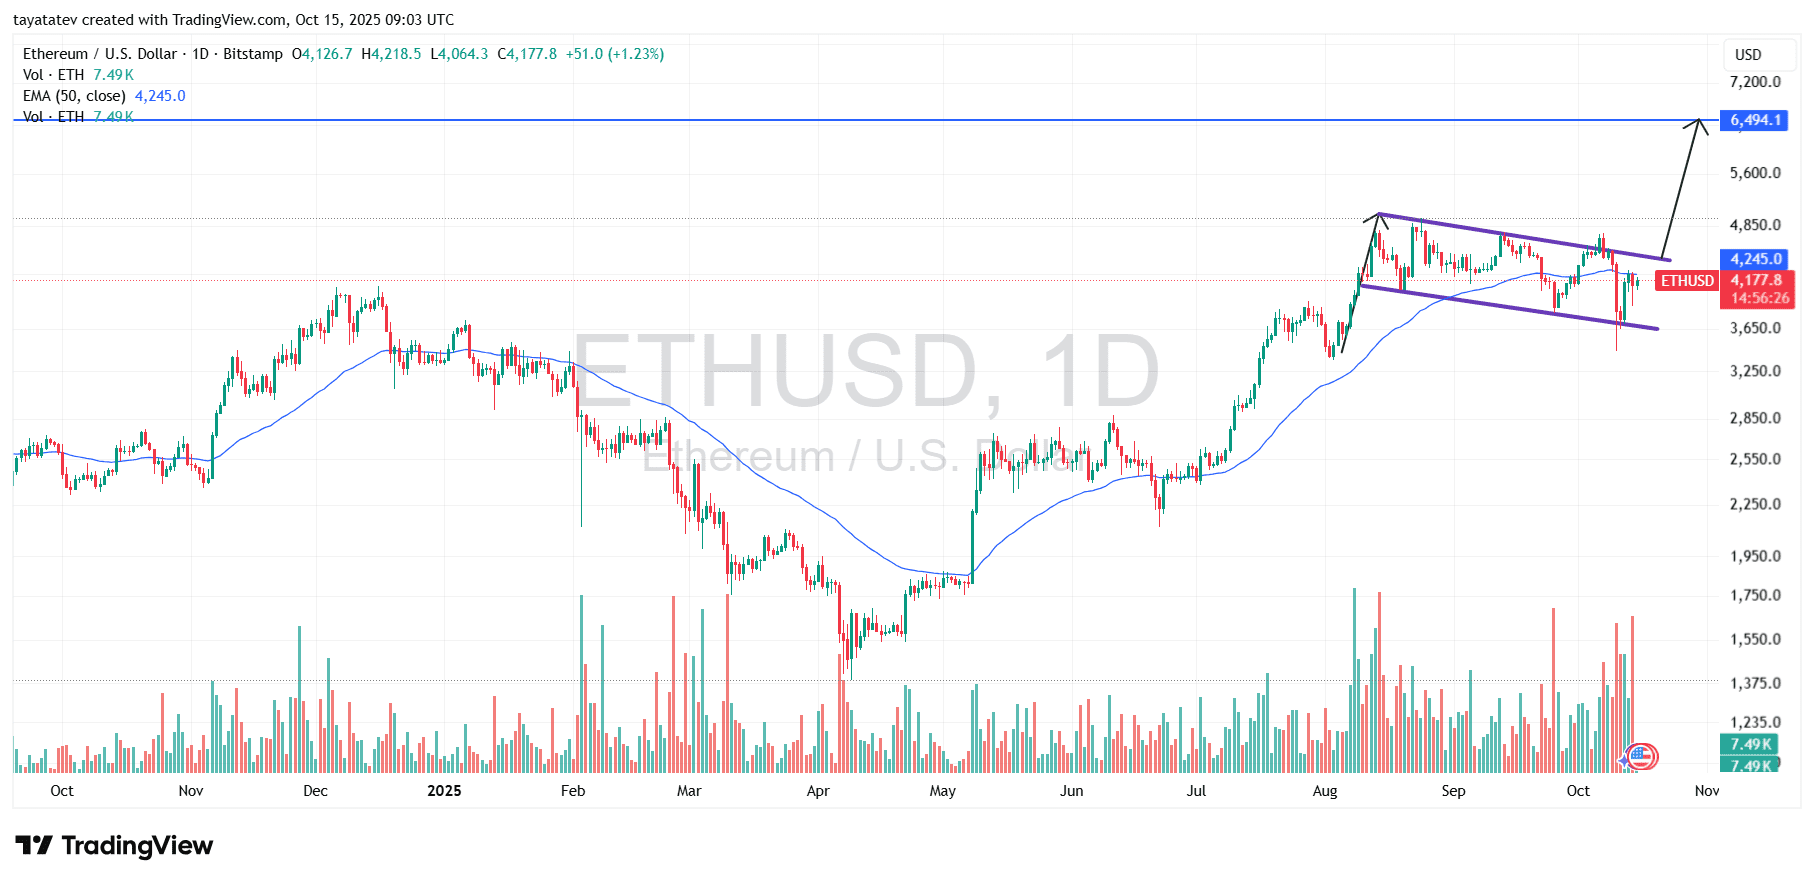
Momentum has reset without breaking trend. RSI cooled from overbought into neutral, and MACD narrowed toward a potential cross-up. These conditions support continuation if buyers push a daily close through $4,450 with expanding spot-plus-perp volume. OBV printing a higher high alongside price would add confirmation and reduce the risk of a false break.
If the breakout confirms, the measured move from the prior flagpole implies ~54% upside from the cited spot near ~$4,172 to roughly $6,425. Initial resistance sits at $4,700–$4,900, then $5,200–$5,400; supports remain at $4,000 and $3,800 inside the flag. The setup weakens on a decisive daily close below ~$3,700 or on a break that immediately fails back into the channel with light volume.
ETH MACD (12,26,9) points to weakening momentum; watch for a signal reclaim (Oct 15, 2025)
Ether’s MACD on the daily chart sits below the signal line and below the zero line (approx. MACD −55.5 vs. signal −33.5; histogram about −22). This alignment shows bearish momentum after the recent pullback. The negative histogram means sellers still have the edge; however, bars are relatively small, which often precedes a momentum inflection if they start shrinking toward zero.
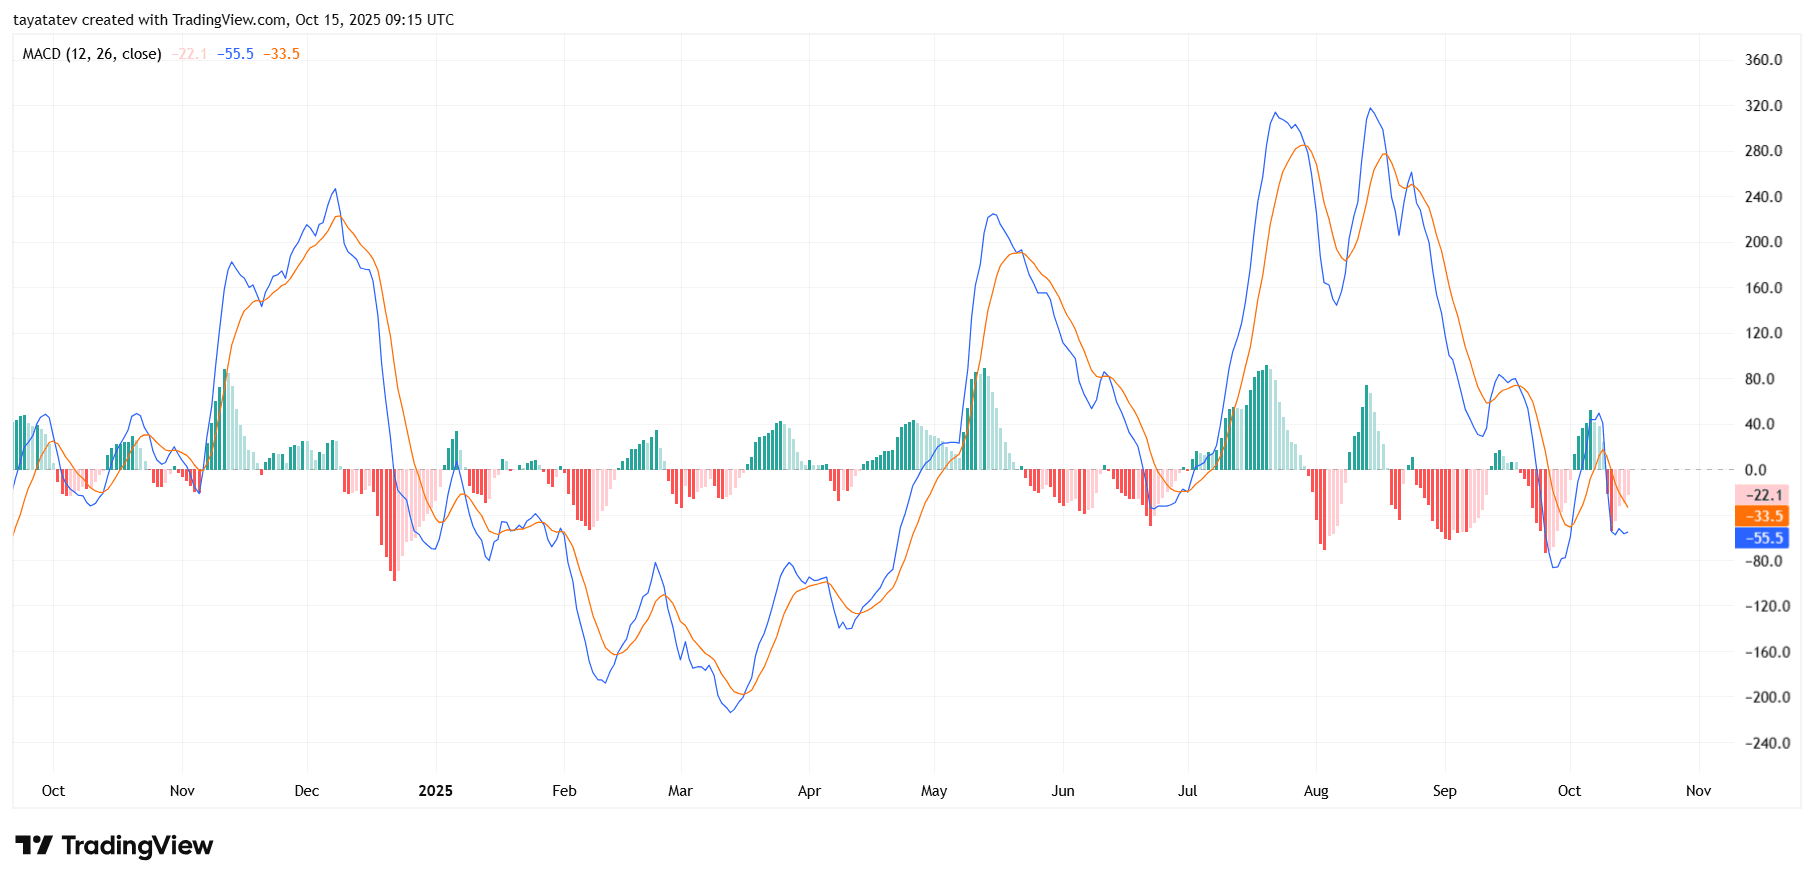
In practical terms, bulls need the histogram to rise toward zero and flip positive (MACD crossing back above the signal). That would signal a rebound in trend strength and support a breakout attempt from the flag discussed earlier. Stronger confirmation arrives only if the MACD climbs back over the zero line, which historically aligns with more durable advances.
Until those triggers appear, the indicator favors consolidation or chop, with risk of further downside if the histogram expands deeper into negative territory. Volume expansion on up days, paired with a MACD/signal bullish cross, would improve the odds of continuation.
ETH daily RSI: neutral tilt below midpoint; watch 50 reclaim then 60+ for momentum (Oct 15, 2025)
ETH’s 14-day RSI sits near 47.2, below its RSI moving average around 50.7 and just under the 50 midpoint. This placement signals neutral-to-soft momentum after the recent swing. In the prior week, RSI bounced from the low-30s but failed to hold above the low-50s, showing fading follow-through.
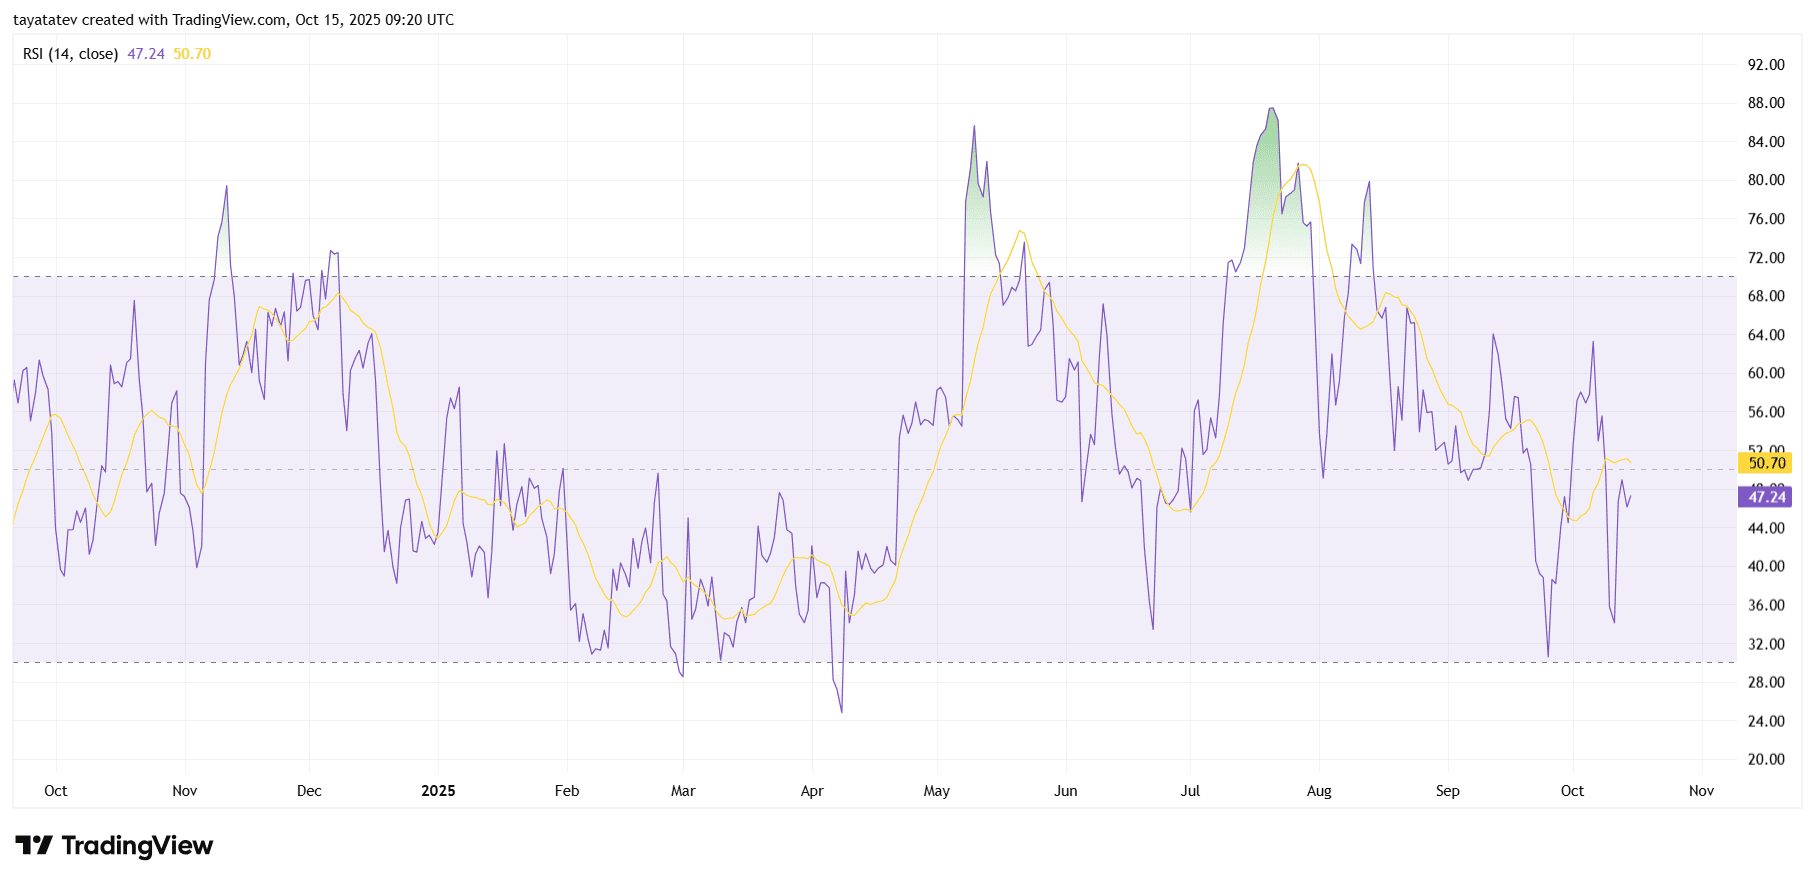
For upside confirmation, RSI should reclaim and hold above 50, then push through 60–65, which often aligns with trending advances. A move back over its RSI MA would add support to that signal. If RSI rolls back under 40 and especially 35–30, it would indicate renewed downside pressure and raise the risk of a deeper pullback. In short, momentum is resetting; the next decisive move hinges on whether buyers retake the 50–60 band or sellers press RSI toward the 30s.