
Bitcoin fell fast on Friday. The BTC/USDT Binance futures pair printed a low near $102,000. The move followed Trump’s 100% China tariffs announcement and hit books with high leverage.
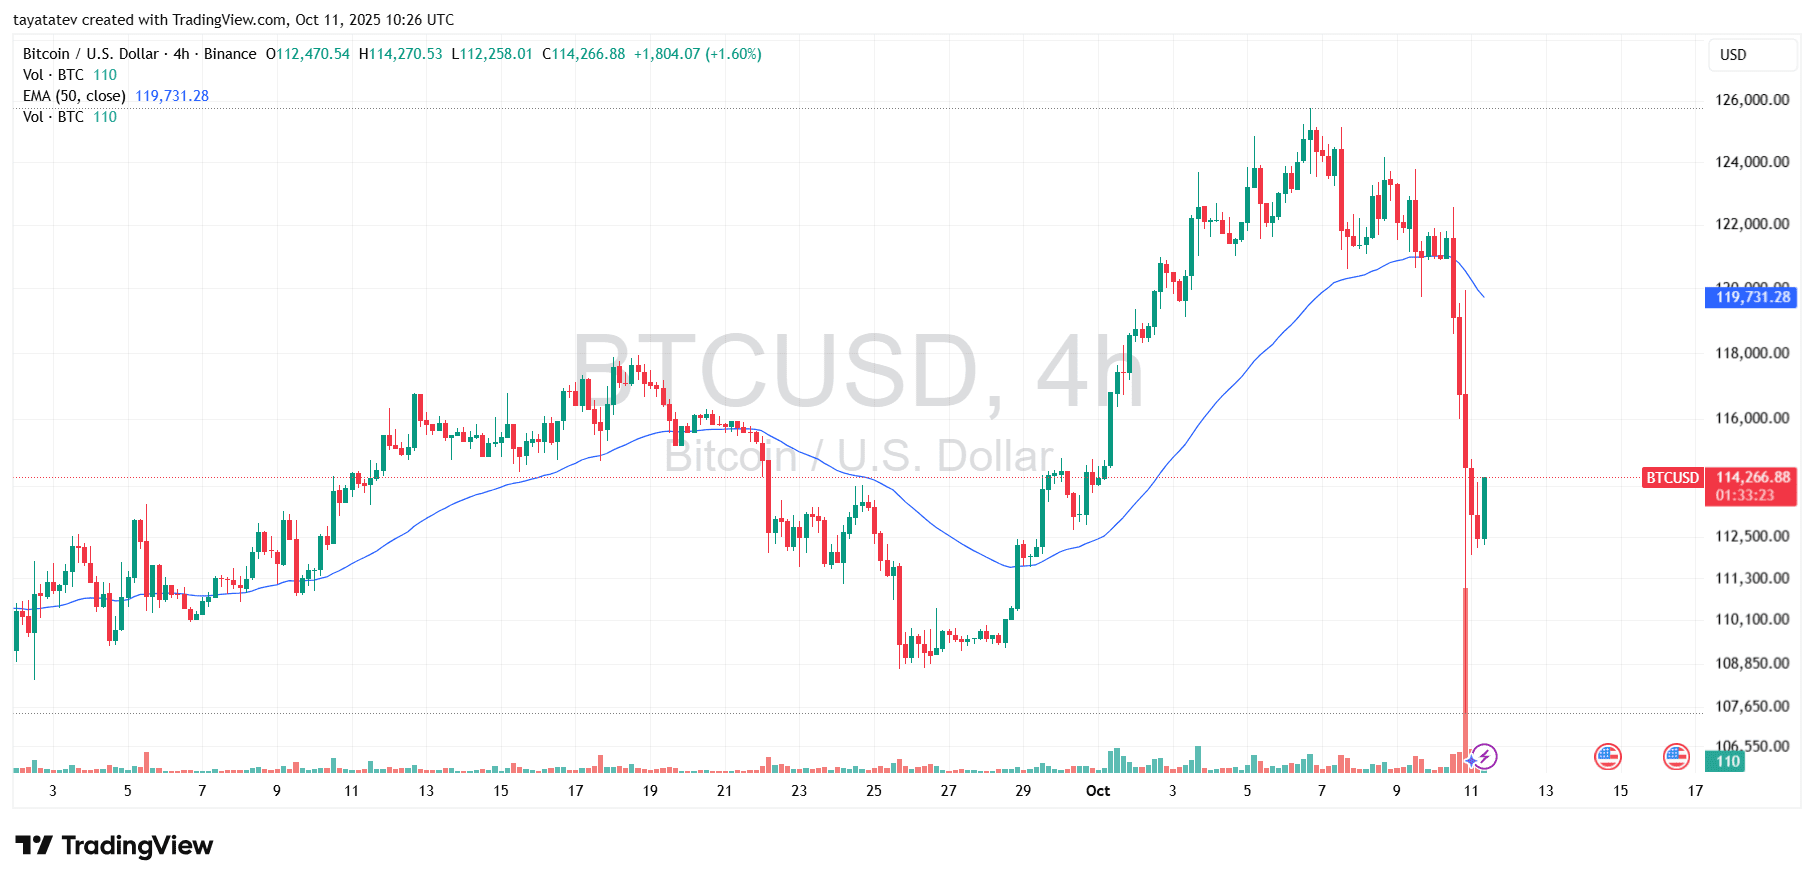
Spot markets tracked the drop. On Coinbase, Bitcoin spot touched an intraday low near $107,000 before stabilizing. Order books thinned as bids stepped back.
Market data showed pressure across venues. The wick to $102,000 on Binance futures marked a three-month low. The level aligned with June’s sub-$100,000 zone referenced in coverage.
Liquidations data and altcoins: CoinGlass liquidations, Ethereum $3,500, Solana below $140
Derivatives dashboards recorded a sharp unwind. CoinGlass liquidations totaled about $9.40 billion in the past 24 hours. The data showed $7.15 billion in leveraged longs wiped out.
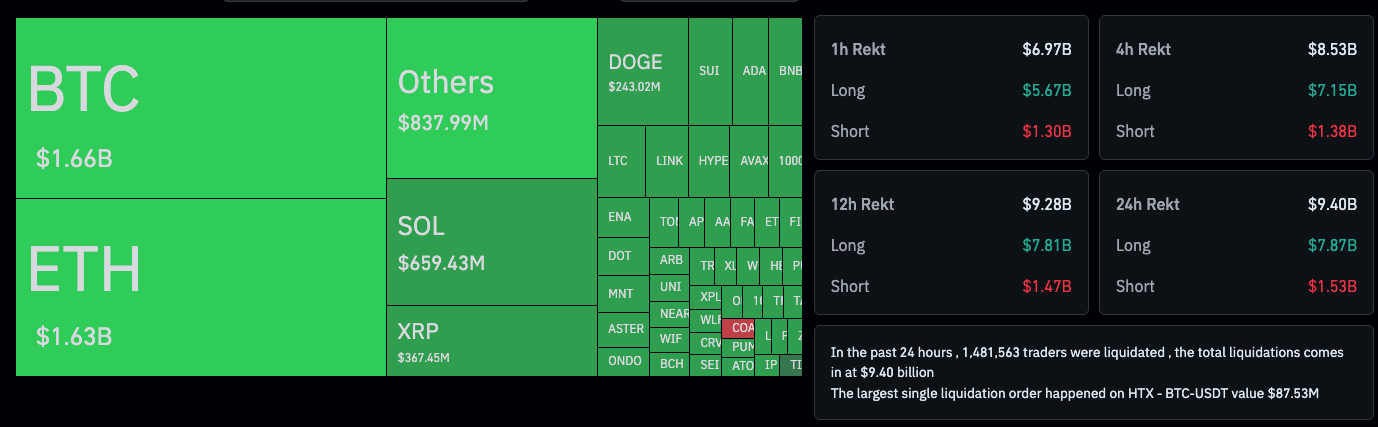
Large-cap tokens fell in tandem. Ethereum $3,500 printed on Coinbase during the sell-off. Solana below $140 appeared on the Binance futures pair at the worst point.
The Hyblock “Global Combined Books” chart shows depth collapsing to $1.2B during the fastest leg lower. The line falls almost vertically from multi-billion levels. The drop signals orders pulled or filled across major venues.
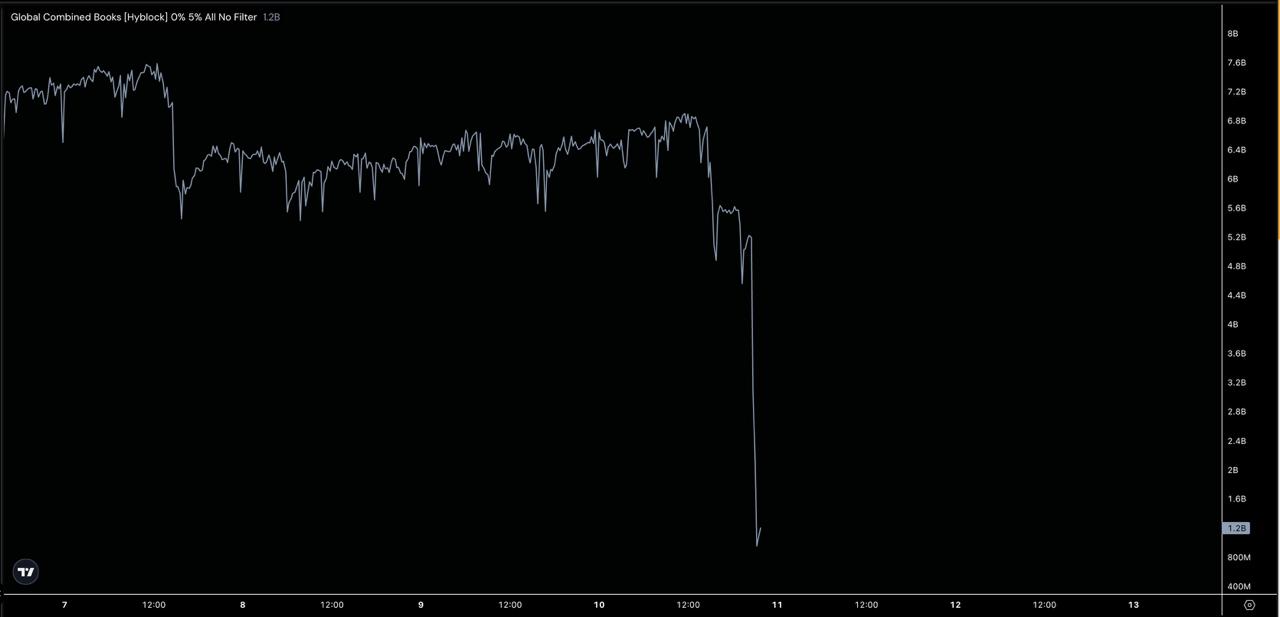
Order-book depth aggregates visible bids and asks near price. When depth thins, price can move faster through the book. Small market orders create outsized impact when liquidity vanishes.
This vacuum aligns with the Bitcoin $102,000 Binance futures wick. Books offered fewer resting bids as the tariff headline hit. The print reflected the path of least resistance through thin liquidity.
Analysts at Hyblock Capital said “global 2x leverage on most altcoins was totally wiped out.” The image supports that summary. Depth slid as margin calls and liquidations removed inventory.
Leverage amplifies both sides of a move. When price breaks levels, forced selling hits market orders first. That flow consumes bids and drags depth lower in seconds.
The wipeout explains synchronized losses in ETH and SOL alongside BTC. With 2x positions unwound, derivative exposure shrank and books printed lower lows before stabilizing.
Microstructure mechanics — why the wick extended
During shocks, makers widen spreads or cancel quotes. Risk engines lift inventory until volatility cools. That behavior appears in the steep draw on the Hyblock trace.
With fewer passive orders, impact cost rises. Slippage increases because each market order must cross a larger gap. Price then “jumps” between pockets of liquidity.
The result is a tall lower wick on high-leverage pairs. The chart’s abrupt cliff matches that sequence: quotes disappear, liquidations fire, and depth rebuilds only after the wave.
Hyblock’s panel aggregates global combined books. The uniform drop implies a broad event, not an isolated outage. Multiple order books thinned at once.
That breadth matters for interpretation. If one venue failed, others could cushion the print. Instead, the aggregate fell together, which compounds the move.
Consequently, arbitrage slowed and spreads widened across pairs. The depth floor near $1.2B marks the moment of weakest visible liquidity in the window.
BTC futures showed the deepest wick. ETH tagged $3,500 on spot feeds. SOL futures dipped below $140. Those levels align with a depth shock, not a slow trend.
Liquidations removed long inventory first. As positions closed, collateral sales added pressure. The Hyblock curve’s trough aligns with that forced activity.
After the trough, the line begins to recover. Makers return as volatility cools and spreads compress. Depth rebuilding signals that immediate forced flow has slowed.
Tariff trigger and rare earth export controls: Truth Social post, chip supply, mining hardware
Donald Trump posted the tariff message on Truth Social. He cited China’s export controls and referred to a letter signaling “large-scale Export Controls” effective November 1, 2025.
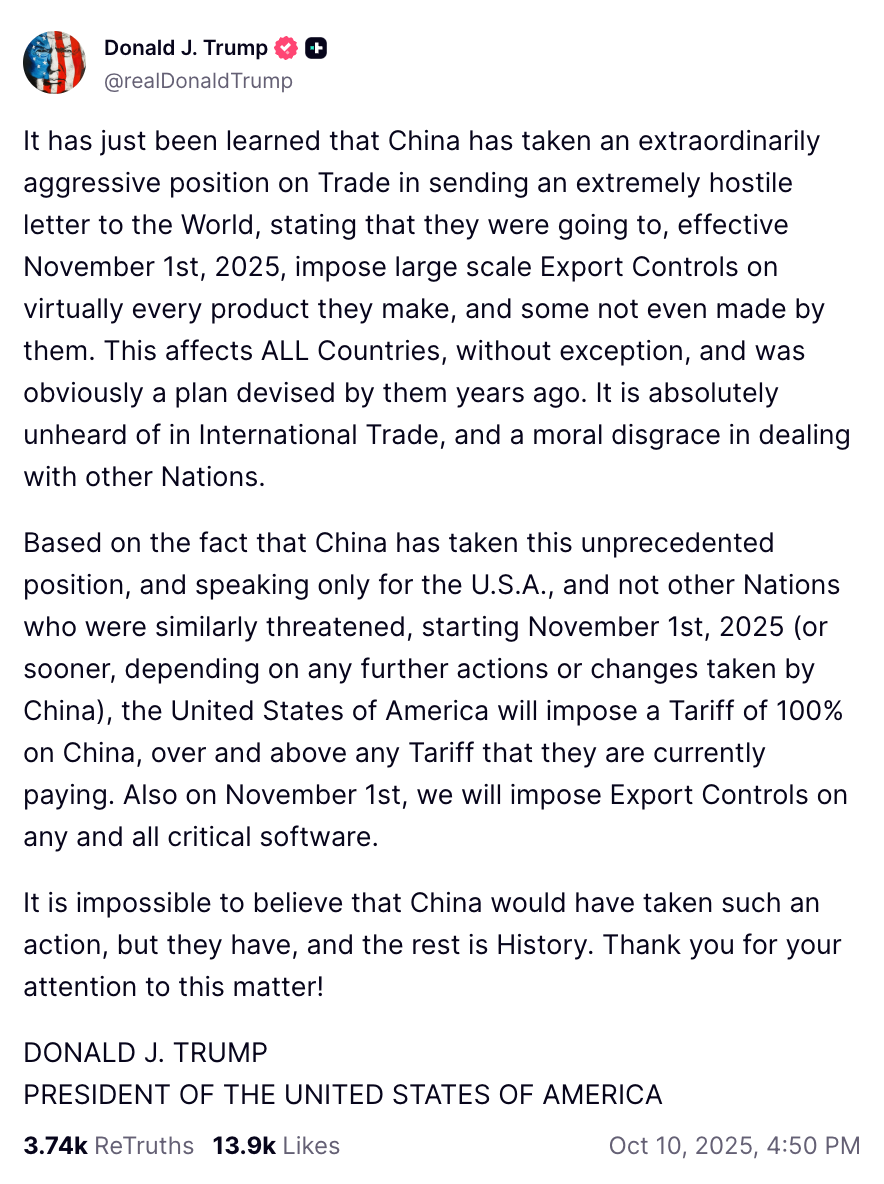
The statement tied the move to rare earth export controls. Rare earth elements support semiconductor and HPC production. The same pipeline feeds crypto mining hardware and broader infrastructure.
Trade friction added a second constraint. Existing U.S. tech measures already limit some flows. The 100% China tariffs layered cost and timing risk onto supply paths that touch chips, servers, and miners.
Total capitalization shrank quickly. The global crypto market capitalization stood near $3.64 trillion, down 11.80% over 24 hours at the time of writing.
Bitcoin ‘liquidation candle’ echoes December 2021: what the charts show
Bitcoin’s latest daily wick on Binance perpetuals mirrors the December 2021 “liquidation candle.” The left pane marks a swift sell-off from near the cycle high around $69,198, followed by a single long wick that erased $12,723, or 23.73%. Price then stabilized lower into 2022. The right pane shows a comparable intraday flush from the recent high band near $126,252–$127,500, with a $20,287, or 16.67%, drop that briefly undercut the $111,000 handle before rebounding.
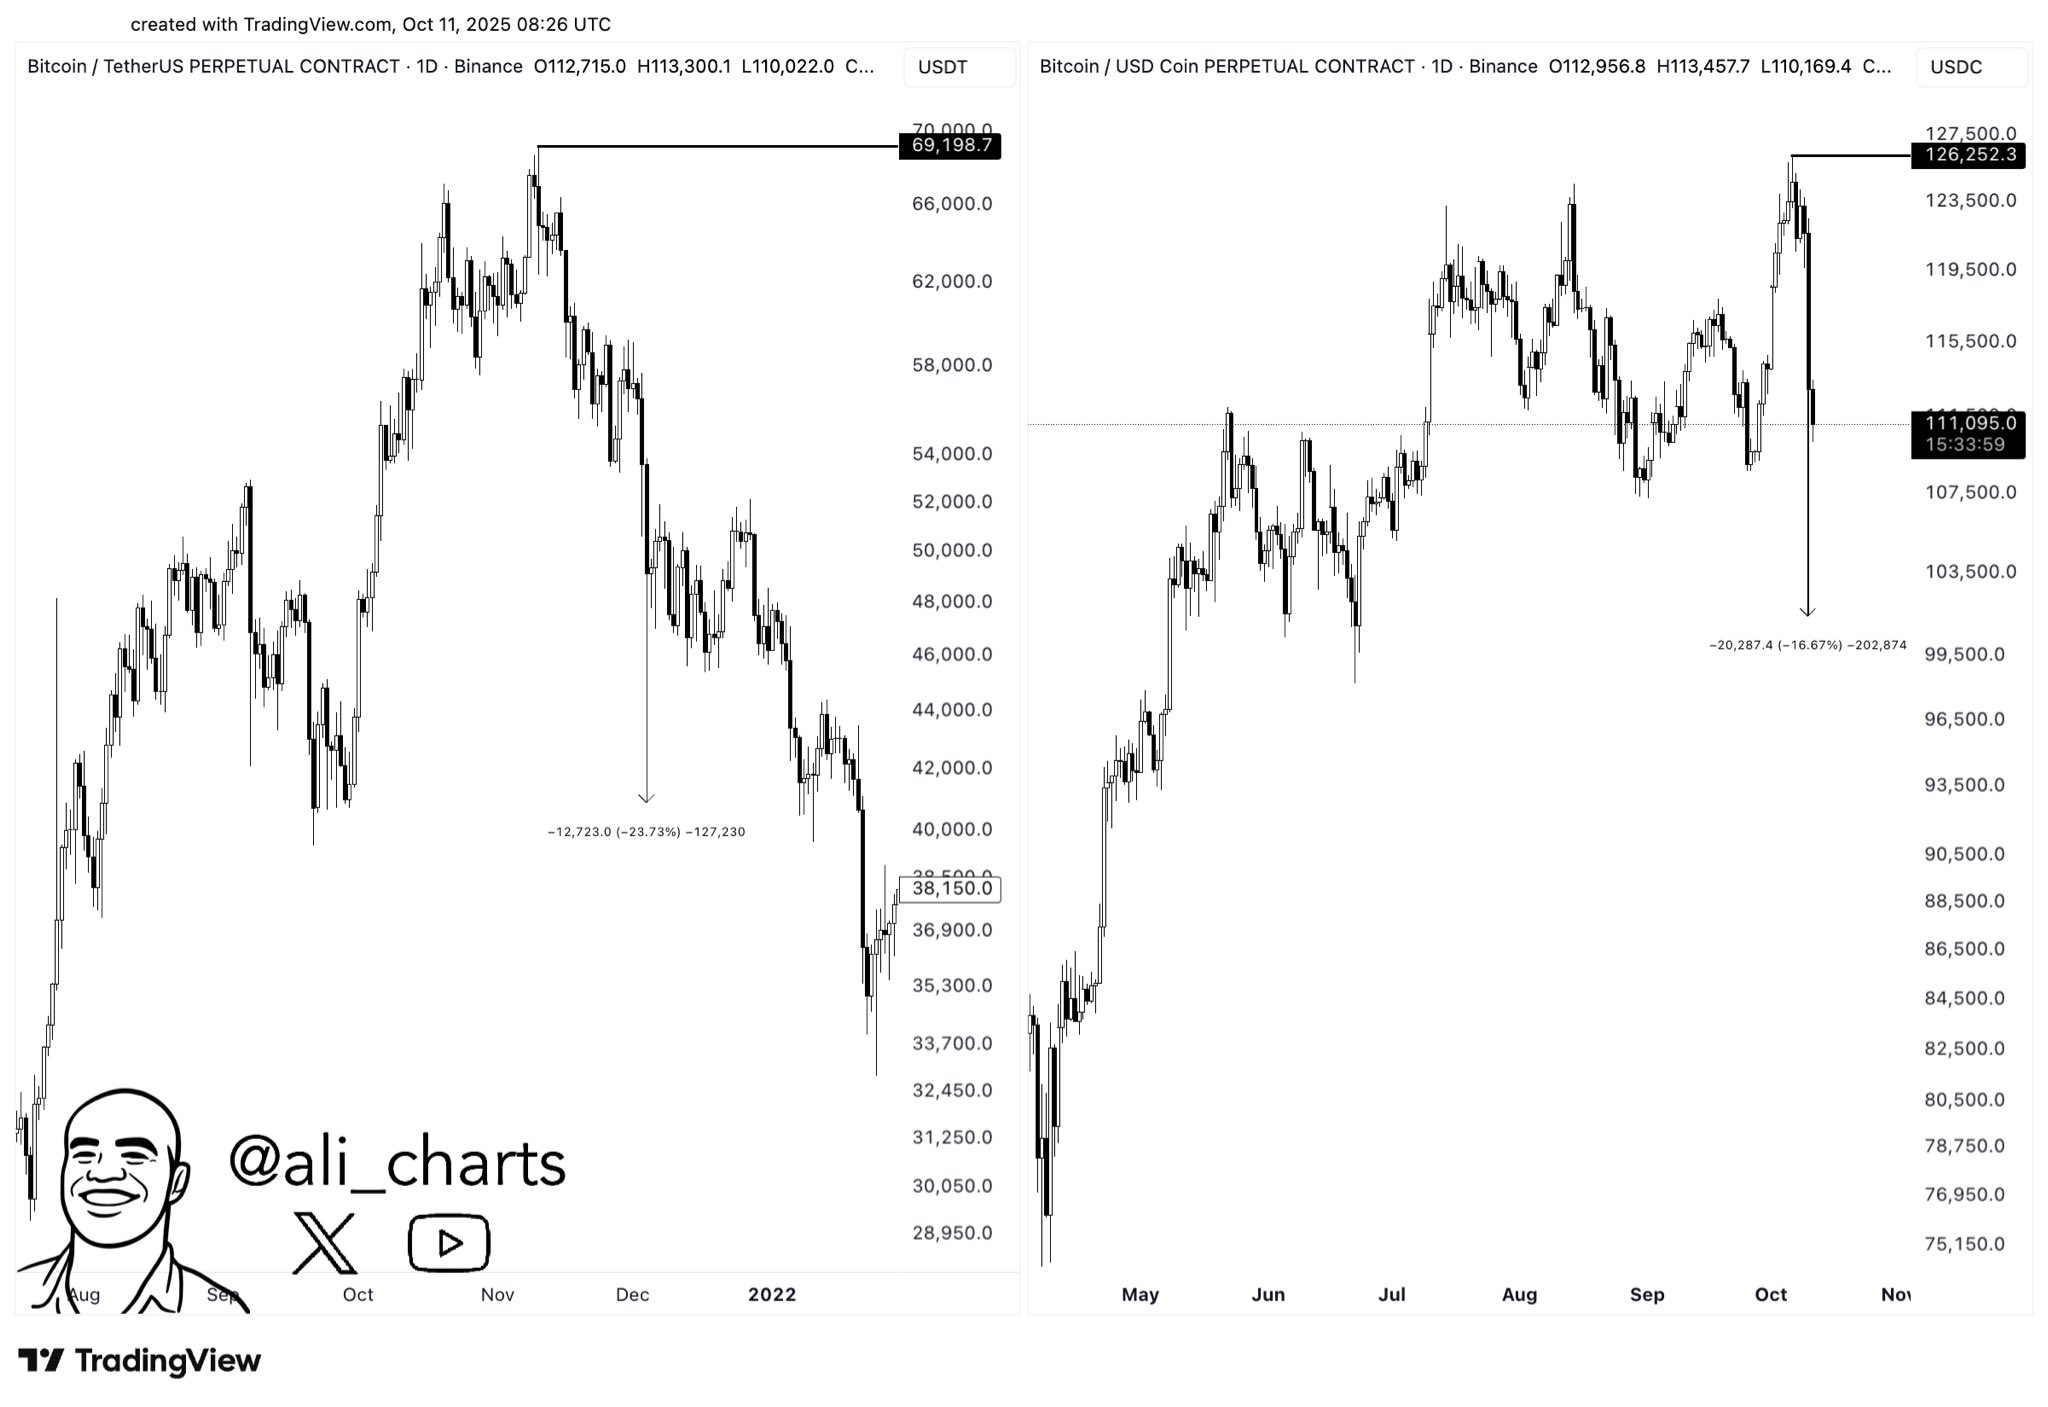
The structure aligns with forced deleveraging. Perpetual futures amplify moves when long positions unwind, so wicks extend quickly as engines cascade through stops. Then, as liquidations slow, order books refill and price retraces part of the move, leaving a tall lower shadow. The chart highlights that behavior on both the USDT and USDC pairs, indicating cross-collateral stress rather than an isolated venue effect.
Context matters on the close. In 2021, the large wick arrived after a topping zone and preceded a trend shift on subsequent daily closes. Today’s candle also forms after repeated rejections near the $126,000–$127,500 area. Yet it currently shows recovery toward ~$111,000 by the session timestamp, which underscores intraday stabilization. Therefore, watchers will focus on where the daily candle settles relative to the prior range midpoints and whether open interest and funding reset further.
Key reference levels stand out on the image. The December 2021 example failed to reclaim the breakdown area on closes and bled into lower highs. The present chart shows a sharp spike to roughly the $100,000–$103,000 zone and a rebound back above $110,000. Consequently, the interplay between that wick low, the $111,000 line, and the $126,000–$127,500 cap will frame the next sessions’ context.
Finally, the side-by-side presentation stresses the mechanism rather than the headline. Both events feature a rapid, leverage-driven sweep that purges longs and resets positioning. The magnitude differs—about 24% then versus about 17% now—but the anatomy is similar: abrupt downside, deep lower wick, and a partial retrace into the close.