
Cosmos’ ATOM printed a violent wick on Binance’s weekly chart. The candle shows O 4.148, H 4.307, L 0.001, C 3.096 — a ~25% drop on the week and a brief print to nearly zero on thin-liquidity execution. The chart also places price below the weekly 50-EMA (~5.02), signaling an intact downside trend on this timeframe.
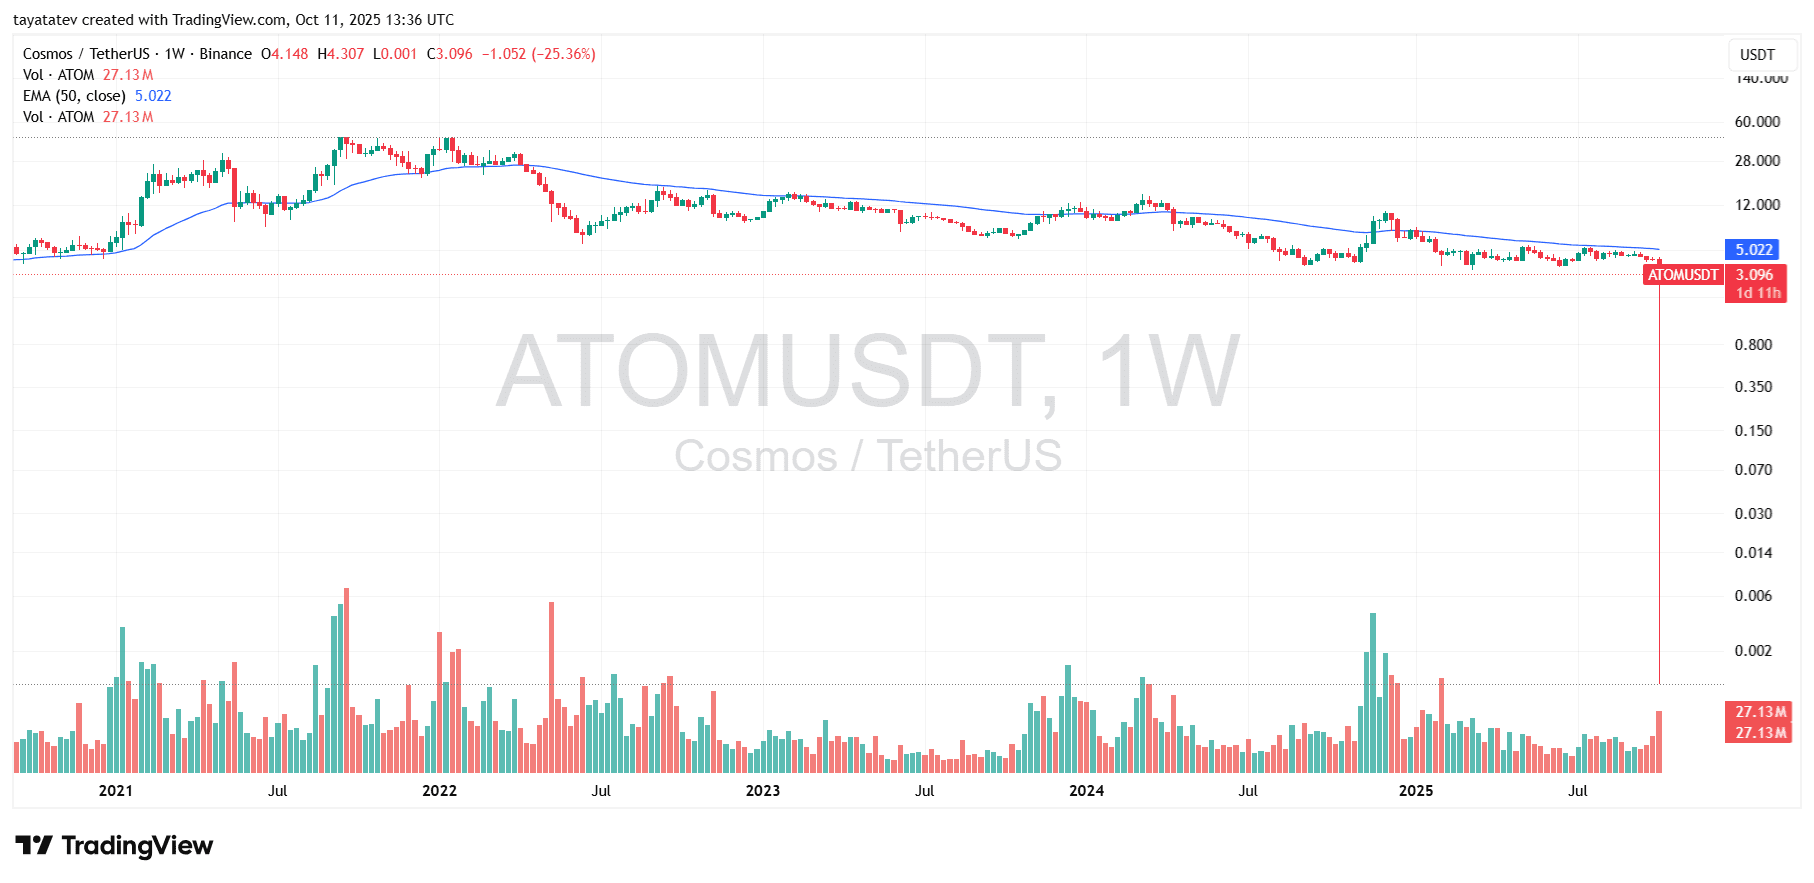
Yesterday’s U.S. tariff headlines added fuel. After Donald Trump’s 100% China-tariff announcement, risk assets sold in tandem, and crypto liquidity thinned. Consequently, ATOM’s intraday books gapped, cascading stops and producing the outlier wick. The quick rebound back above $3 suggests forced selling and engine-driven prints rather than orderly spot distribution.
Technically, the levels are clear. First, $3.70–$4.20 marks the immediate rebound zone from recent weekly closes; reclaiming it would ease pressure. Next, the weekly 50-EMA near $5.02 acts as the trend pivot; a weekly close above it would signal a shift from relief to recovery. Until then, lower highs dominate. Conversely, a clean breakdown from $2.60–$2.80 opens risk to prior cluster support, while another liquidity sweep without follow-through would likely trap late shorts and force a mean reversion back toward $3.70.
Baseline view (not advice): While macro shocks can whipsaw price, ATOM remains in a weak weekly trend below its 50-EMA. Therefore, expect choppy rebounds toward $3.70–$4.20, with trend confirmation only if the market closes above ~$5.02. Otherwise, momentum favors a range between $2.60 and $4.20, with tariff-driven headlines continuing to inject volatility.
The weekly RSI dropped to ~35 while its signal line sits near 47. Momentum turned down hard after yesterday’s tariff headlines, and the oscillator now trends below the 50 midline. Therefore, sellers control the tape on this timeframe.
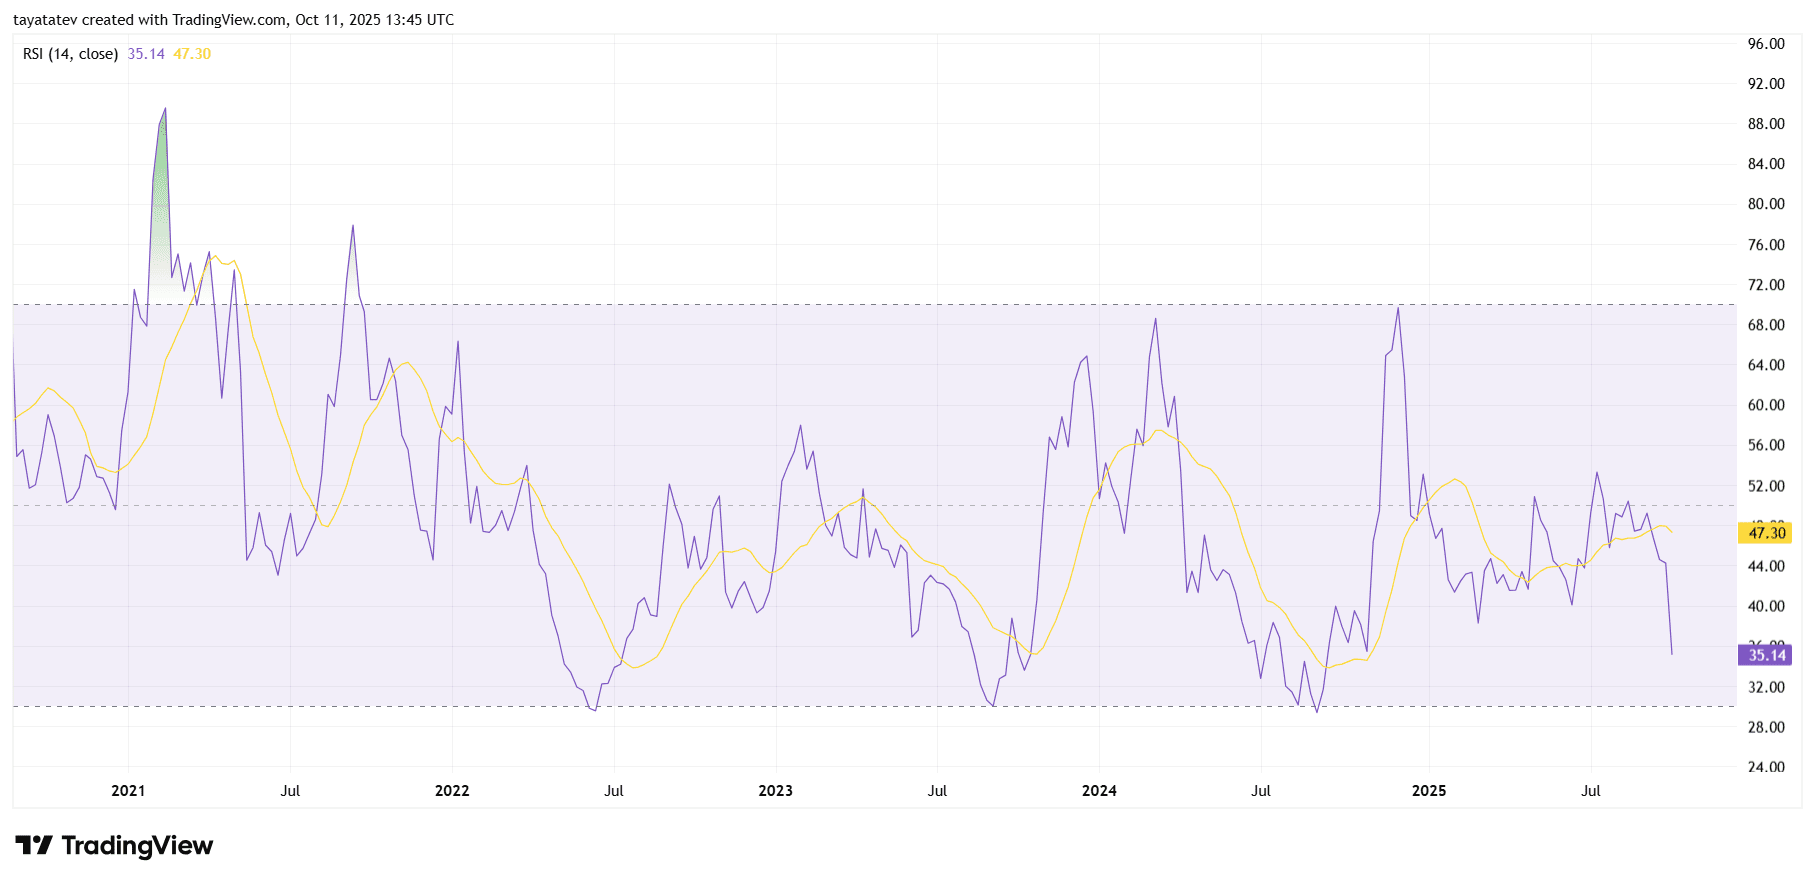
Moreover, RSI made a series of lower highs through 2024–2025 and just knifed toward the 30 oversold band. Historically on this chart, bounces often started only after brief dips near or below 30, not at 40–45. Consequently, risk remains for a momentum push to test that oversold area before any durable relief.
However, the setup is binary and clear. If RSI stabilizes and reclaims 45–50, momentum would shift from defense to neutral and open room for mean reversion. If it fails and closes a week under 30, trend continuation favors further downside pressure in price even if intraday wicks appear.
The weekly MACD sits below zero and below its signal line (MACD ≈ -0.25, signal ≈ -0.19). The histogram turned more negative (≈ -0.07), which confirms downside momentum after yesterday’s tariff headlines. Therefore, trend pressure remains bearish on this timeframe.
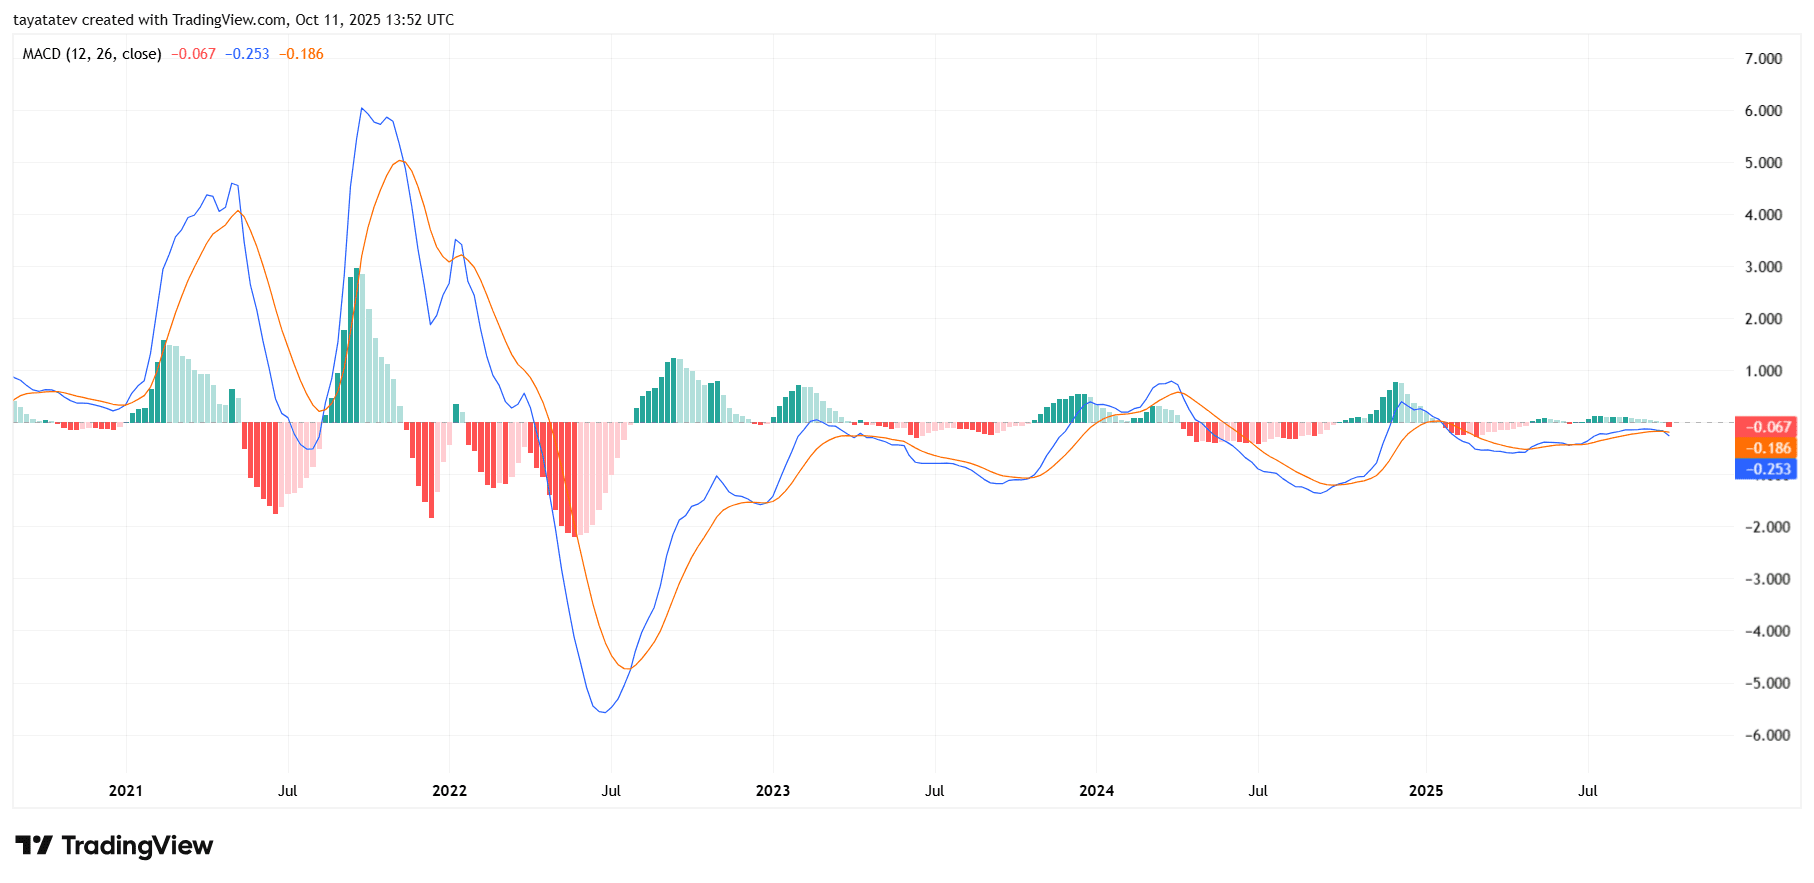
Earlier, MACD flattened near the zero line through late Q3, hinting at balance. However, the new bearish cross under zero shifts the setup from neutral to risk-off. Because this cross occurs near the baseline, even small follow-through can extend the red histogram bars over the coming weeks.
Going forward, watch for a bullish curl of the MACD toward the signal and a return of green histogram as the first sign of relief. Until that appears, sustained sub-zero readings argue for continued lower-high behavior in price, even if intraday bounces occur.
The Balance of Power (BoP) reads -0.24, so sellers currently hold the tape. After the tariff shock, pressure shifted quickly, and BoP slid below zero, confirming distribution rather than accumulation on the weekly timeframe.
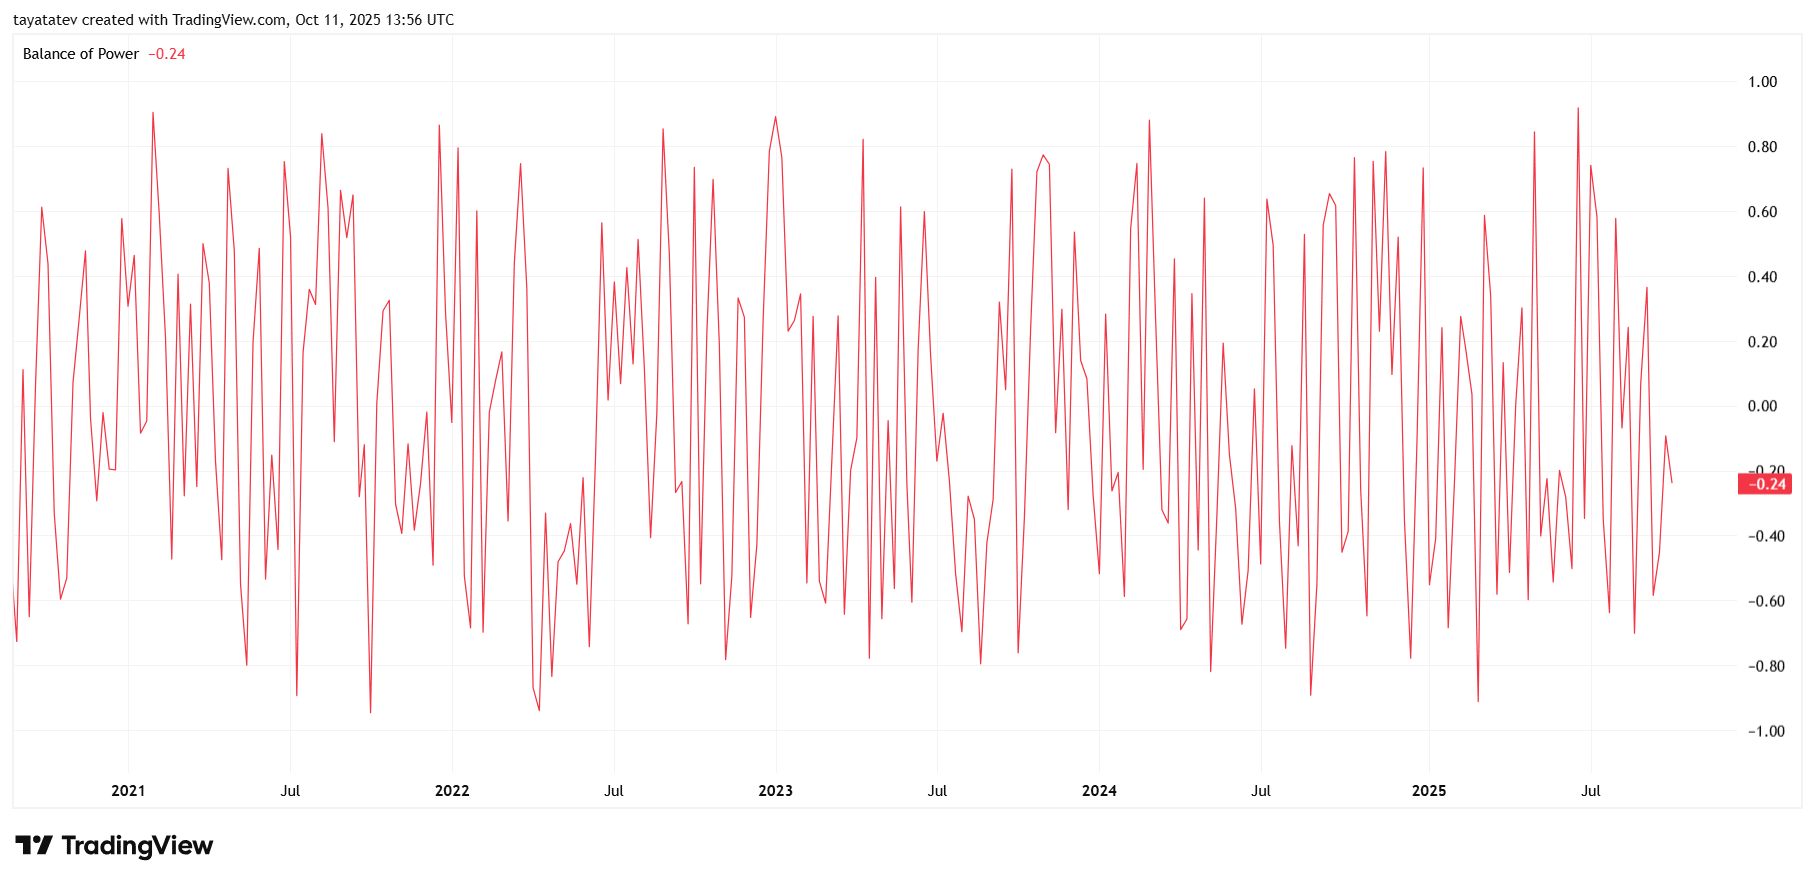
However, the print is moderately negative, not extreme. On this chart, deeper washouts have often appeared when BoP spikes to -0.6 or lower before meaningfully rebounding. Therefore, room remains for further supply before strong dip-buying shows up, even if price chops intrawEEK.
Going forward, watch the zero line. If BoP grinds back to 0.0 → +0.2 and holds, control rotates toward buyers and accumulation resumes. If it instead sinks toward -0.5/-0.6 with expanding ranges, distribution continues despite any brief bounces.
ATOM weekly Bollinger Bands signal volatility break
ATOM closed below the lower Bollinger Band (~$3.50) after yesterday’s tariff shock, while the band basis sits near ~$4.36. This close outside the envelope flags a volatility break and confirms downside pressure on the weekly timeframe.
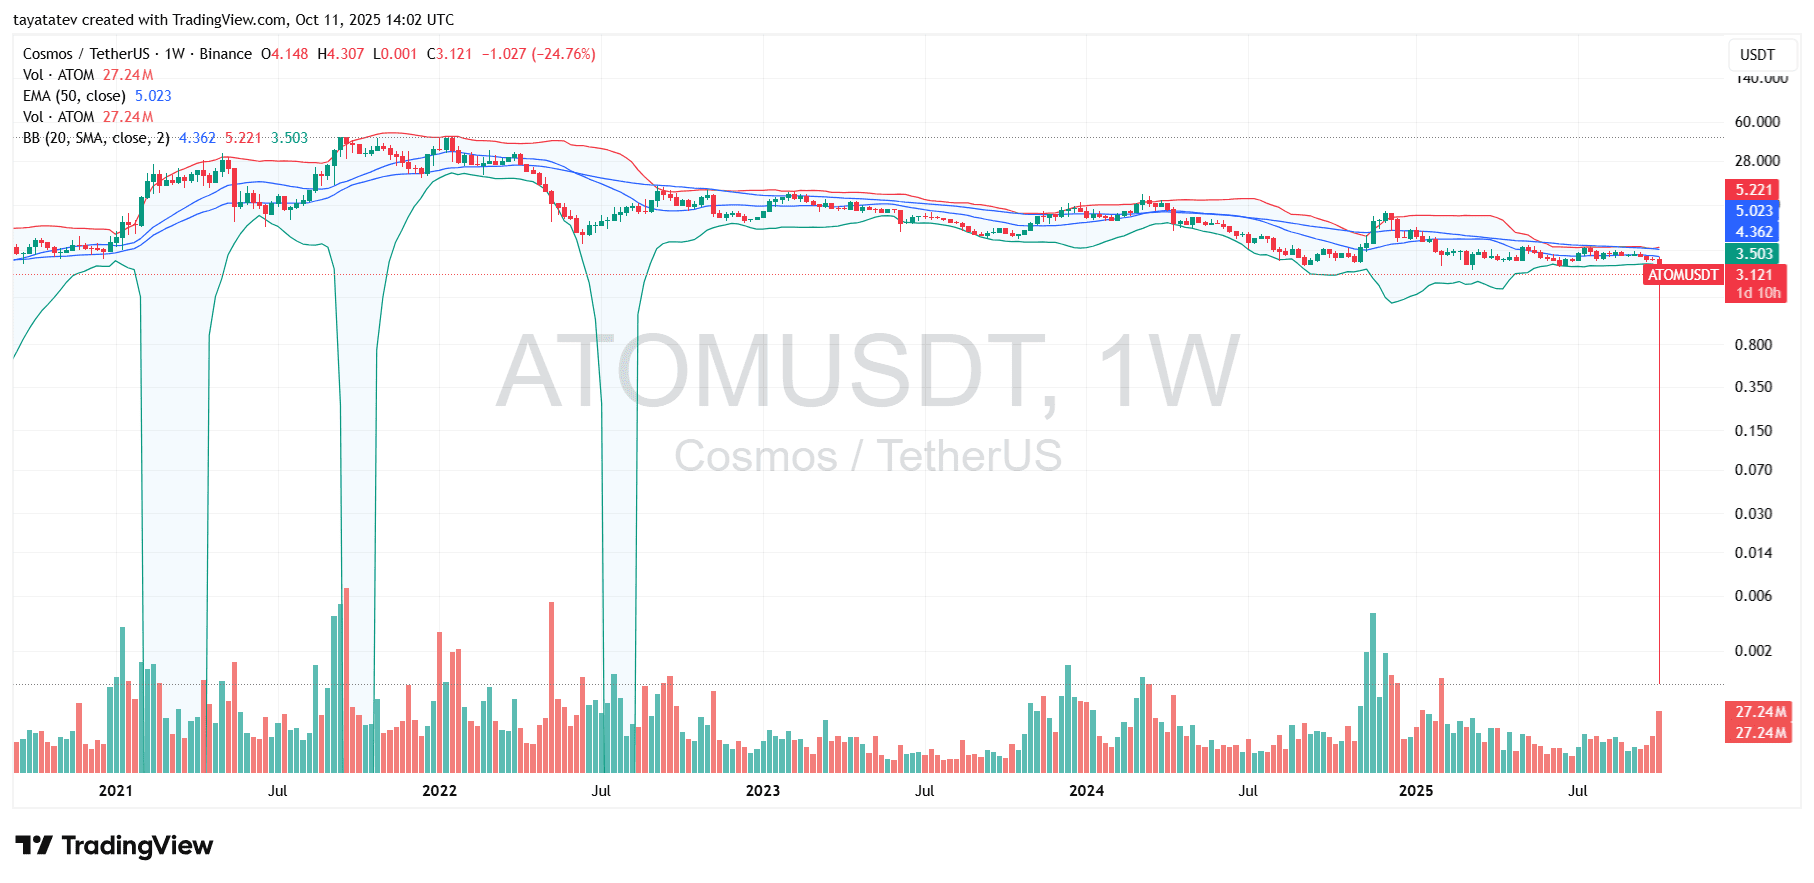
Moreover, the bands are beginning to widen after months of relative compression. Expanding bands usually follow large moves and often keep volatility elevated for several candles. Therefore, risk increases for extended ranges and further tests near the band’s lower edge before any durable mean reversion.
However, Bollinger logic still points to the middle band (basis) as magnet once selling exhausts. If candles reclaim the lower band and then push toward the basis, momentum would shift from capitulation to stabilization. If price instead rides the band lower with consecutive closes outside it, the move transitions from an overshoot to a trend leg.
ATOM flash pump turns $1,000 into $3 million in 30 minutes
A Binance trading glitch turned into a windfall for one ATOM trader. On the 15-minute chart, ATOM wicked down to $0.001 before snapping back above $3, creating a 306,000% pump. The move happened during the sharp tariff-driven sell-off, when liquidity evaporated across order books.
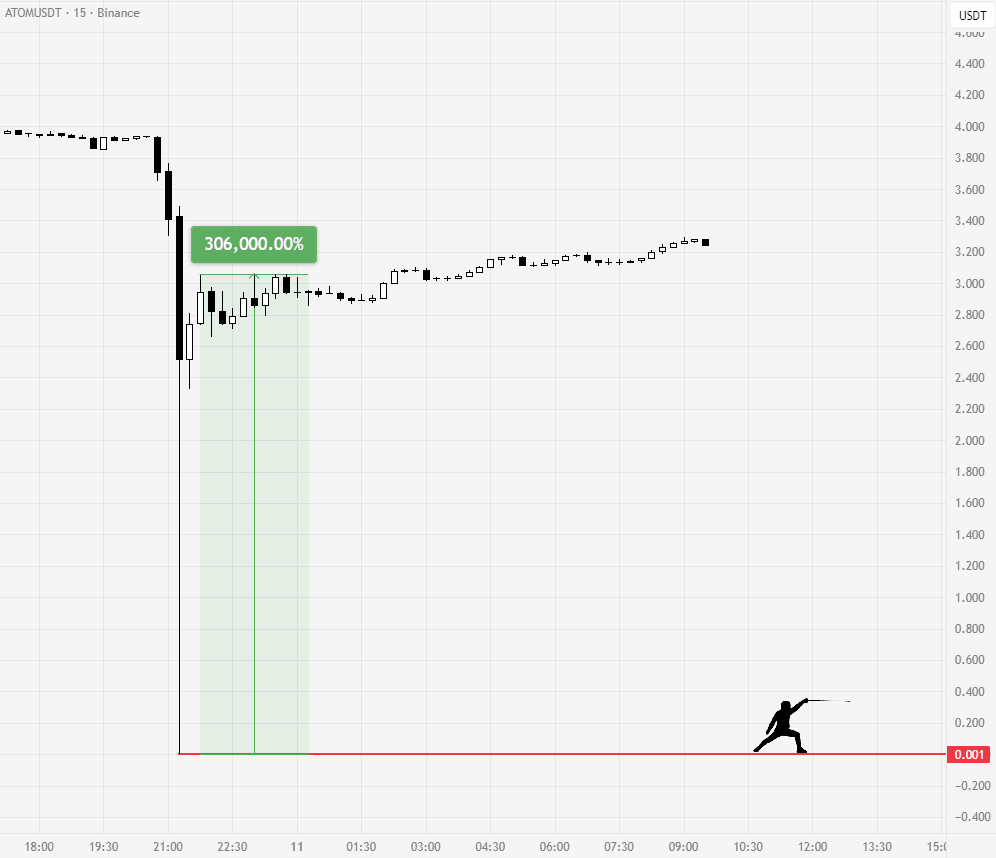
As the wick formed, an opportunistic buyer scooped ATOM at the bottom. Within minutes, the price rebounded to pre-crash levels, multiplying the position’s value by over 3,000x. On social media, the account “Rekt Fencer” posted a screenshot showing the rare trade, calling it “life-changing money” and highlighting the extreme volatility that followed Trump’s tariff announcement.
Such prints typically occur when cascading liquidations meet thin spot liquidity. Automated engines match orders at extreme levels, and the resulting candles expose structural fragilities in volatile markets. While rare, these moments show how sudden shocks can produce both wipeouts and extraordinary gains for traders positioned on the right side.