
SBI Ripple Asia and Tobu Top Tours signed a memorandum to build tokenized payments and NFT engagement on the XRP Ledger. The plan targets travel and retail merchants across Japan. The partners frame a first-half-2026 service launch.
Tobu Top Tours will recruit merchants and run NFT-based marketing. Meanwhile, SBI Ripple Asia will handle issuance and payment rails on XRPL. The scope covers accommodation, dining, and shopping.
The pilot aims to test spend incentives and digital vouchers during tourism campaigns. It also positions XRPL rails for retail settlement at scale. Coverage today confirms the division of roles and the initial timeline.
RLUSD snapshot: supply clusters on Ethereum, holders concentrate on XRPL
Ripple’s RLUSD shows a split footprint. Around 88% of circulating supply sits on Ethereum venues. Yet roughly 85% of holders reside on XRPL, recent tallies show.
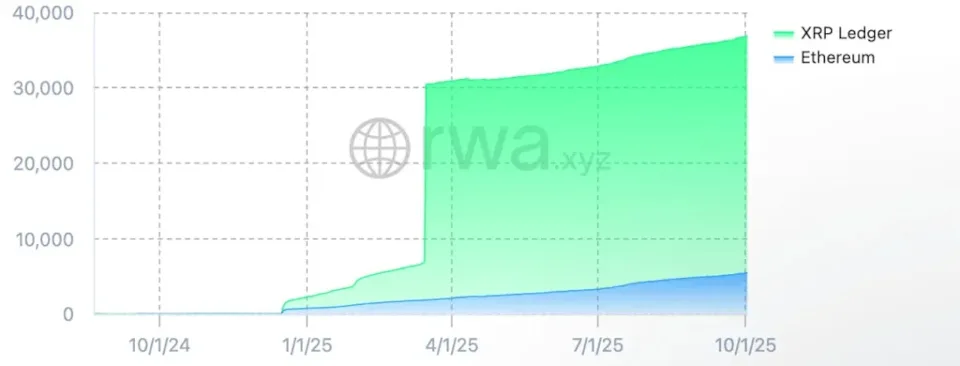
This pattern reflects Ethereum’s deep DeFi pools. At the same time, XRPL accounts host the broader holder base. Analysts describe it as a “two-chain” profile for the stablecoin.
As of early October, reports place RLUSD near the high-hundreds-million mark in market cap. The chain split remains the key distribution detail for builders integrating RLUSD flows.
Operations: default UNL migration and devnet reset
XRPL shifted the default Unique Node List to the new XRPL Foundation publisher. Node operators were instructed to migrate by September 30, 2025, to avoid trust-list issues. Full deprecation of the old list lands on January 18, 2026.
Advisories warn that nodes clinging to the old dUNL may lose connectivity. Consequently, operators need to update rippled configs to the Foundation’s key and URL. Several summaries reiterated the same deadlines last week.
Separately, XRPL scheduled a devnet reset for Friday, October 3, to prevent amendment blocking around PermissionDelegation. The reset aligns with upstream changes in the next rippled release. The disclosure post details the rationale.
Standards: MPTokensV1 (XLS-33) goes live after 14-day window
XRPL enabled the XLS-33 Multi-Purpose Tokens amendment around October 1. The standard introduces native fungible tokens with standardized metadata and issuer controls. Community trackers noted completion of the 14-day activation phase.
The activation followed the usual >80% support requirement over two weeks. Coverage highlighted reduced need for bespoke token code on XRPL. Issuers can define supply and transfer rules at the protocol level.
Developer posts position MPTs as an evolution of trust-line tokens. As a result, builders gain simpler issuance and stronger compliance tooling. Rollout updates continue across official channels.
The chart shows XRP on a weekly timeframe breaking out in 2025 and then consolidating below the prior all-time-high band from January 2018. Price now moves inside a small, downward-sloping wedge above a reclaimed range. Labels mark “resistance flipping as support” around the high-$2 zone and another reclaimed shelf near $1.8–$2.0.
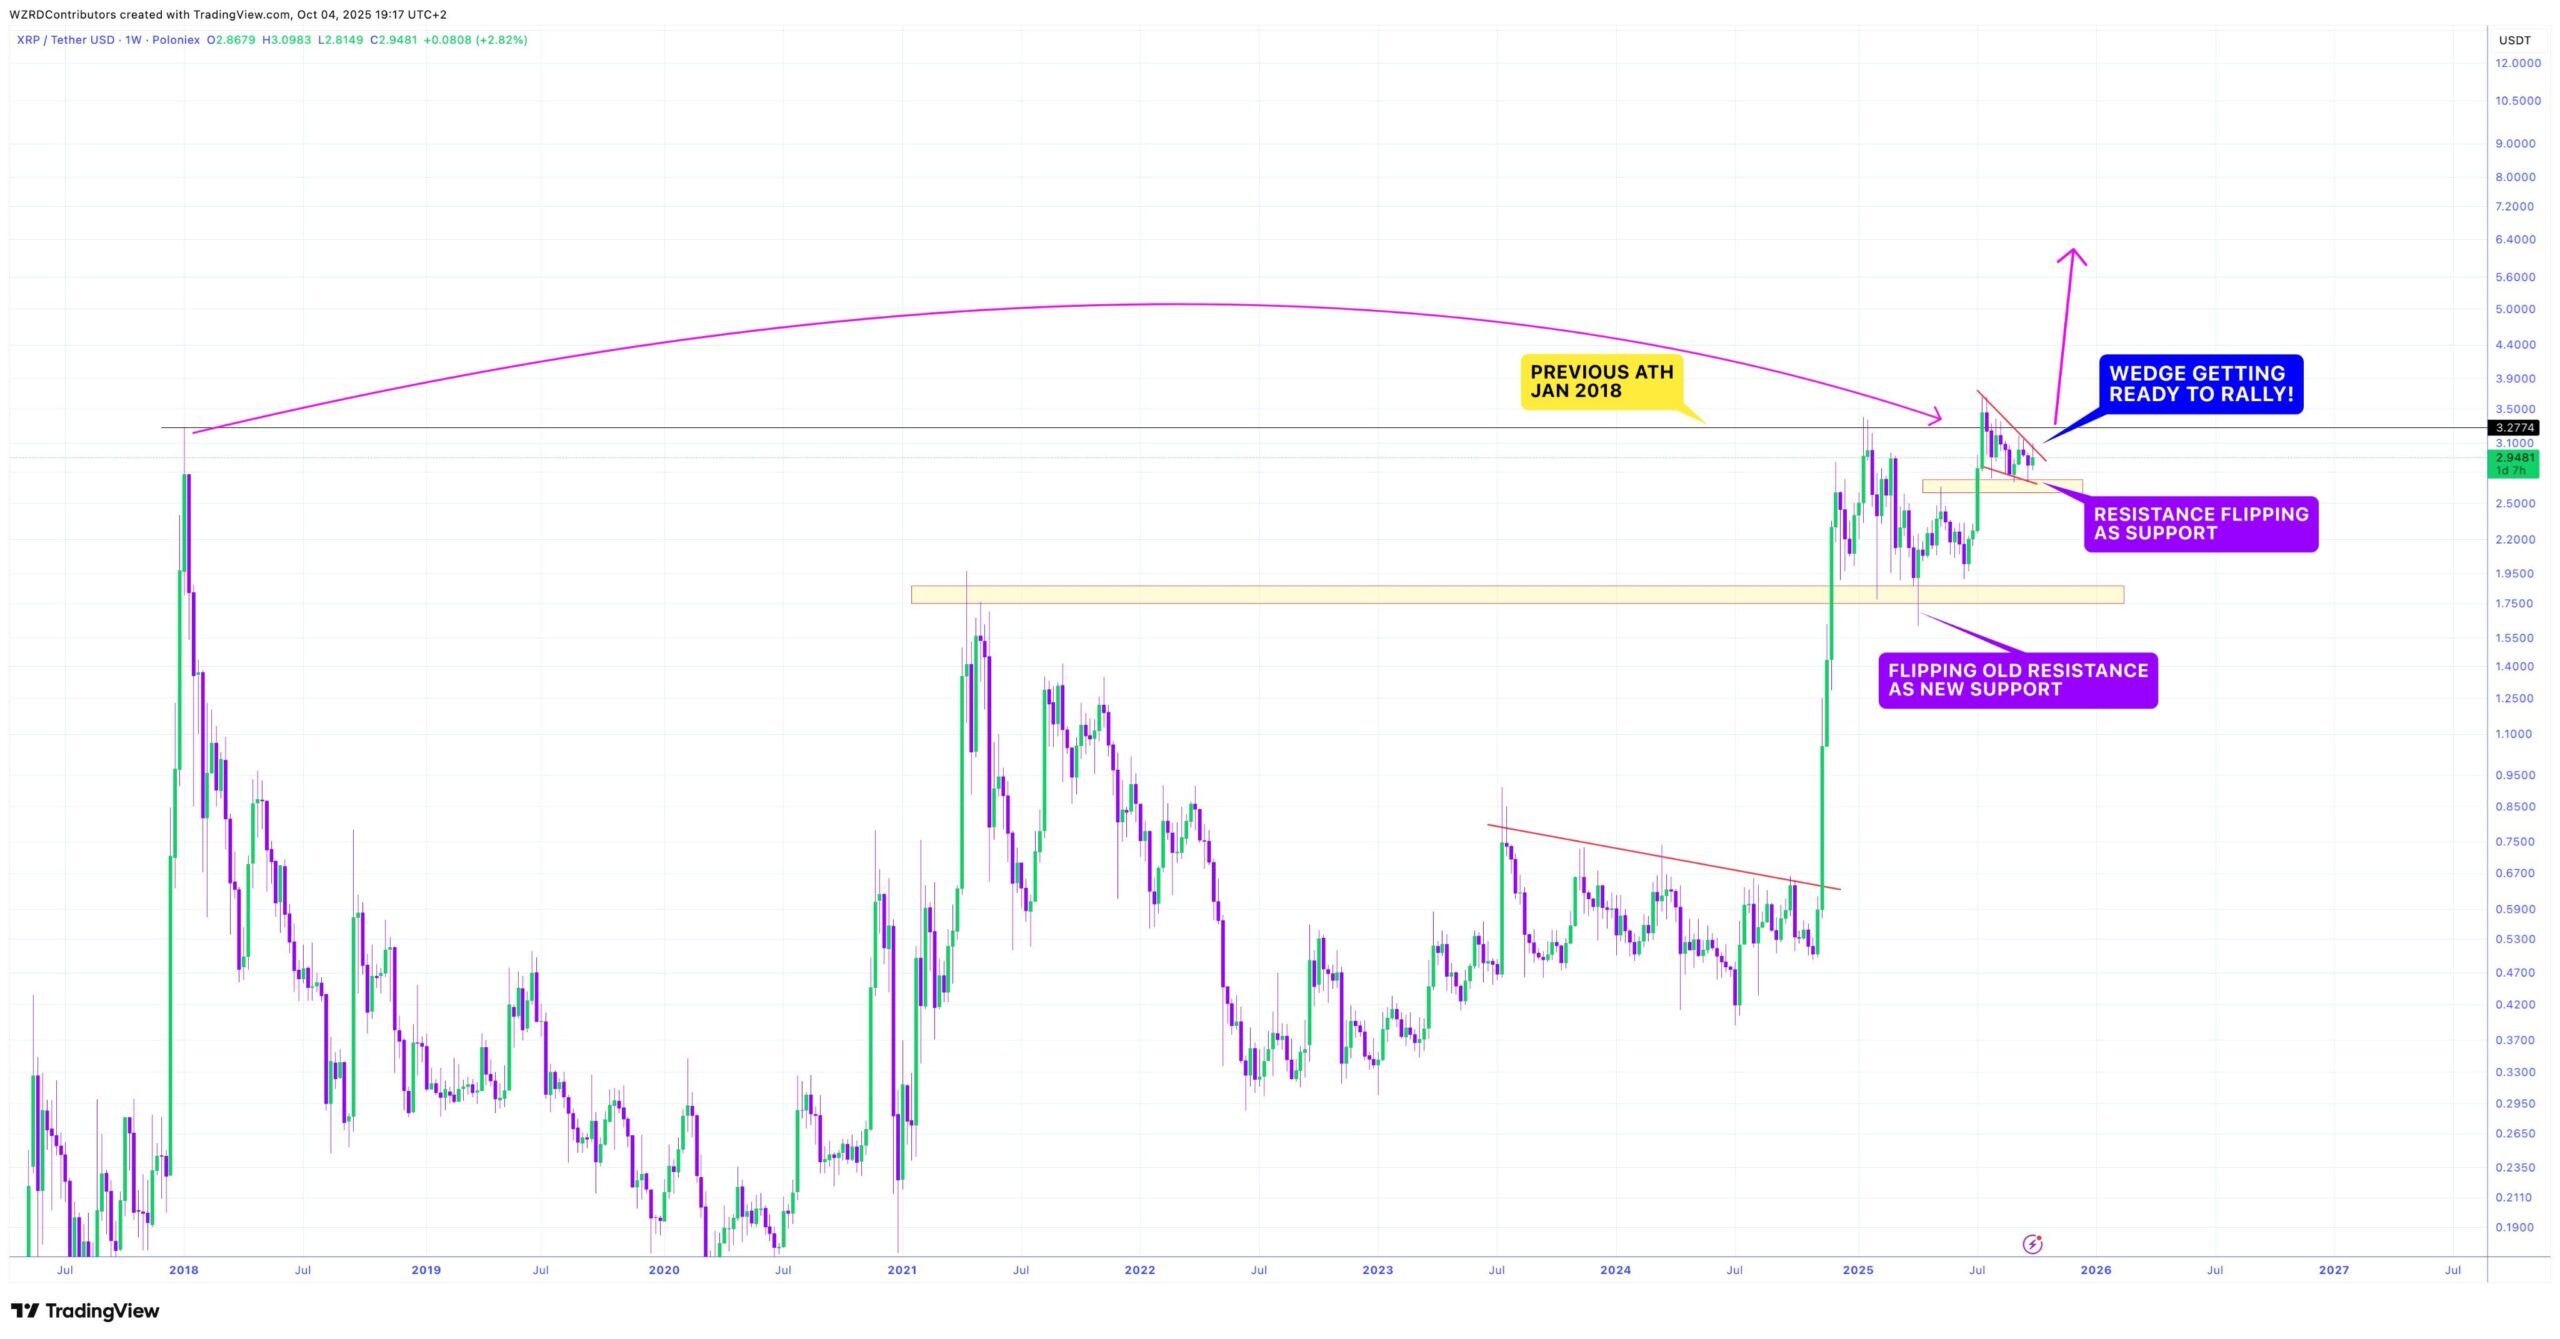
Additionally, the structure compresses against a horizontal line drawn at the old record area. The wedge connects lower highs and higher-low support, which typically reduces volatility before a directional move. Meanwhile, candles continue to close above the former breakout zone, indicating that buyers still defend the retest area.
Furthermore, the chart highlights a sequence: breakout, pullback, and base. First, price cleared long-term resistance. Then, it retested that level from above. Finally, it began coiling beneath overhead supply. This sequence often precedes trend continuation when support holds; however, a loss of the reclaimed shelves would instead point to deeper mean reversion.
In terms of checkpoints, the wedge top and the prior-high band form immediate resistance. A weekly close above both would confirm expansion and open room toward untested higher levels on the chart. Conversely, a weekly close back below the high-$2 support would invalidate the reclaim and shift focus to the $1.8–$2.0 area noted on the graphic.
Context matters as well. The move that preceded this consolidation erased a multi-year descending line, shown on the left of the chart. Because that break came with large candles, markets often pause to digest gains. Thus, the current coil functions as a test of trend strength and a filter for weaker hands before the next decisive leg.
XRP daily chart: bullish flag sets a 57% measured move to about 4.76
XRP/USD has carved a bullish flag on the daily chart. Price surged in a near-vertical “pole” in July, then drifted lower inside a tight, downward-sloping channel bounded by two parallel lines. That channel formed as volume cooled and candles overlapped. Now price presses the upper flag line after reclaiming the 50-day exponential moving average near 2.94, so momentum tilts back to buyers.
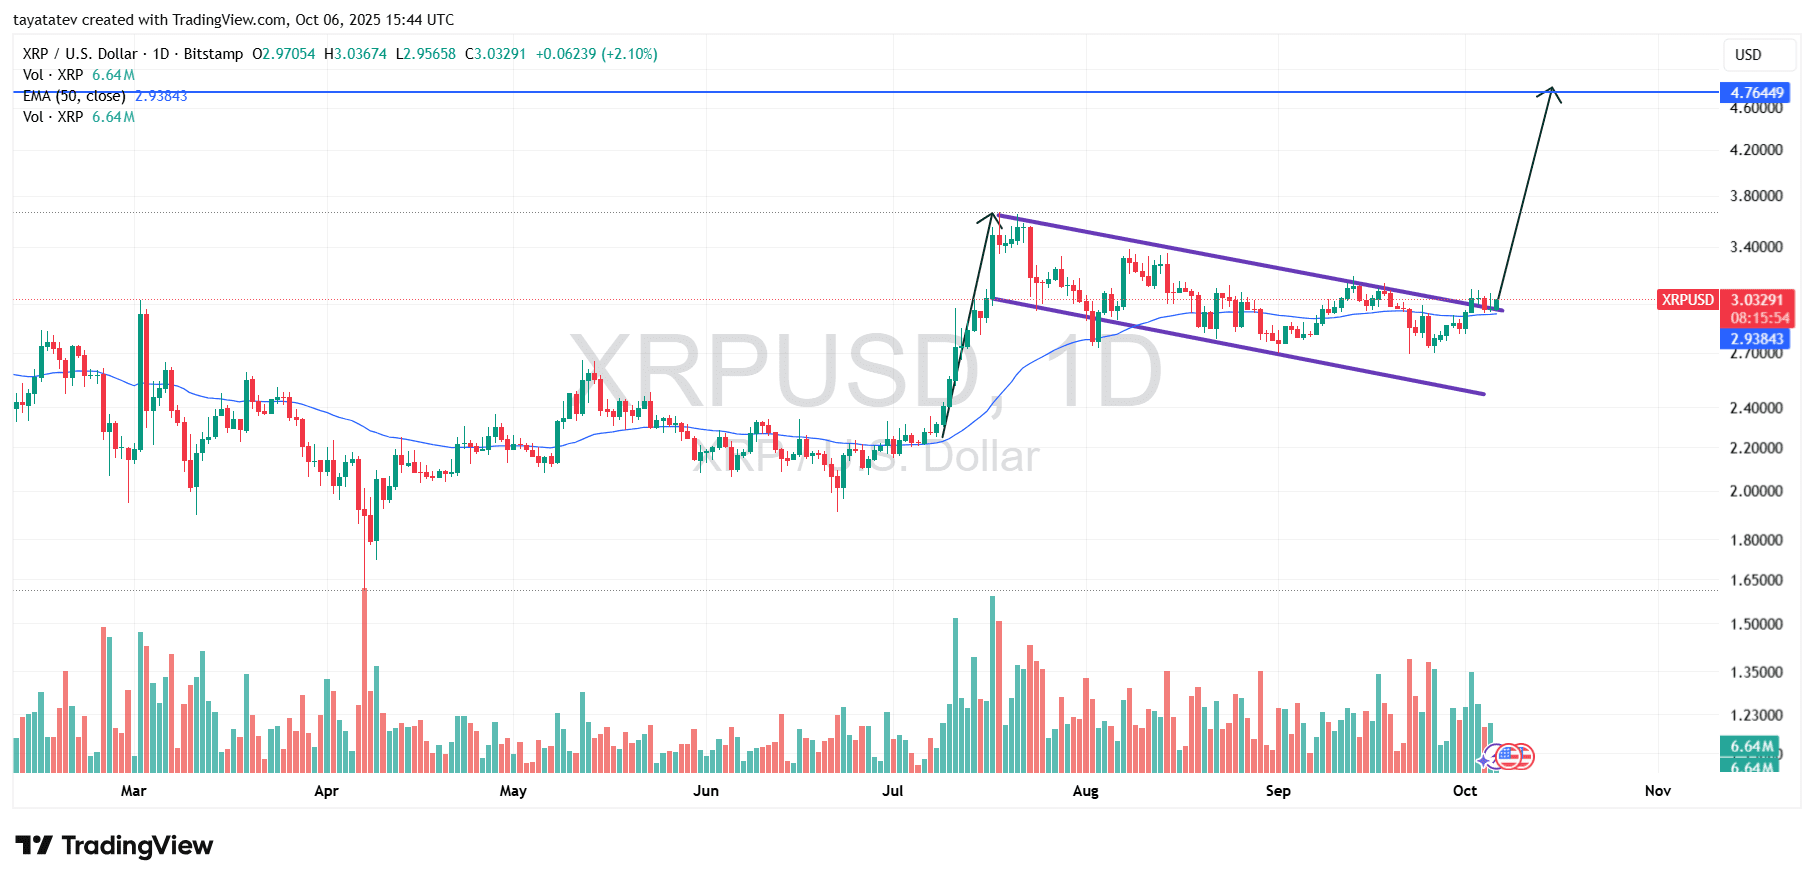
A bullish flag is a continuation pattern. First, an impulsive rally creates the pole. Then, a brief counter-trend channel or wedge “flags” lower while giving back only a small portion of the advance. Finally, confirmation occurs when price breaks and closes above the flag’s top boundary, ideally with expanding volume. Because the flag usually travels against the prior move, a topside break signals that the prevailing uptrend has resumed.
If XRP confirms a breakout with a daily close above the flag, the measured move projects by adding the pole’s height to the breakout level. Using today’s spot near 3.03 United States dollars, a 57 percent target implies approximately 4.76 United States dollars (3.03 × 1.57 ≈ 4.76). The horizontal objective on the chart aligns with that area, which also sits near prior supply, so traders will watch reactions there.
Price action supports the setup. The flag’s slope is modest, real bodies remain mostly above the 50-day exponential moving average, and dips keep finding buyers before the lower channel line around the high-2.70s. Moreover, the latest push tested and briefly pierced the flag top, which often precedes a decisive close if follow-through volume appears. A strong close above the flag would validate the continuation case and open room toward the 4.60–4.80 band.
Risk still exists. Without a firm close above the flag, the pattern remains unconfirmed and the market can keep ranging. A daily close back below the 50-day exponential moving average would shift focus to the lower boundary of the channel and delay the move. However, as long as XRP holds above the reclaimed average and continues to print higher intraday lows, the path of least resistance points to an upside resolution and a measured target near 4.76 United States dollars.
XRP daily MACD: bullish crossover rebuilds momentum
The Moving Average Convergence Divergence (MACD) on the daily chart has turned higher. The MACD line has curled above the signal line in early October after spending September below it. At the same time, the histogram has flipped green and now prints small positive bars, which shows momentum shifting back to buyers.
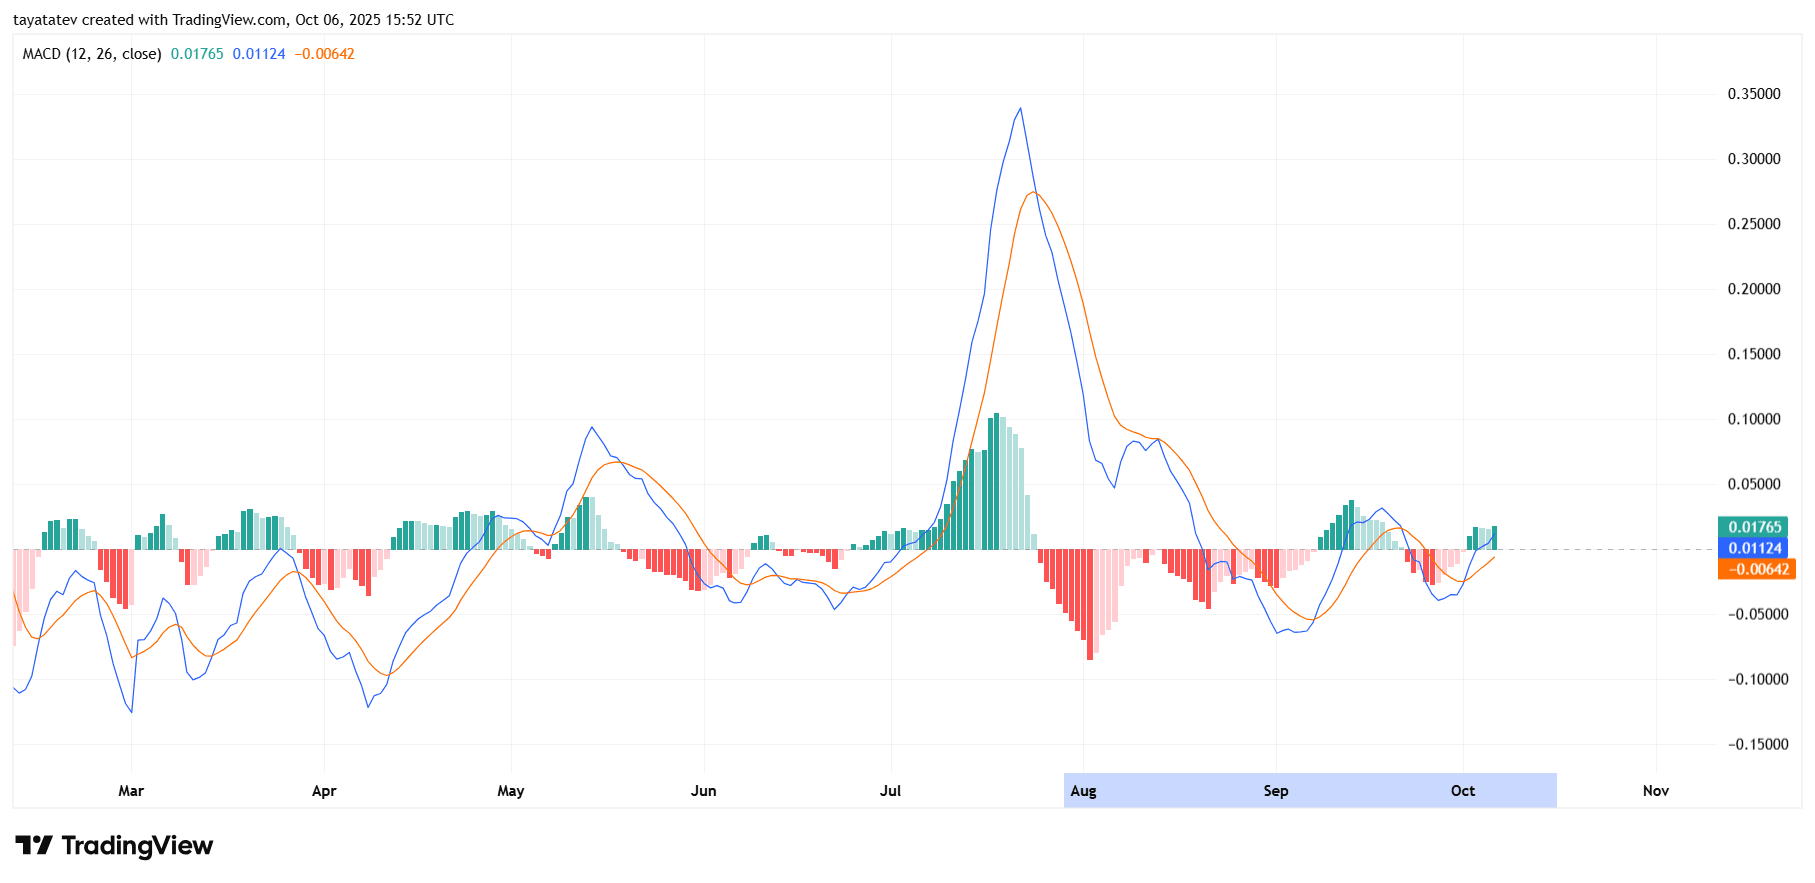
This turn follows a deep August downswing that pushed both lines from a July spike back through the zero line. However, bearish momentum faded through September as the red histogram bars shrank toward zero. Then momentum stabilized, and the latest crossover arrived just as price reclaimed the 50-day exponential moving average, reinforcing the improving tone.
Now the focus sits on the zero line. Because the MACD and signal hover near zero, a sustained move above it would confirm a regime change from corrective to trending. If the histogram continues to build taller green bars while price holds above the 50-day average, upside follow-through becomes more likely. Conversely, if the lines roll over and cross back down, momentum would reset and extend the consolidation. For now, the indicator supports the bullish flag breakout case by showing fresh, albeit early, positive momentum.
XRP daily RSI: momentum rebuilds above the midline
The 14-period Relative Strength Index stands near 56.6 while its signal average sits around 48.3. RSI has reclaimed the 50 midline after September churn, which signals improving upside momentum. The signal average has turned up as well, confirming a short-term shift in bias.
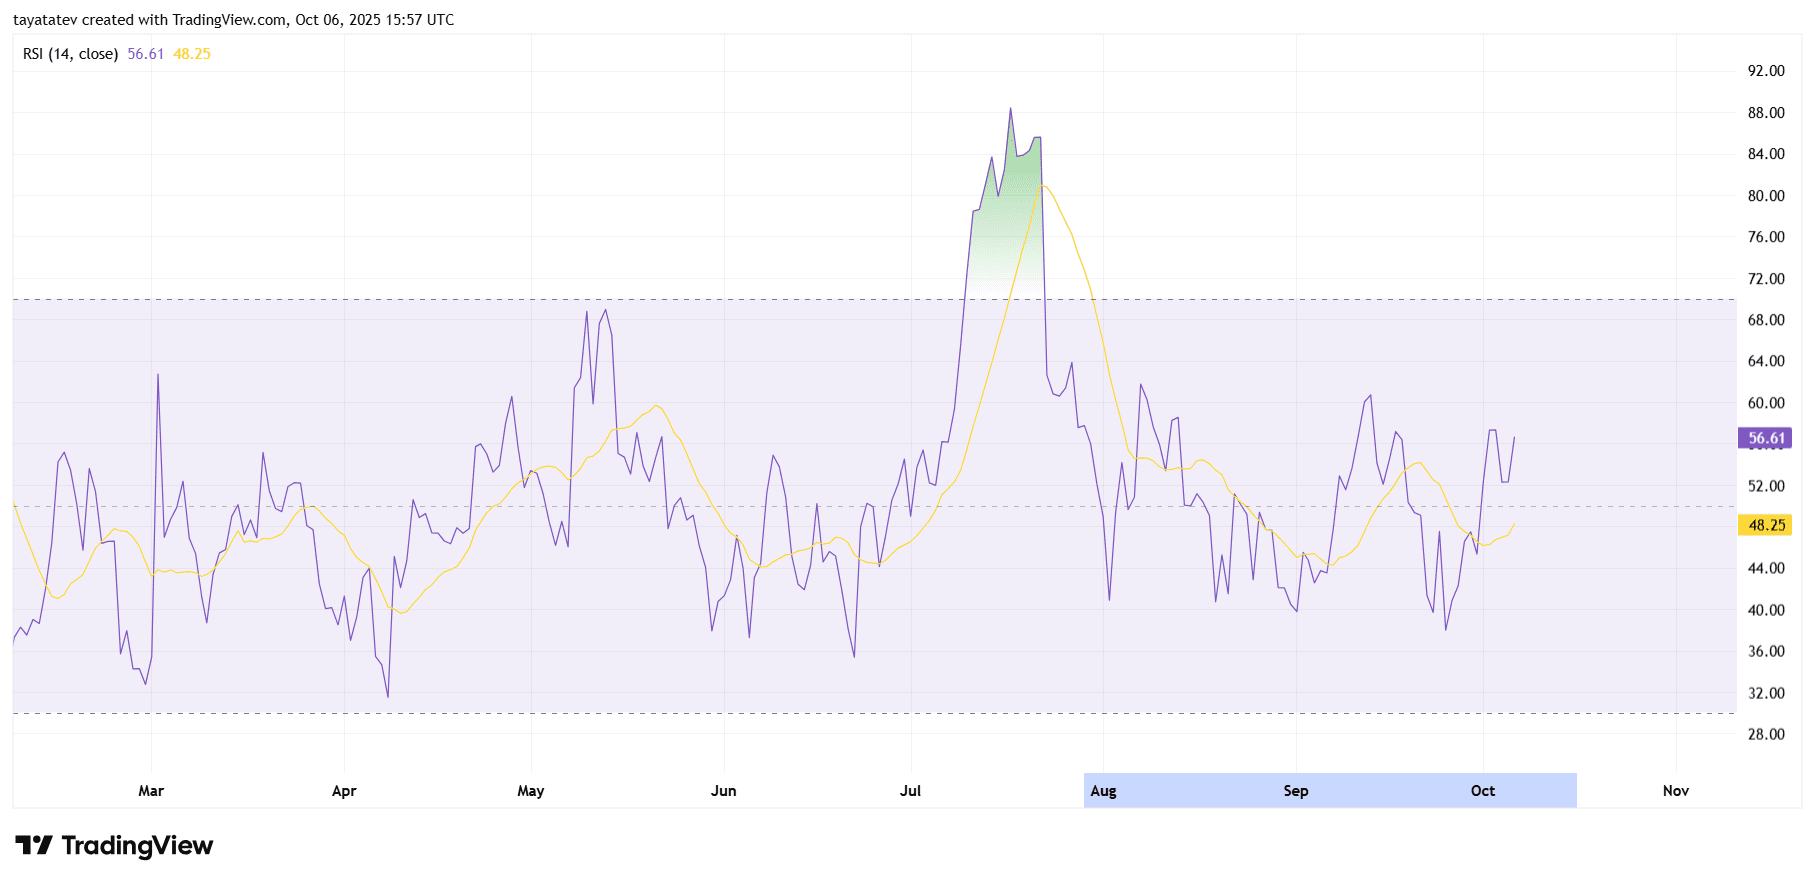
Earlier, RSI spiked into overbought territory in late July, then unwound through August into the low-40s. That reset cleared excess without breaking the broader uptrend. Since late September, RSI has printed higher lows and now holds above the midline, a zone that often supports trend continuation.
From here, sustained closes with RSI holding 50–60 would support the bullish flag breakout case on price. Because RSI remains below the overbought band at 70, it still has room before reaching typical exhaustion levels. However, if RSI slips back under 50 and the signal average rolls over, momentum would fade and the consolidation could extend. For now, the indicator tilts positive and aligns with a constructive daily structure.