
Sei bounced from the lower boundary of its established trading channel, showing signs of defending support near $0.27. This move came after several retests of the same level in September, reinforcing it as a strong demand zone. The rebound coincides with an uptick in momentum, as buyers pushed price back toward the midrange around $0.28.
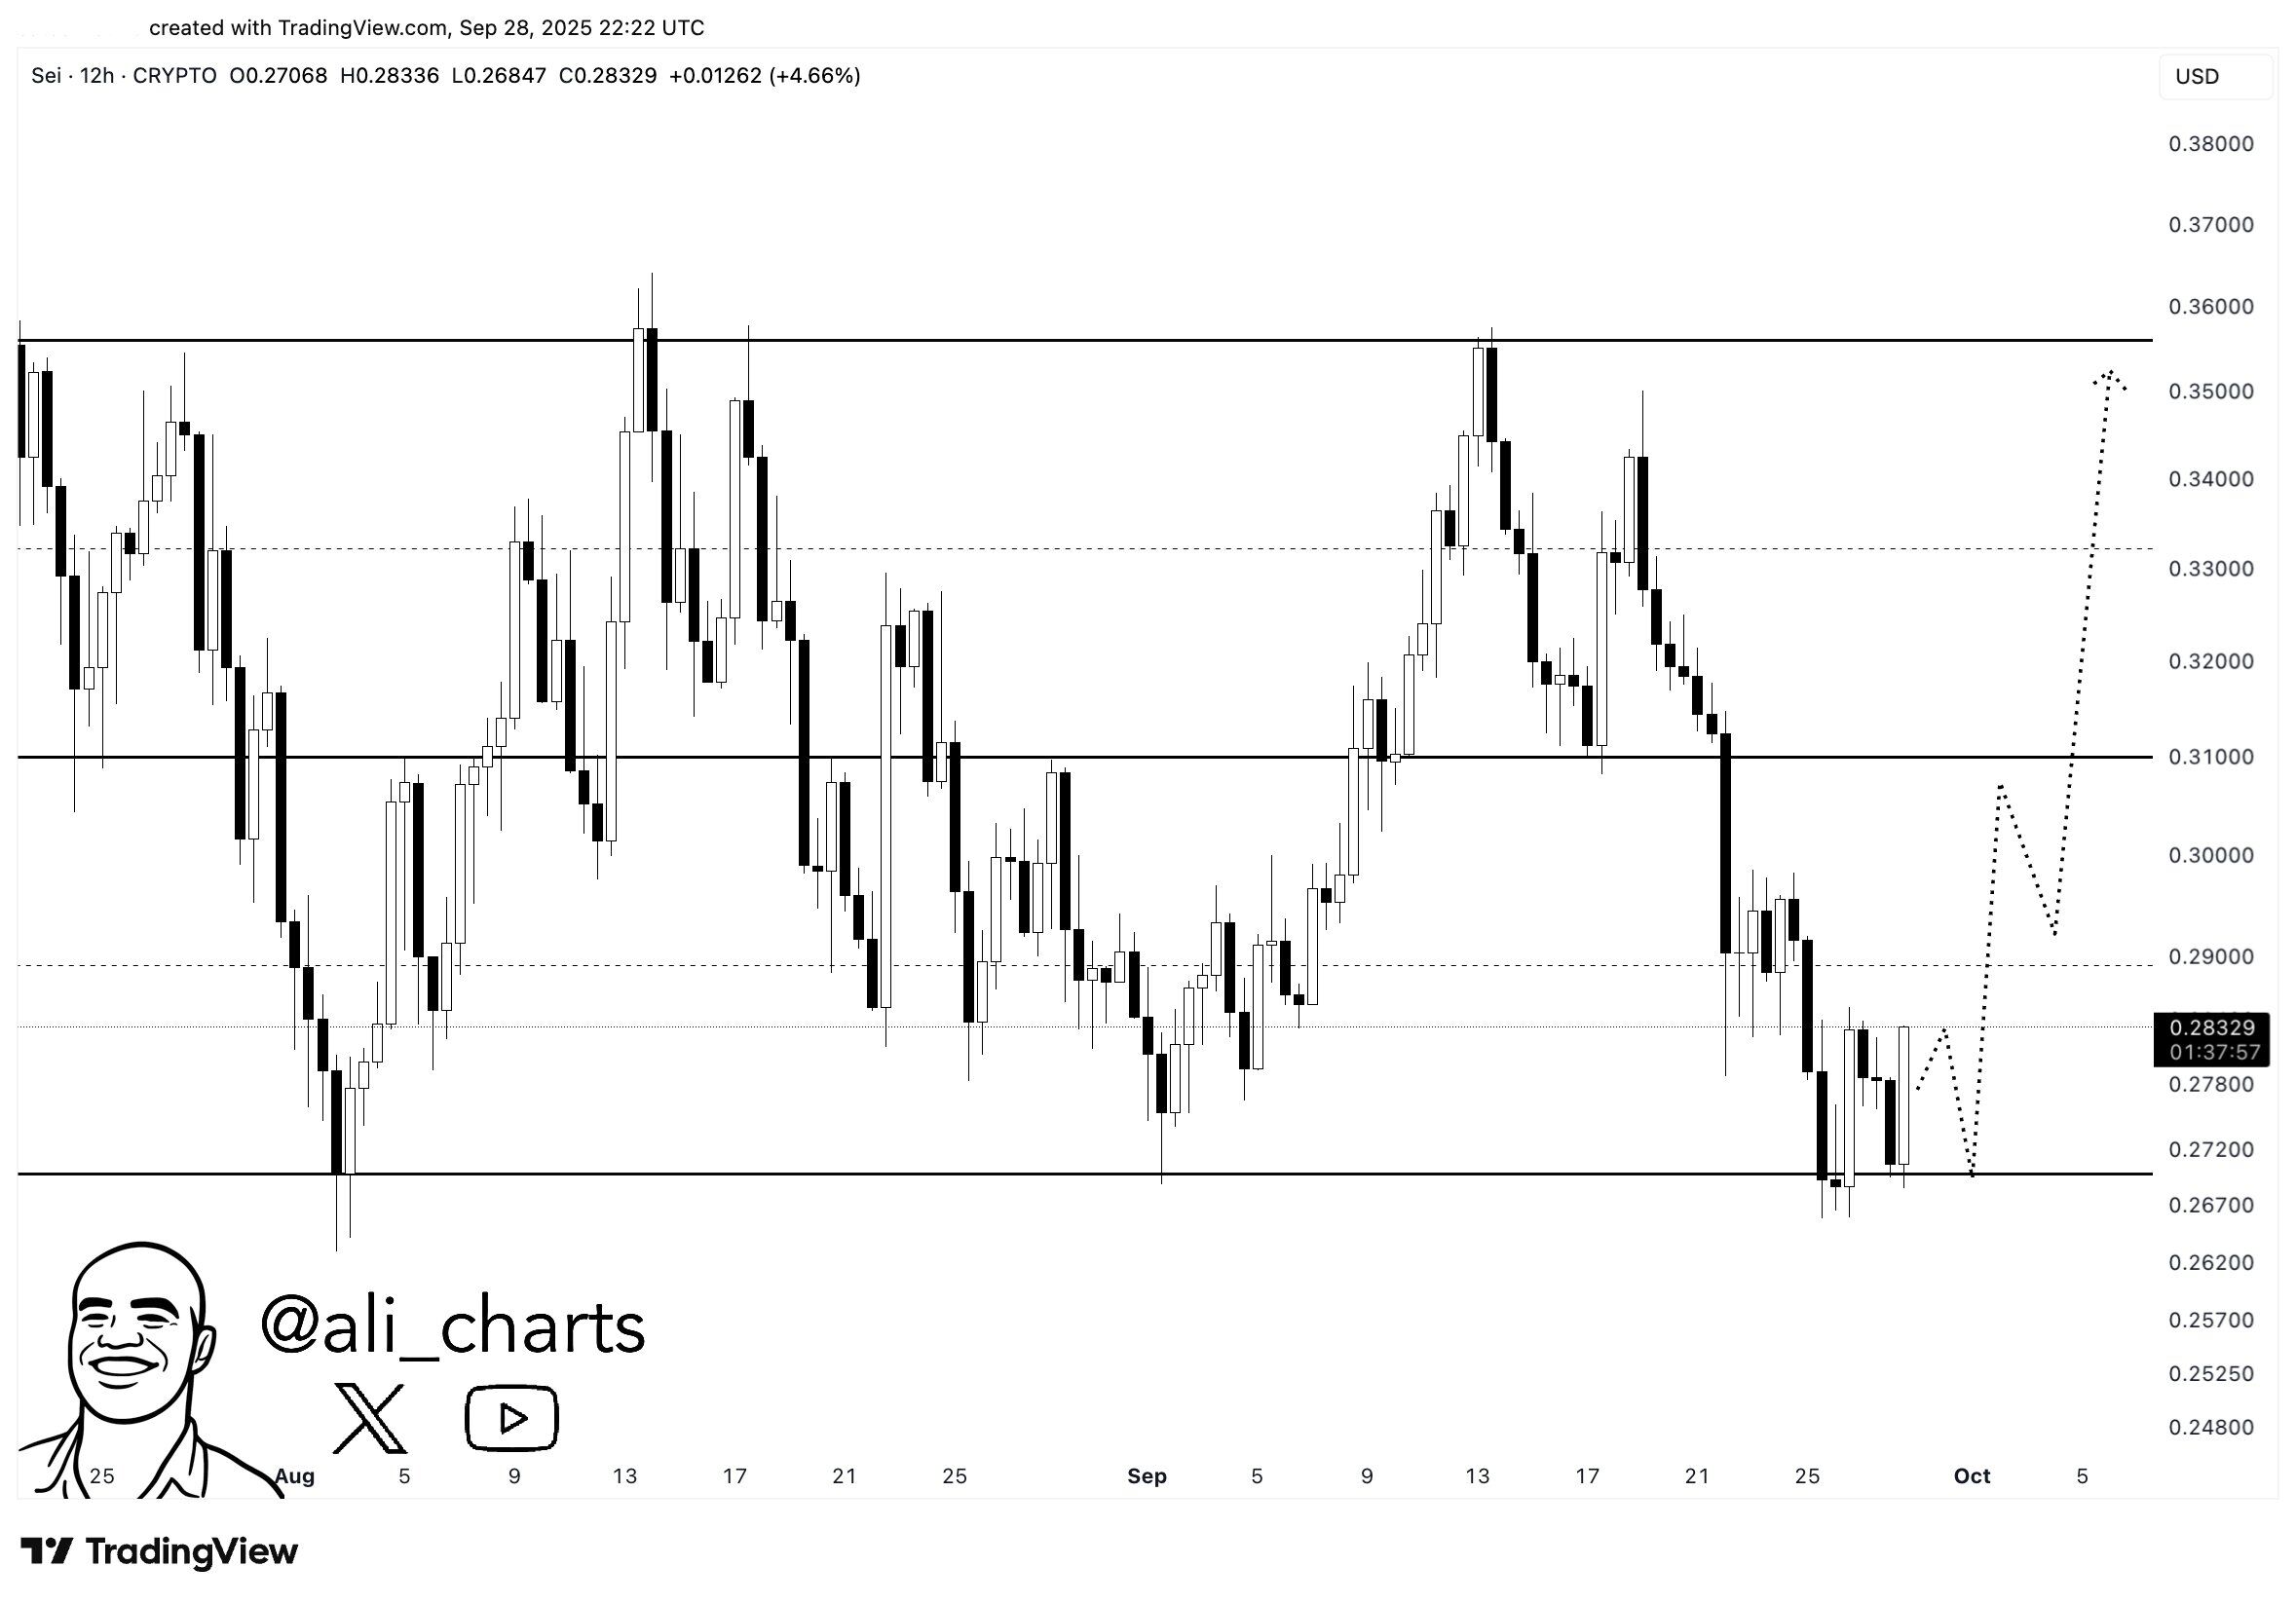
If Sei maintains this level, it could challenge the $0.29–$0.30 area where prior breakdowns occurred. A decisive break above this zone would open the path toward the $0.31 resistance, which previously acted as a pivot for trend continuation. Sustained strength could extend the move toward the $0.34–$0.35 region, which is the upper channel boundary and Ali’s projected target.

Conversely, failure to hold $0.27 risks another test of the lower channel. That level remains key for bulls to defend to avoid a deeper retracement toward $0.25. The chart suggests that Sei’s near-term direction hinges on reclaiming the midrange resistance with volume and momentum.
SEI Daily Accumulation Analysis
This chart by trader Minato shows Sei trading inside a clear accumulation box between $0.26 and $0.30. The red zone highlights heavy trading activity where buyers have consistently absorbed selling pressure. Today, Sei sits near the middle of this zone, signaling an ongoing consolidation phase.
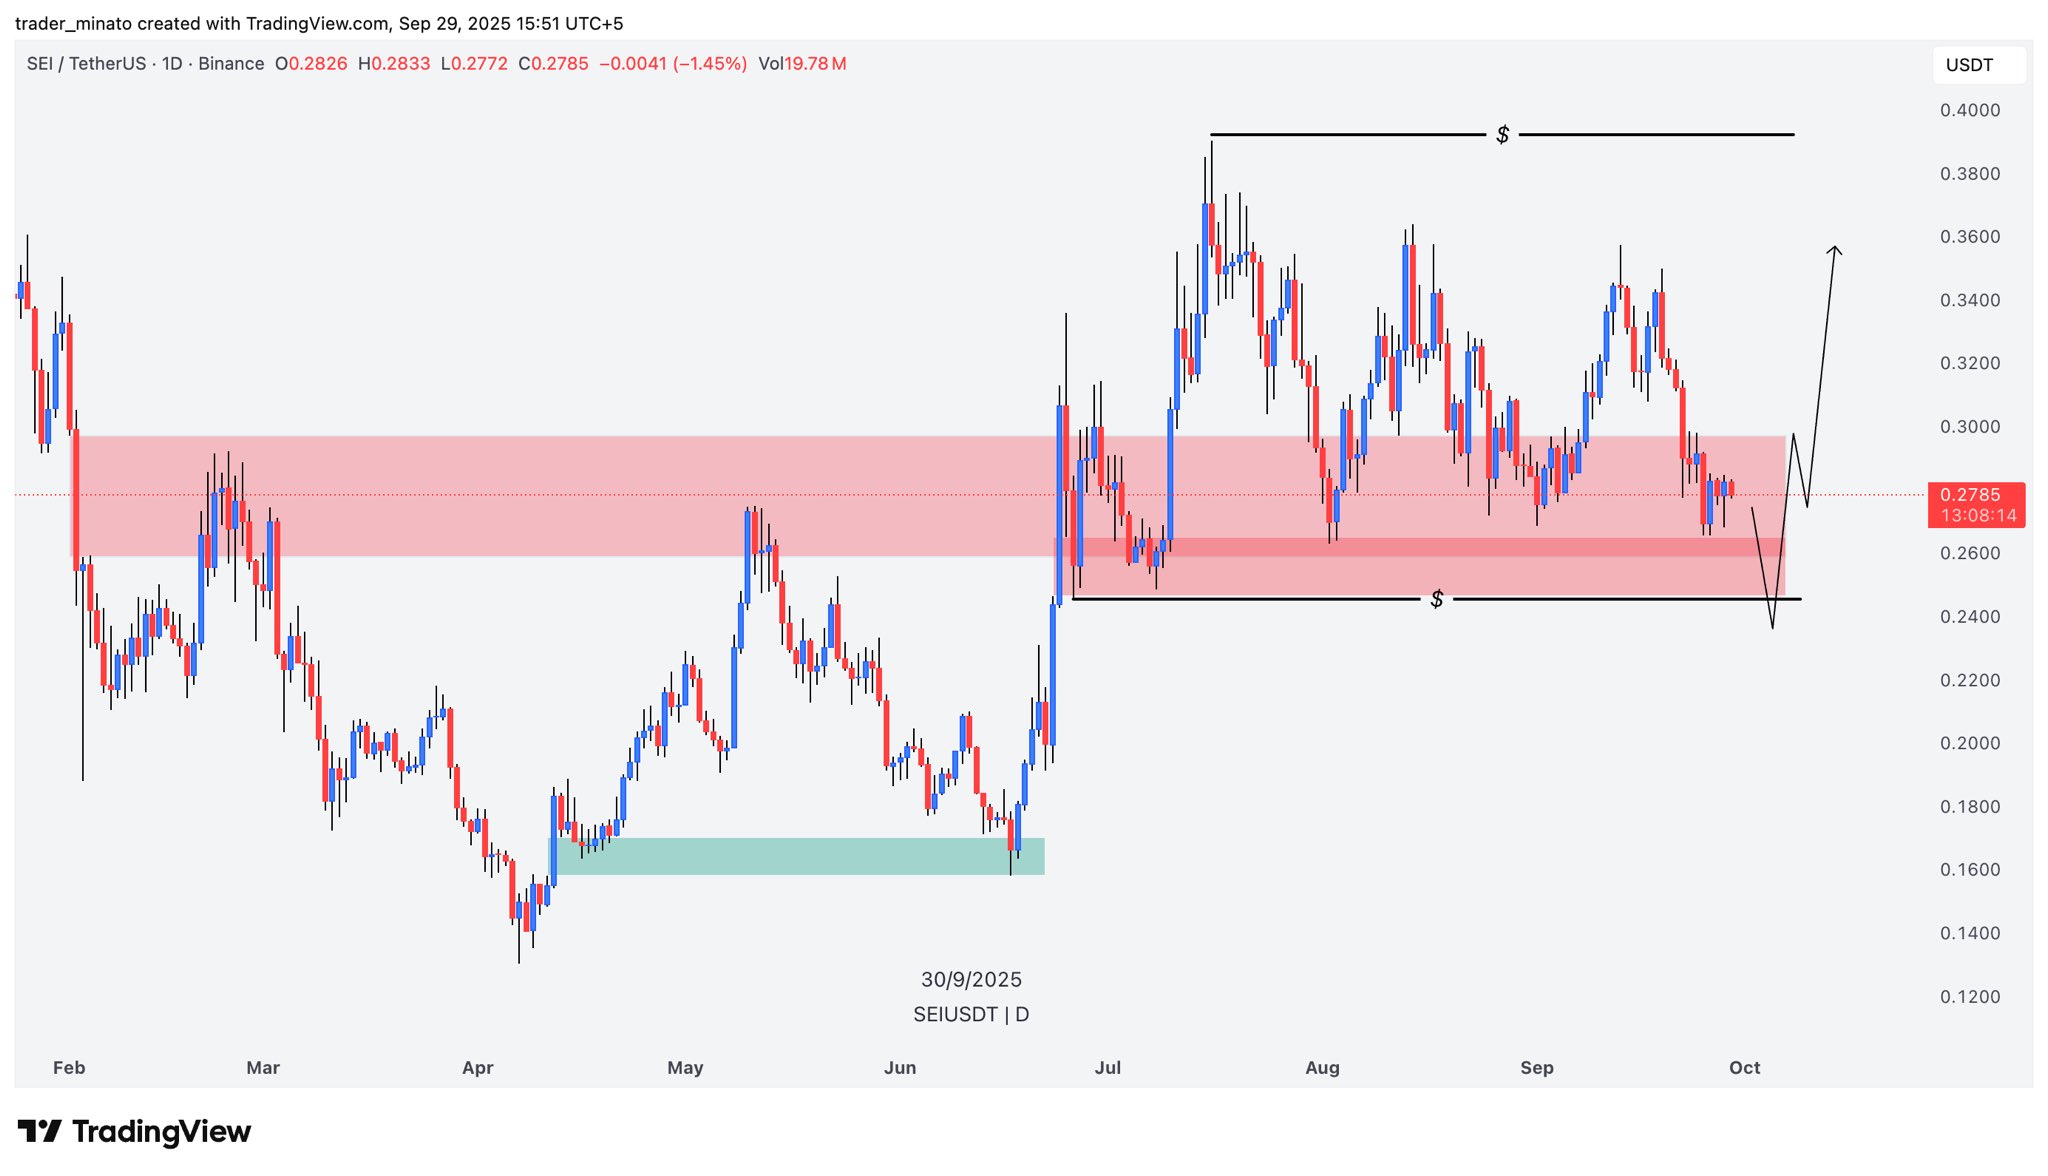
The price action suggests a build-up for a potential upside breakout. If Sei holds above $0.27 and regains $0.29–$0.30, momentum could carry it toward $0.33–$0.36, which is the upper resistance range seen after July’s breakout. A confirmed close above $0.30 would strengthen the bullish case and mark the first real shift back toward higher levels.
However, if Sei slips under $0.27 again, sellers could retest $0.26, and a failure there risks a sweep toward $0.25 before buyers reassert control. This zone remains key for deciding whether the next strong move is an upward breakout or a deeper retest lower.
SEI Rising Channel Setup — September 29, 2025
Sei/USD trades inside a rising channel on the daily chart, with price hovering near $0.277 at today’s session open. The pattern formed after July’s acceleration and has guided a series of higher lows and higher highs into late September. A rising channel is an upward-tilting range bounded by two parallel lines that act as dynamic support and resistance while price oscillates between them. Because Sei now sits just below the 50-day exponential moving average near $0.302, the next objective is to reclaim that moving average and then press toward the channel’s upper boundary around the low-$0.40 area visible on the chart.
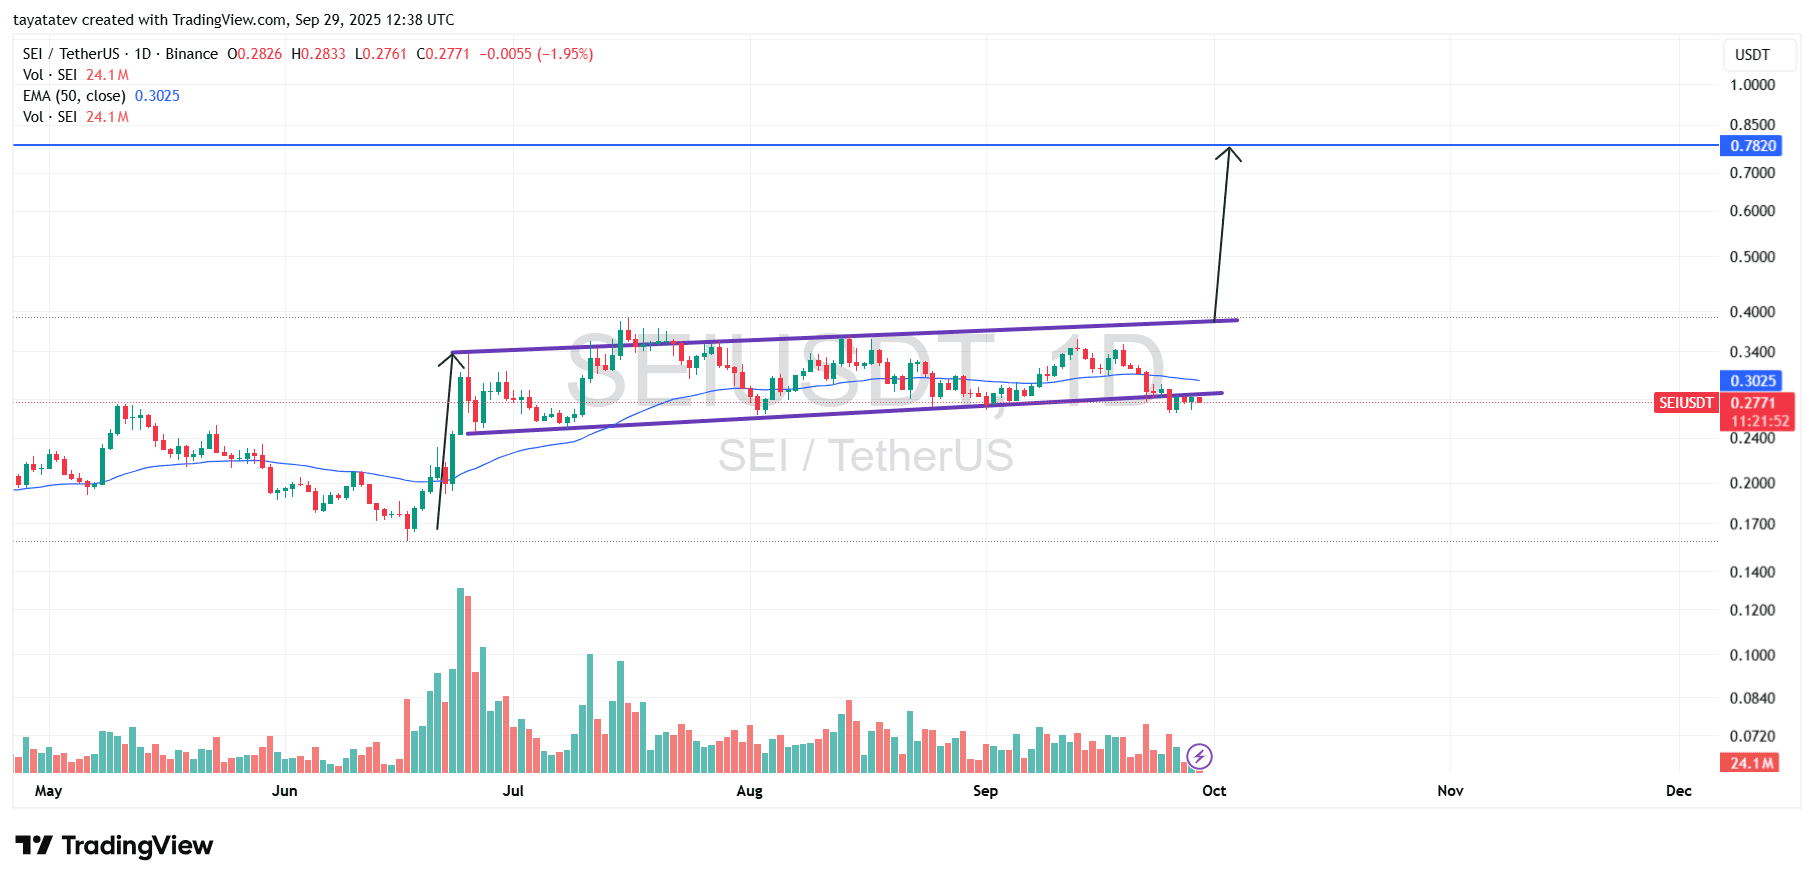
Momentum favors the bulls if buyers convert the $0.30 region into support with a strong daily close and follow-through. In that case, a confirmed breakout above the channel’s ceiling would unlock the larger measured scenario discussed on the chart: a move of about 186 percent from the current level, projecting to roughly $0.79 (0.2771 × 2.86 ≈ 0.7925). That path would require acceptance above prior supply pockets that capped August and September advances, along with expanding volume to validate trend continuation.
However, the setup still demands defense of the channel floor. If price fails to reclaim the 50-day exponential moving average and loses the lower boundary, sellers can drag Sei back into the mid-$0.20s where July’s base began. Until the breakout or breakdown confirms, the channel remains the operative structure, and the market will continue to rotate between its rails while it builds energy for the next directional move.
SEI RSI Read — September 29, 2025
Sei’s 14-period relative strength index sits near 40, while its RSI signal average hovers around 46. Momentum leans soft because the oscillator remains below the neutral 50 line and below its own average. However, it is not oversold; the usual exhaustion zone begins closer to 30. Therefore, sellers control the pace, but downside energy has not reached a blow-off.
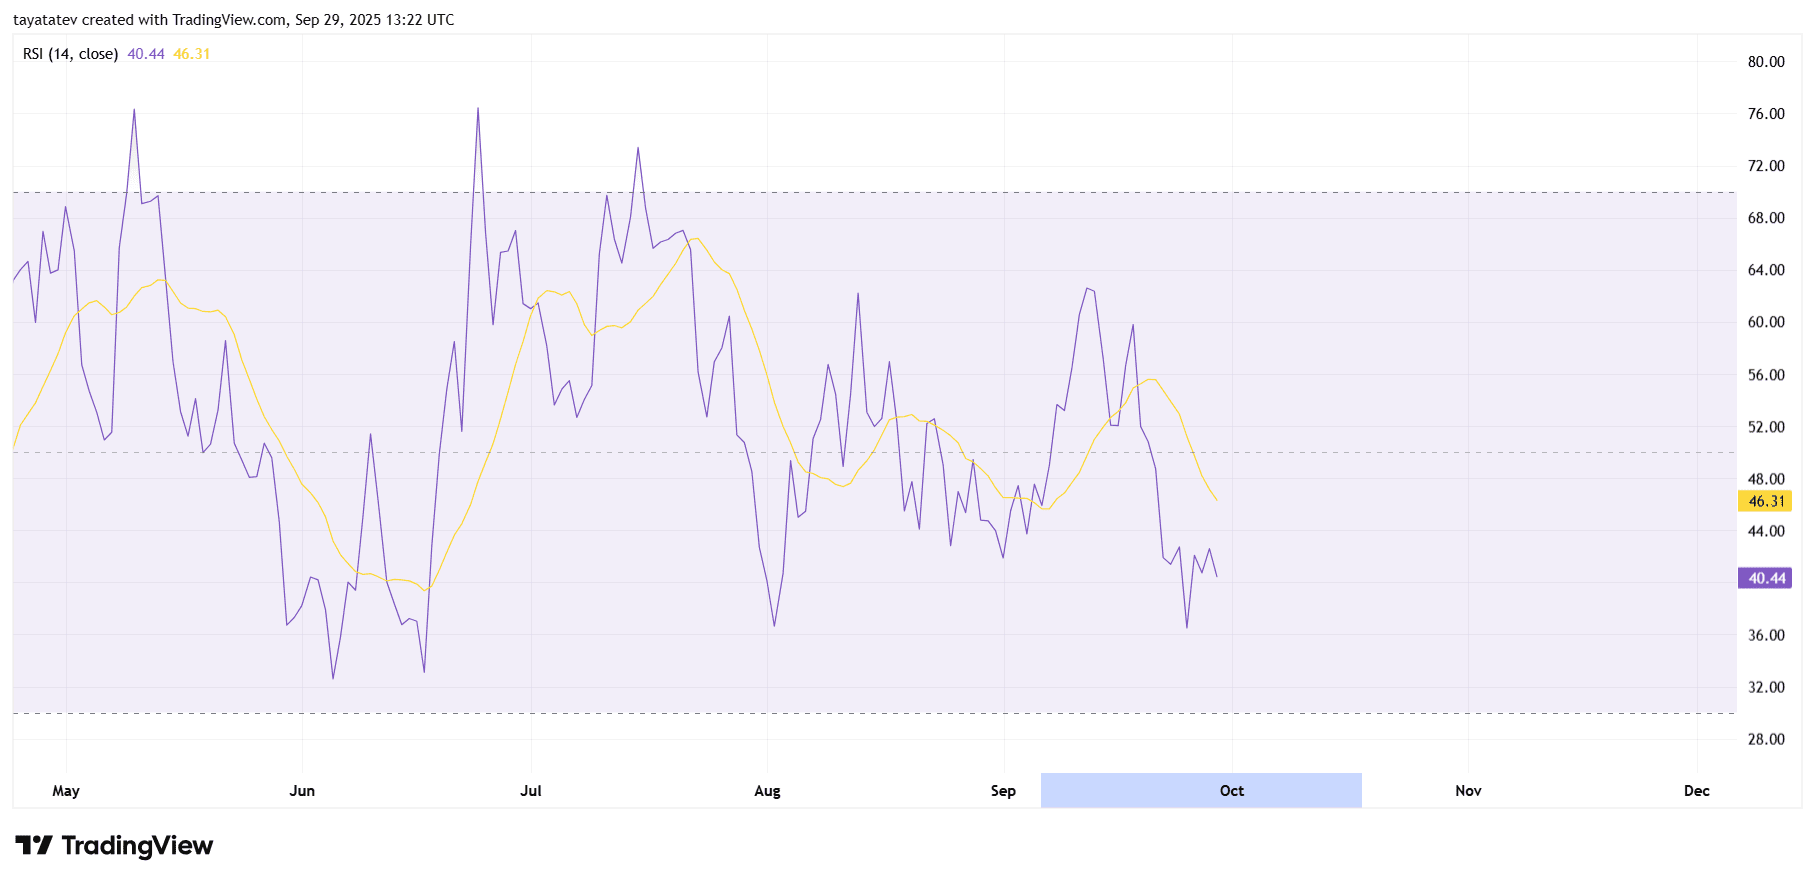
Through September, the RSI made lower highs and failed twice near 50, which confirmed waning follow-through on bounces. To shift the tone, the oscillator needs a sustained move back above its signal average and then through 50. That sequence would indicate improving breadth and usually precedes stronger price candles.
If the RSI instead slips into the mid-30s and stays there, pressure likely persists and price can revisit recent supports before any durable rebound. In short, today’s RSI shows bearish-to-neutral momentum with room to recover; confirmation requires an RSI cross back over its average and acceptance above 50 to align with an upside attempt on the chart.
SEI MACD Daily Analysis — September 29, 2025
Sei’s moving average convergence divergence (MACD) remains in negative territory, showing that downside momentum is still in play. The MACD line stays under the signal line, which means sellers keep short-term control. The histogram prints smaller red bars compared with last week, suggesting bearish momentum is slowing but not yet reversed.
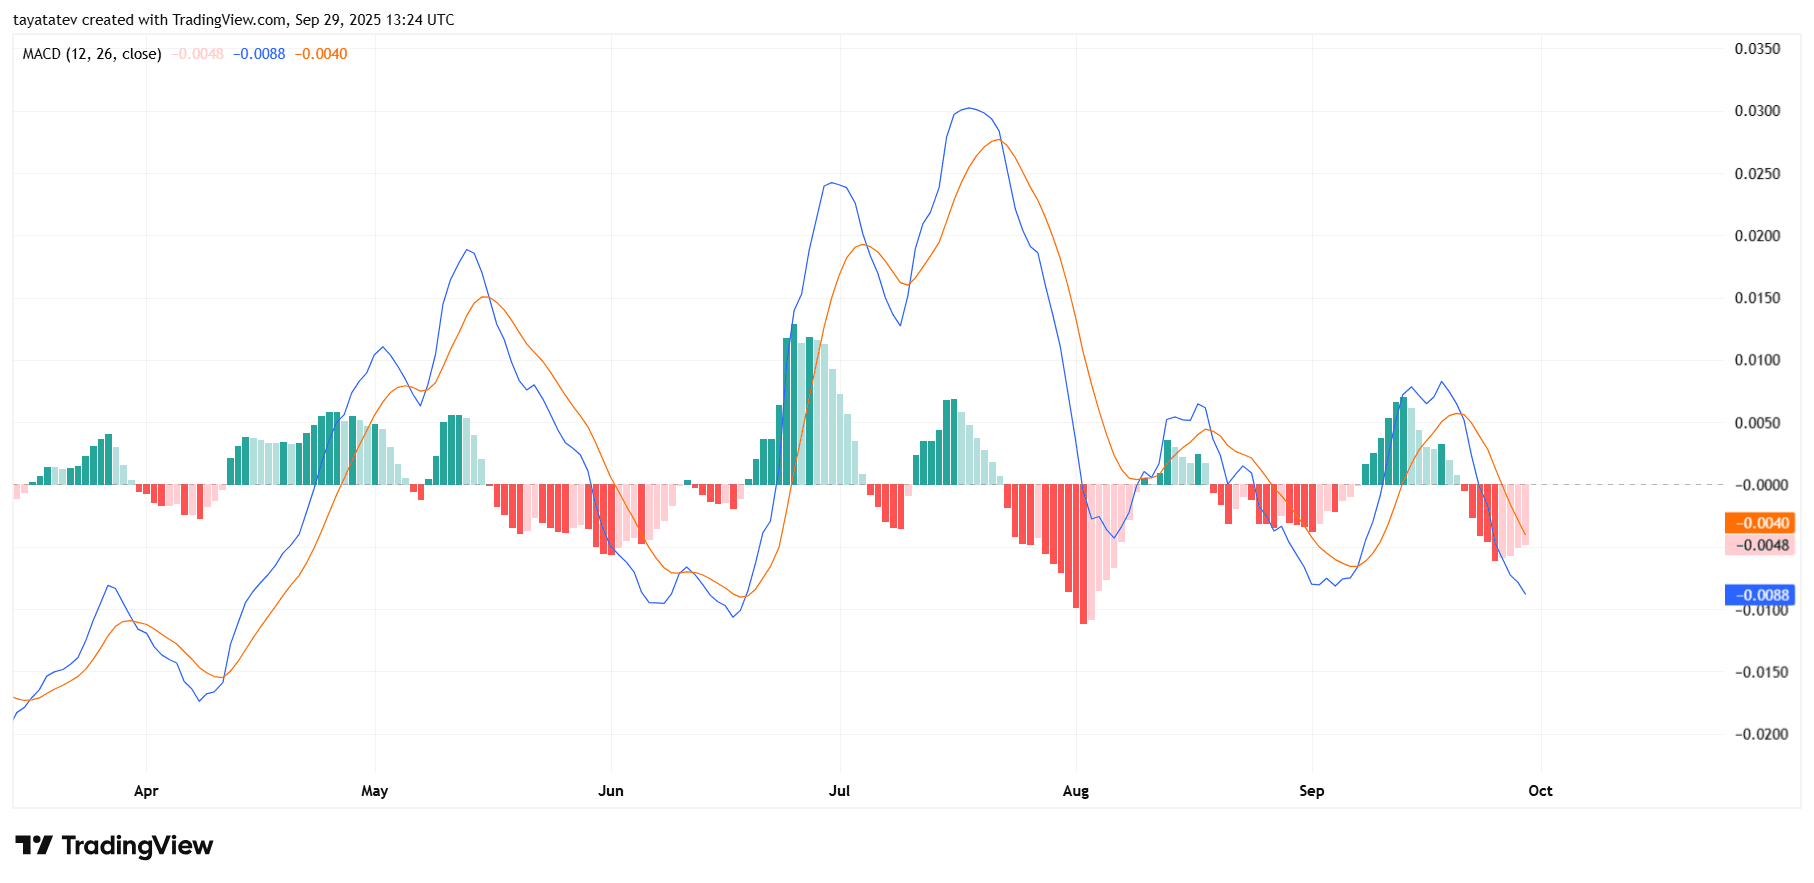
For a trend shift, the MACD line must cross back over the signal line and rise above the zero level. That sequence would confirm a new bullish phase and usually aligns with stronger price candles and increasing volume. Until then, any bounce attempts may stay limited near resistance levels, as the momentum profile favors sideways-to-lower price action.
If the histogram flips green and expands, it would be an early sign of momentum recovery. Combined with a positive cross, this would strengthen the case for Sei retesting the $0.30 region and potentially pushing toward the upper channel boundary.