
Forty minutes. That’s all Hedera scheduled to ship its latest mainnet upgrade—and it hit the window on Sept. 24 at 17:00 UTC. The network marked the work complete with no lingering incidents, then turned to a testnet cutover the following day.
Mainnet v0.65: short window, clean cutover
Hedera set a ~40-minute maintenance window for the v0.65 mainnet upgrade on Wednesday, Sept. 24. The status page flagged possible service disruption while nodes restarted and applied changes.
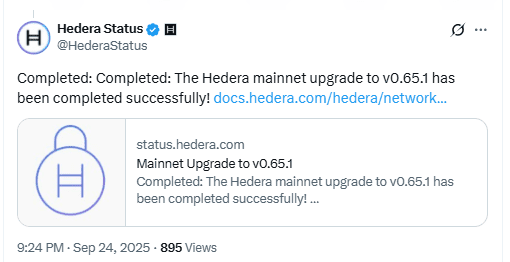
After the window, Hedera’s status feed confirmed completion of v0.65.1. The update closed without post-upgrade incident notices on the public history. The operations cadence remained steady through the week.
The release sequence kept the focus on reliability rather than market features. Hedera emphasized predictable execution and record hygiene, setting the stage for subsequent network iterations. Hedera
What changed under the hood
Version 0.65 introduces the Virtual Mega Map to streamline state management. Documentation also highlights Block Stream refinements that unify records and improve forward-compatibility. These changes target cleaner data flows for nodes and explorers.
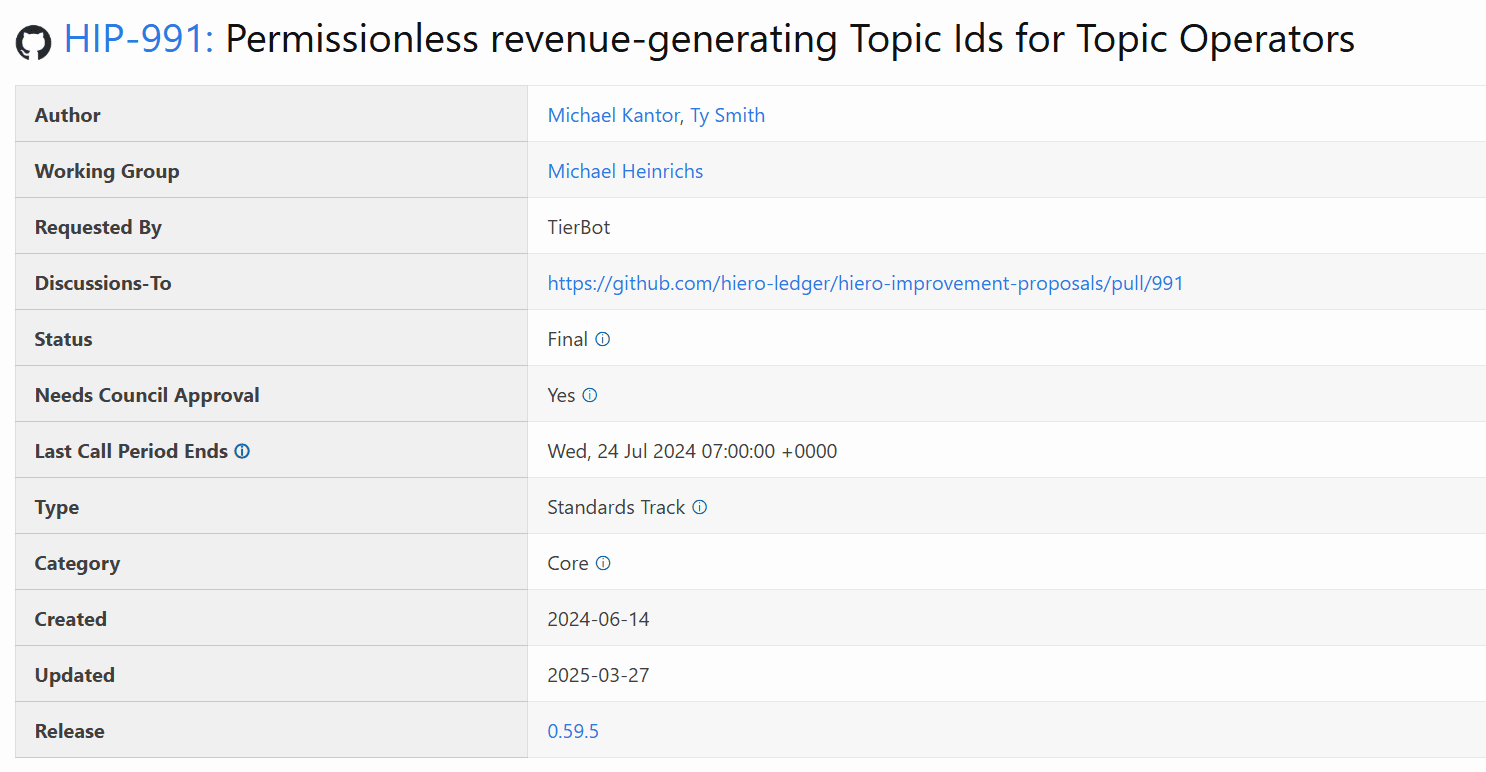
Critically, the upgrade enforces max_custom_fee limits tied to HIP-991. That safeguard lets users cap custom fees on supported transactions; if a transaction would exceed the cap, it fails with an appropriate error.
Together, these items reduce operational surprises for dApp teams. They also align fee behavior across services that depend on scheduled transactions and topic interactions.
Testnet v0.66 lands on Sept. 25
The day after mainnet work, Hedera scheduled a testnet upgrade to v0.66 for Thursday, Sept. 25 at 17:00 UTC. As with mainnet, the window called for about 40 minutes and warned of intermittent disruption.
Hedera later marked the testnet change as completed on its public history. The quick follow-on keeps preview and testing environments aligned with newly enforced rules.
For developers, the back-to-back cadence shortens the gap between production features and test cycles. Teams can validate tooling and record handling under v0.66 while mainnet runs v0.65.
HBAR squeeze forms near key structure?
CryptoPulse says HBAR is compressing against a well-defined support zone and narrowing trend lines. The chart shows a series of lower highs pressing into a prior demand block where momentum previously accelerated. Therefore, liquidity concentrates at this area as orders from earlier trading cluster around the same levels.
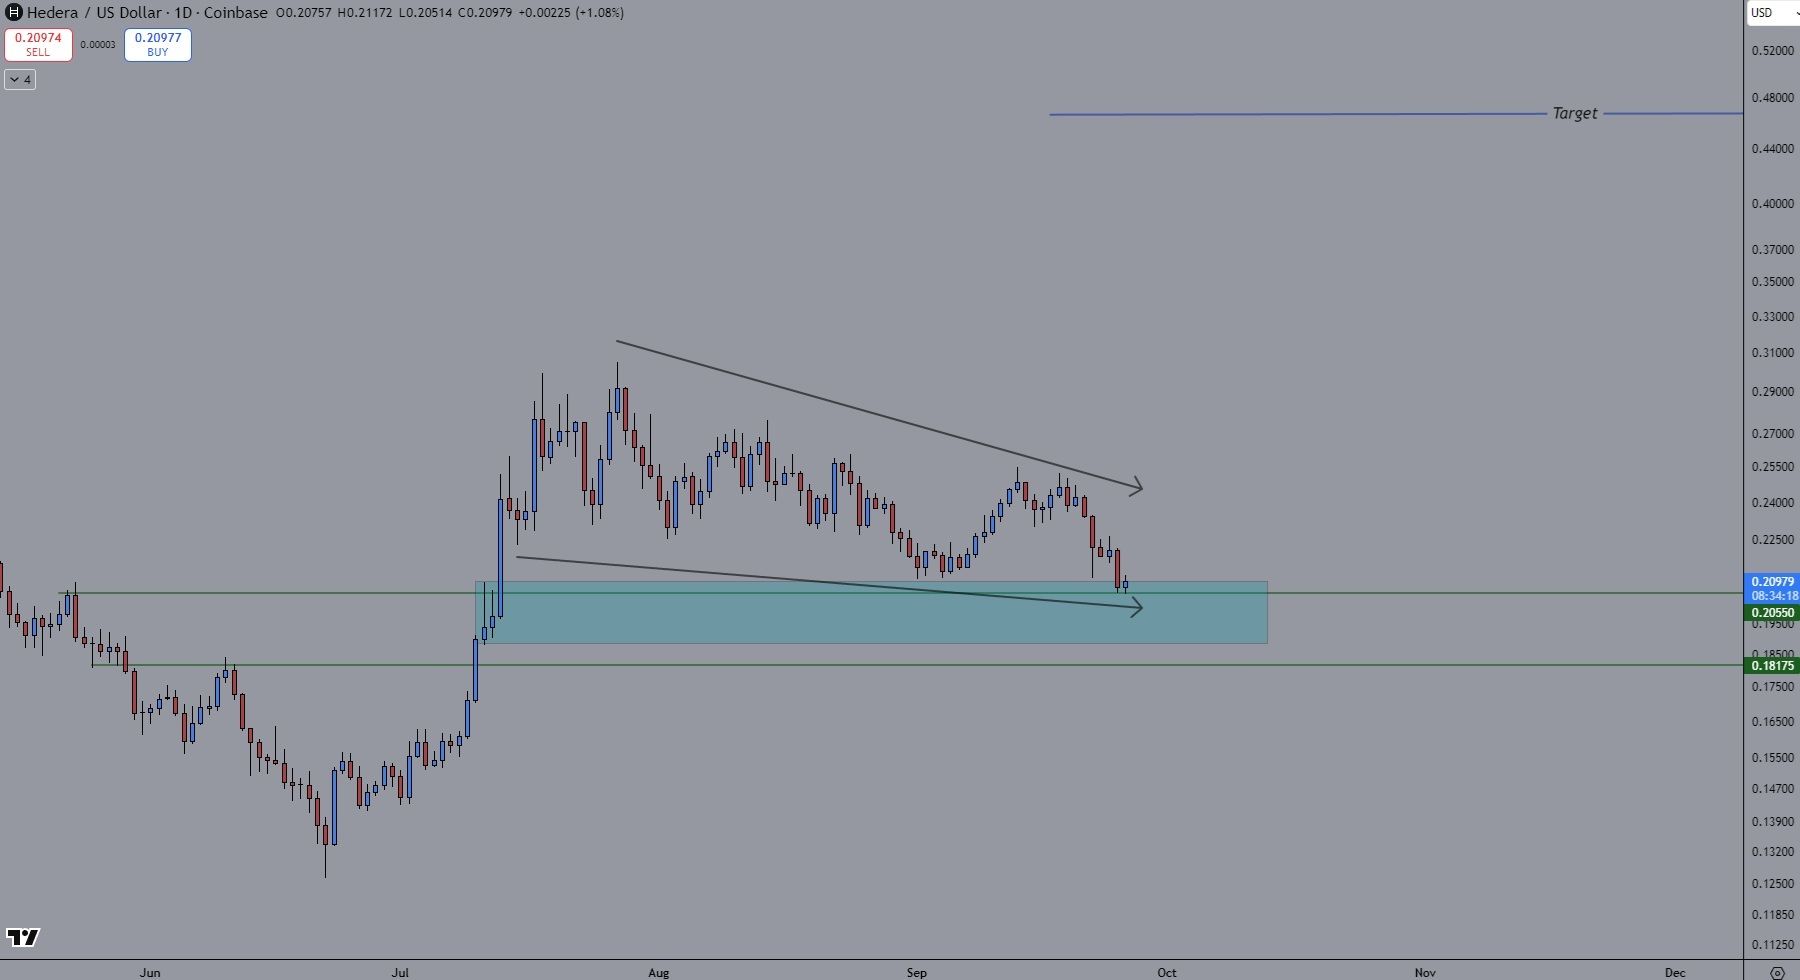
Moreover, the structure resembles a late-stage squeeze: candles contract into support while the descending resistance line guides supply lower. This setup often forces a decision as buyers defend the zone and sellers test it. Consequently, a brief sweep below the box or a quick rejection at the trend line would not be unusual before direction resolves.
The analyst adds that lower-time-frame patterns now matter. Traders typically watch for break-and-retest behavior, rising momentum, or failed breakdowns to confirm bias. However, invalidation sits just beyond the demand box, where acceptance below would shift focus to the next historical support and delay any recovery attempt.
HBAR volatility compresses near the lower Bollinger band
HBAR/USD now trades along the lower Bollinger band while the 20-day SMA trends slightly down. That position means price sits close to two standard deviations below its recent mean. Band width is about 21.7% of the mid-price ((0.26–0.21)/0.23), so volatility is elevated but not extreme. When candles “ride” the lower band, sellers control momentum; however, bands also frame where mean reversion often starts.
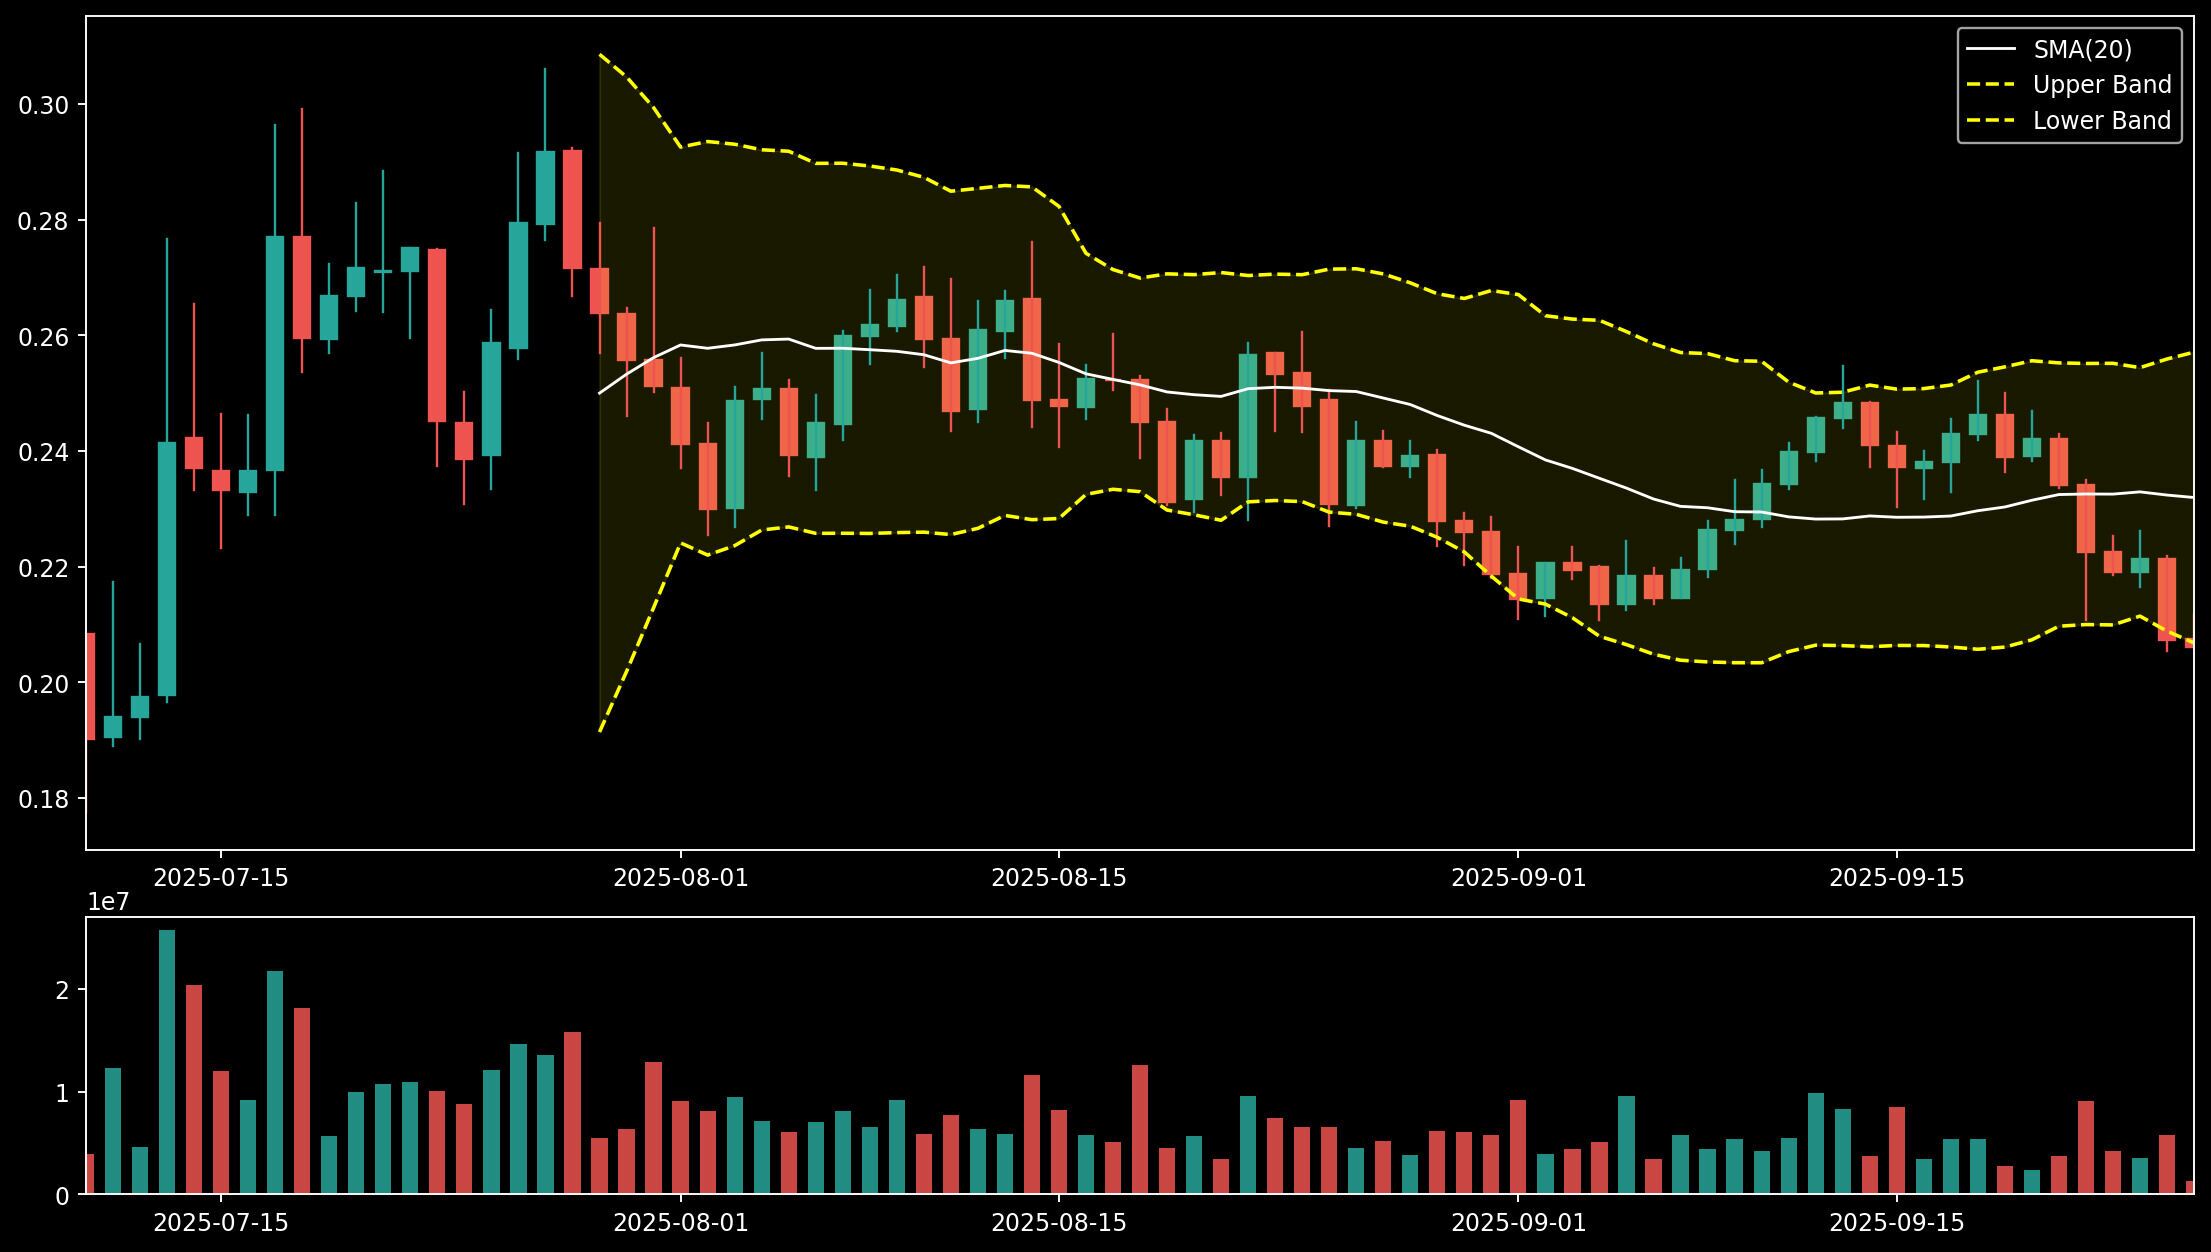
Here is what that implies. If candles close back above the middle band (the 20-day SMA) and volume expands, the move signals a shift from defense to stabilization. The first objective becomes holding that SMA on a retest; sustained closes above it often migrate price toward the upper band. Conversely, fresh closes below the lower band with heavier volume mark continuation risk. In that case, traders look for a quick reclaim back inside the band; failure to do so usually extends the downswing until a base forms.
What to monitor next. Watch for a volatility cue: further band tightening usually precedes a sharp expansion move, while widening bands confirm a move already in progress. Track volume on any band break; expansion without volume often fades back to the SMA. Finally, look for momentum confirmation on lower time frames—higher lows, bullish divergences, or failed breakdowns near the band edge—before assuming a shift in trend.
HBAR MACD flips to a modest bullish cross?
The MACD (12,26,9) just crossed above its signal line while both remain below zero. The histogram turned positive (~0.00089), showing momentum improving after the late-September selloff. However, because the cross occurred under the zero line, it reads as an early recovery signal rather than a confirmed uptrend.
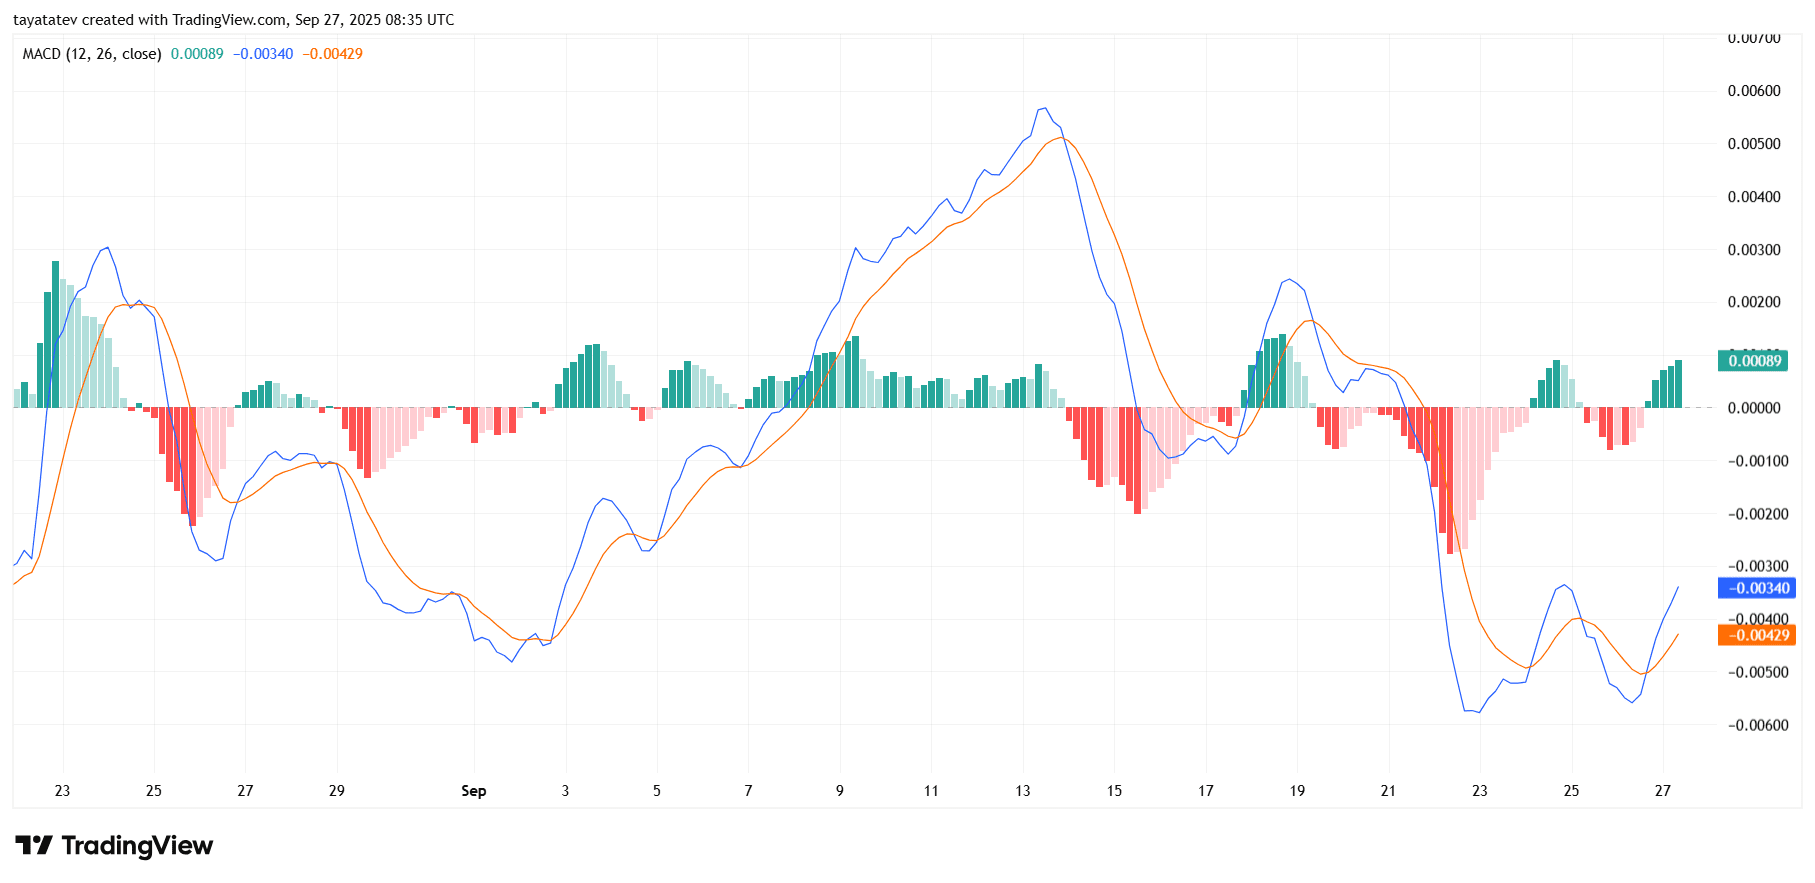
Next, watch for follow-through. If the MACD keeps rising and the histogram expands, price momentum typically carries toward a zero-line test. A clean move above zero, with the signal line curling up behind it, would strengthen the case that sellers have lost control and that a new upswing can develop.
Risk still sits with a failed cross. If the histogram stalls or turns negative and the MACD rolls back under the signal line, the setup morphs into a “bearish reset” under zero. In that case, momentum would likely retest recent lows before any durable base forms.