Swiss asset manager 21Shares has listed its Dogecoin exchange-traded fund on the Depository Trust & Clearing Corporation under the ticker TDOG. The move gives investors a regulated path to track Dogecoin price moves without holding the token directly. It follows the playbook popularized by spot Bitcoin ETFs that went mainstream in 2024.
The DTCC listing places TDOG inside the standard plumbing used by brokerages and market makers. As a result, institutional and retail participants can route orders through familiar settlement channels. This structure lowers operational friction compared with direct crypto custody.
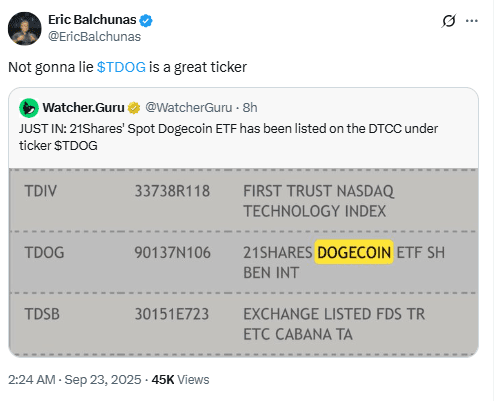
Bloomberg Senior ETF Analyst Eric Balchunas noted the development on X. He wrote,
“JUST IN: 21Shares’ Spot Dogecoin ETF has been listed on the DTCC under ticker $TDOG.”
The comment underscored the product’s arrival on a core market infrastructure.

Growing Institutional Acceptance of Meme Coins
The TDOG listing signals broader acceptance of meme-coin exposure in traditional portfolios. Asset managers continue to package digital assets inside regulated wrappers to meet demand while staying inside established rules. Consequently, allocators can express views on Dogecoin through an ETF share rather than private keys.
By moving through DTCC, 21Shares aligns the product with standard compliance and clearing workflows. This alignment makes it easier for platforms to add the fund to menus and for advisers to document suitability. It also helps centralize post-trade processes that institutions already trust.
Market attention around Dogecoin remains high, and liquidity often stays deep during active periods. Therefore, an ETF format allows traders to focus on execution and hedging while outsourcing custody and security to the fund’s service providers. That operational shift can matter for firms with strict risk controls.
Broader Implications for Crypto ETFs
TDOG extends 21Shares’ lineup beyond Bitcoin and Ethereum offerings. The firm continues to broaden access to crypto exposures through conventional channels. As more products list, investors can target different segments of digital assets based on liquidity, narratives, and risk tolerance.
The launch arrives as regulators accelerate decisions on crypto-related ETFs. Clearer processes have encouraged issuers to propose funds tied to additional assets. If that clarity holds, more altcoin ETFs could reach public markets, further diversifying the toolkit.
At the same time, the ETF structure concentrates operational duties—like custody, creation, and redemption—within a regulated framework. This concentration lets market participants evaluate tracking quality, fees, and liquidity rather than wallet management. As a result, decision-making shifts toward standard fund-selection criteria.
TD Sequential buy signal appears on DOGE 4-hour chart
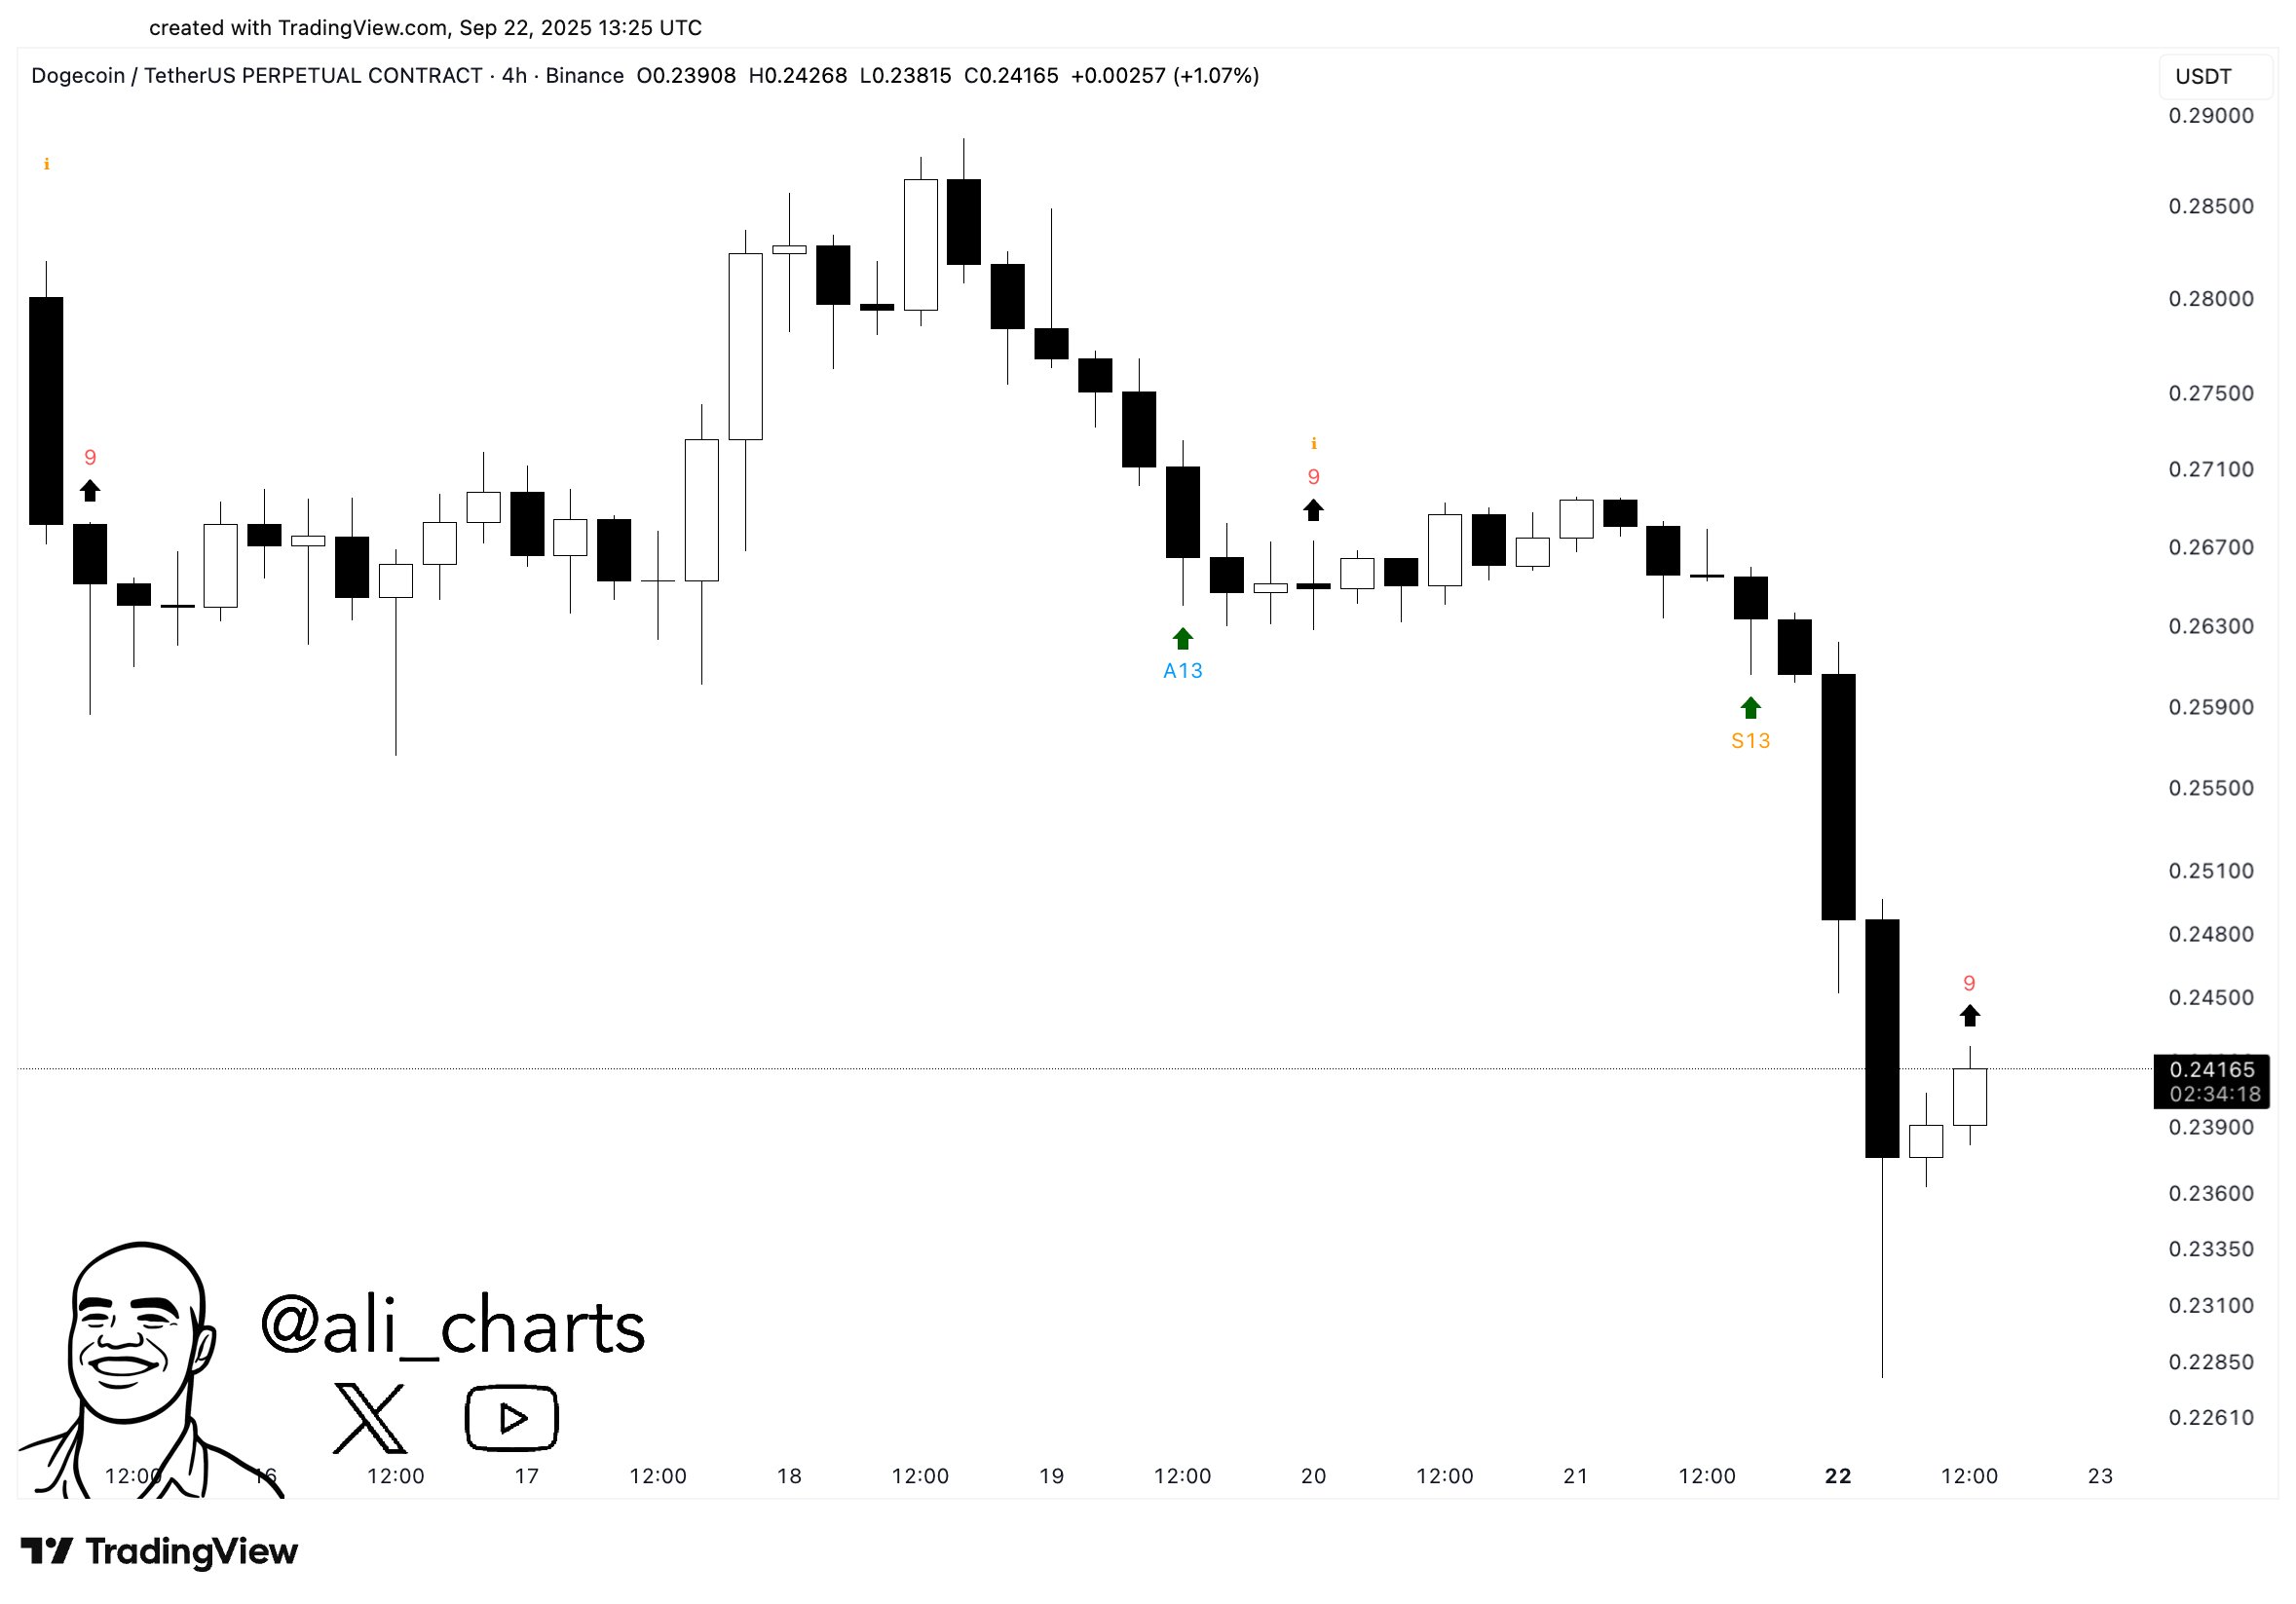
Ali Martinez shared a TradingView image of the Dogecoin/Tether (DOGE/USDT) perpetual on Binance showing a Tom DeMark (TD) Sequential “9” buy count on the 4-hour timeframe. The chart timestamp reads September 22, 2025, 13:25 UTC. Price printed a sharp selloff candle followed by smaller recovery candles, placing the “9” after a downward sequence—typical of a potential seller-exhaustion setup.

In this context, the TD “9” suggests downside momentum may be weakening. However, confirmation usually requires a subsequent candle to close above the prior bar’s high, while a drop below the bar-8/9 lows would weaken the signal. The graphic also shows earlier TD markers (including “A13” and “S13”), indicating prior exhaustion and setup counts that framed the latest decline.

Therefore, if follow-through buying closes above the immediate overhead high, bulls gain a short-term technical edge on the 4-hour chart. Conversely, if price loses the post-signal lows, the market keeps the downtrend intact and the alert fades. The image presents a tradeable inflection, but the confirmation rules remain key.
Dogecoin daily chart forms rising wedge; upside projection requires breakout confirmation
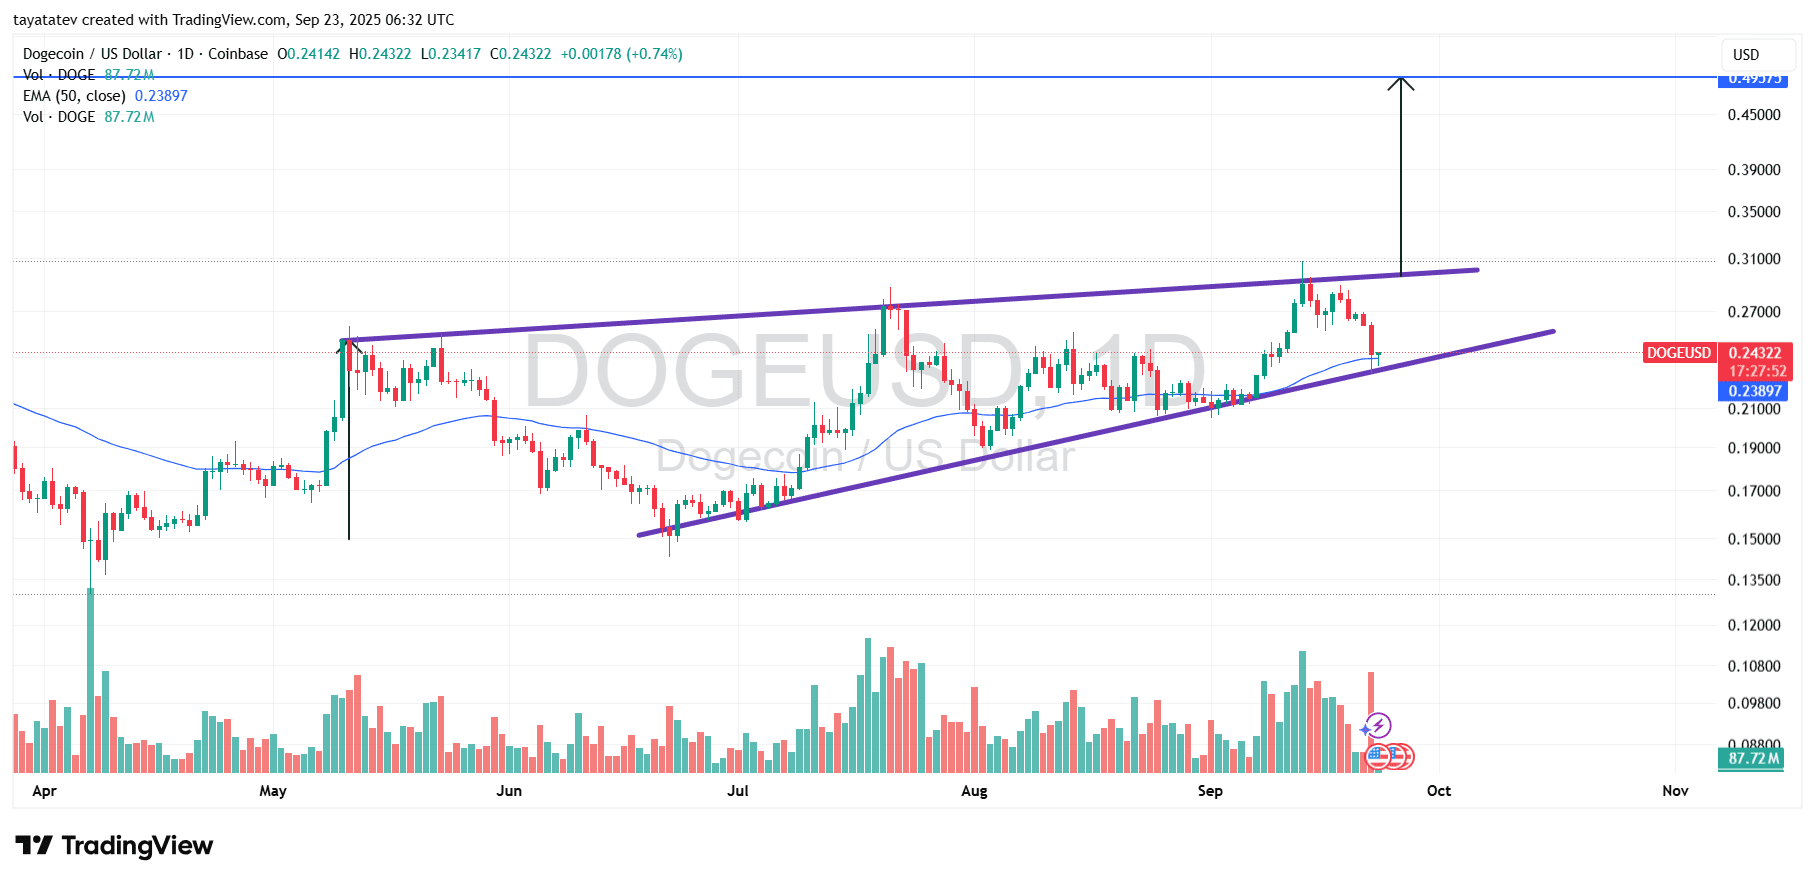
The Dogecoin/United States dollar (DOGE/USD) daily chart from Coinbase, created on TradingView on September 23, 2025, shows price at about $0.243. The graphic plots an Exponential Moving Average (EMA) 50 near $0.2389 and displays rising volume around 87.7 million. Two converging purple trendlines frame price action since late spring, with higher lows against only slightly higher highs.
The structure fits a rising wedge. A rising wedge is a narrowing uptrend where support rises faster than resistance, often signaling waning momentum and a potential break when price escapes the pattern. Here, the lower boundary has repeatedly caught pullbacks, while the upper boundary has capped advances near the $0.30 area.

For an upside scenario, the market must confirm with a decisive daily close above the wedge’s upper trendline on increased volume. If that breakout confirms, your projection implies a 103 percent move from the current price, pointing toward roughly $0.494 (about $0.243 × 2.03 ≈ $0.494). Until a breakout occurs, price remains inside the wedge and the EMA 50 around $0.239 serves as nearby trend support.
DOGE daily RSI shows momentum cooling; watch the 50 line
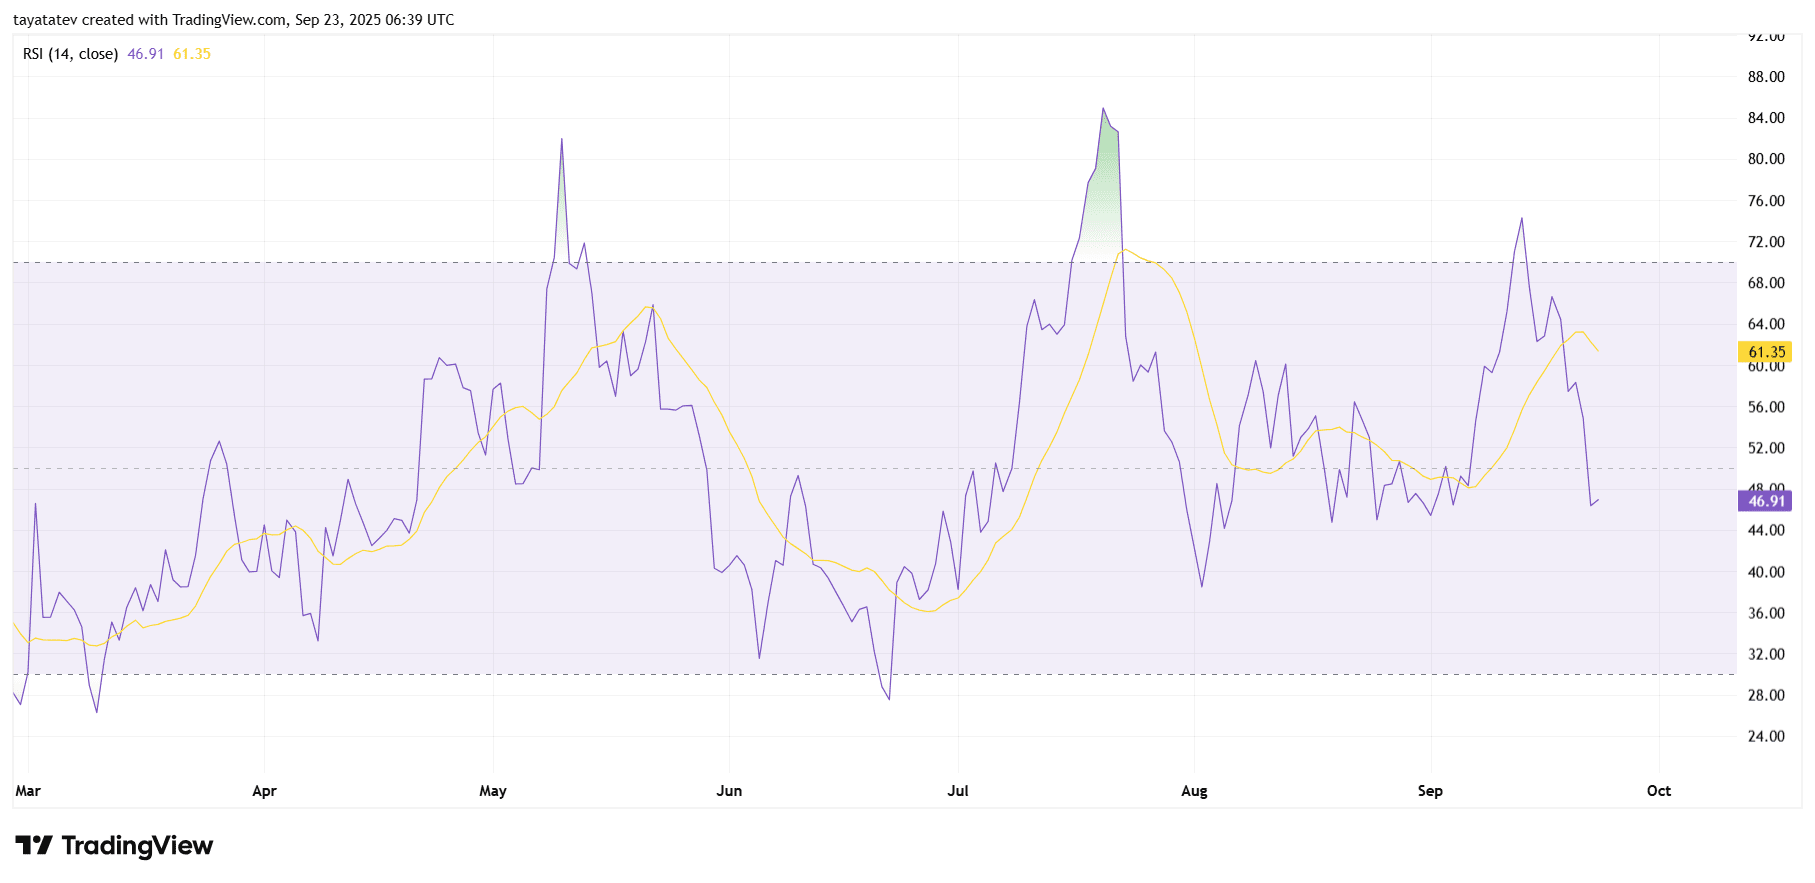
The Dogecoin/United States dollar daily Relative Strength Index chart, created on TradingView on September 23, 2025, prints RSI-14 at 46.91 with the RSI moving average near 61.35. The oscillator now sits below the neutral 50 band, which signals fading bullish momentum after recent strength. The slope of the RSI moving average turns down as well, confirming a short-term momentum slowdown.

Recent history shows two notable momentum spikes: late July pushed RSI deep into overbought territory, and mid-September returned to the 70s but with a lower momentum peak. That pattern hints at bearish divergence, where price pressed higher while RSI did not. The latest drop below 50 followed that divergence and aligns with the price pullback seen this week.
From here, momentum cues are clear. A sustained reclaim of the 50–55 zone, along with an RSI cross back above its moving average, would signal improving trend strength. However, continued prints below 50 keep sellers in control and raise the risk of a retest toward the mid-40s or even the 40 level. The indicator has ample room before oversold (30), so volatility can persist without triggering exhaustion.
