 Tumbles, But Analysts Keep 0 Ambition Alive")
Litecoin (LTC) price traded near $105 on Sept.22, after reaching a daily low near $102. The move followed broader market weakness, with traders watching whether LTC could hold above the $100 support zone. Social media posts on X and TradingView debated the coin’s next direction, with some pointing to possible targets near $300 and above. In contrast, some posts flagged downside risks if the critical region gave way.
With the broader market in a downtrend, bulls would likely be aiming to hold the token above the support levels near $100.

Analysts Split on Litecoin’s Path as Critical Support Zone Faces a Test
Litecoin price’s struggle around the $100–106 band placed market focus squarely on whether the token could maintain its footing.
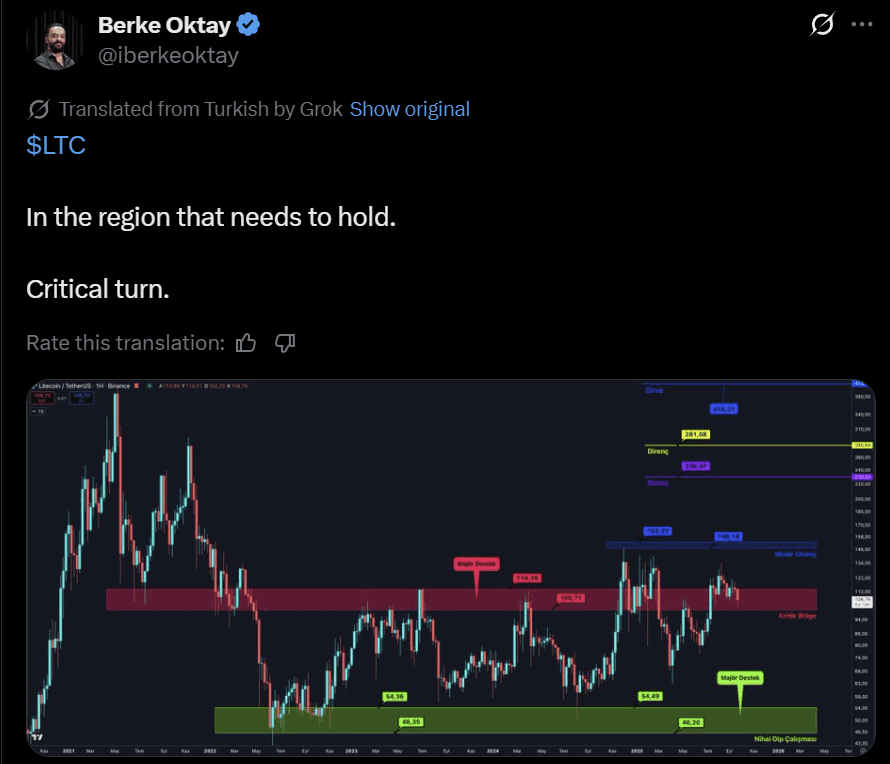
Crypto market analyst Berke Oktay called the zone a “critical turn,” stressing that a clean break below it risked exposing Litecoin to support near the mid-$50s. Oktay’s framing captured the tone across trading desks, where the same band has repeatedly shaped price action in recent years.
Analysts Frame LTC’s Current Range as Springboard to Breakout
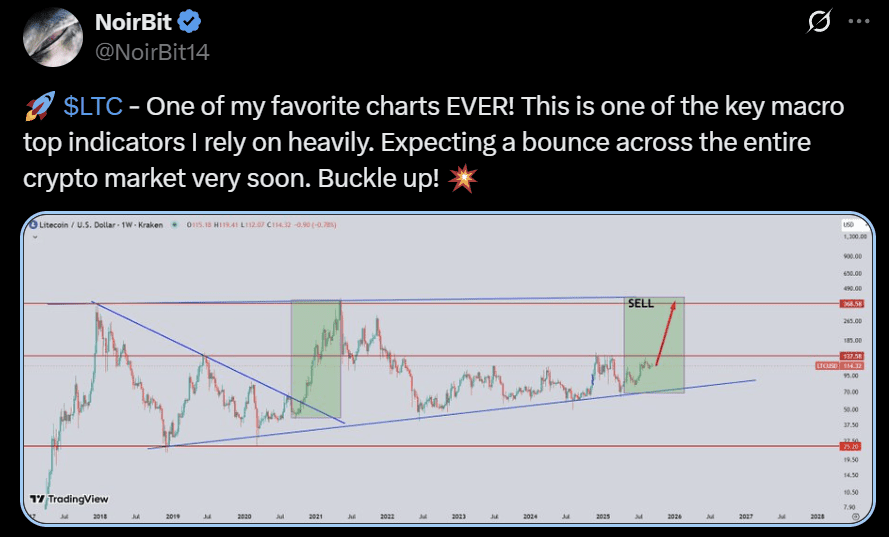
Other analysts framed the range as a springboard. NoirBit highlighted Litecoin’s long-term channel structure, comparing the current phase to earlier accumulation cycles. The independent analyst marked $368 as a potential sell zone, positioning it as the upper boundary of a possible breakout. Noirbit’s prediction relied on Litecoin’s tendency to accelerate quickly once consolidation periods resolved.
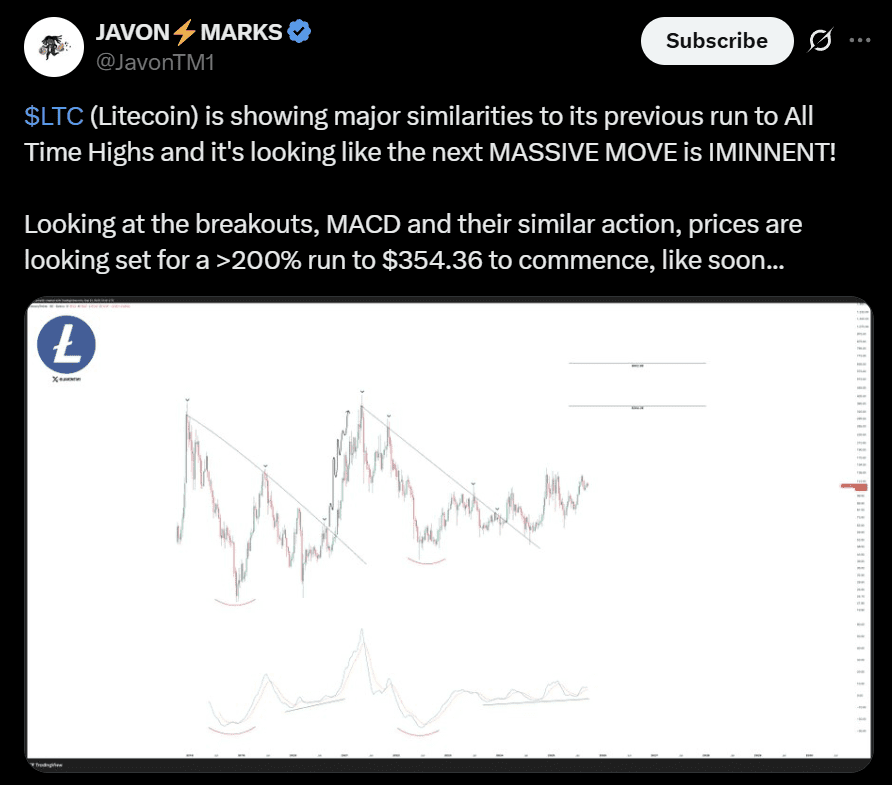
Javon Marks built on the same theme, noting similarities between current conditions and Litecoin’s run to previous highs. Marks pointed to momentum gauges such as MACD and breakout action, suggesting scope for a 200% rally that could carry the token toward $354.
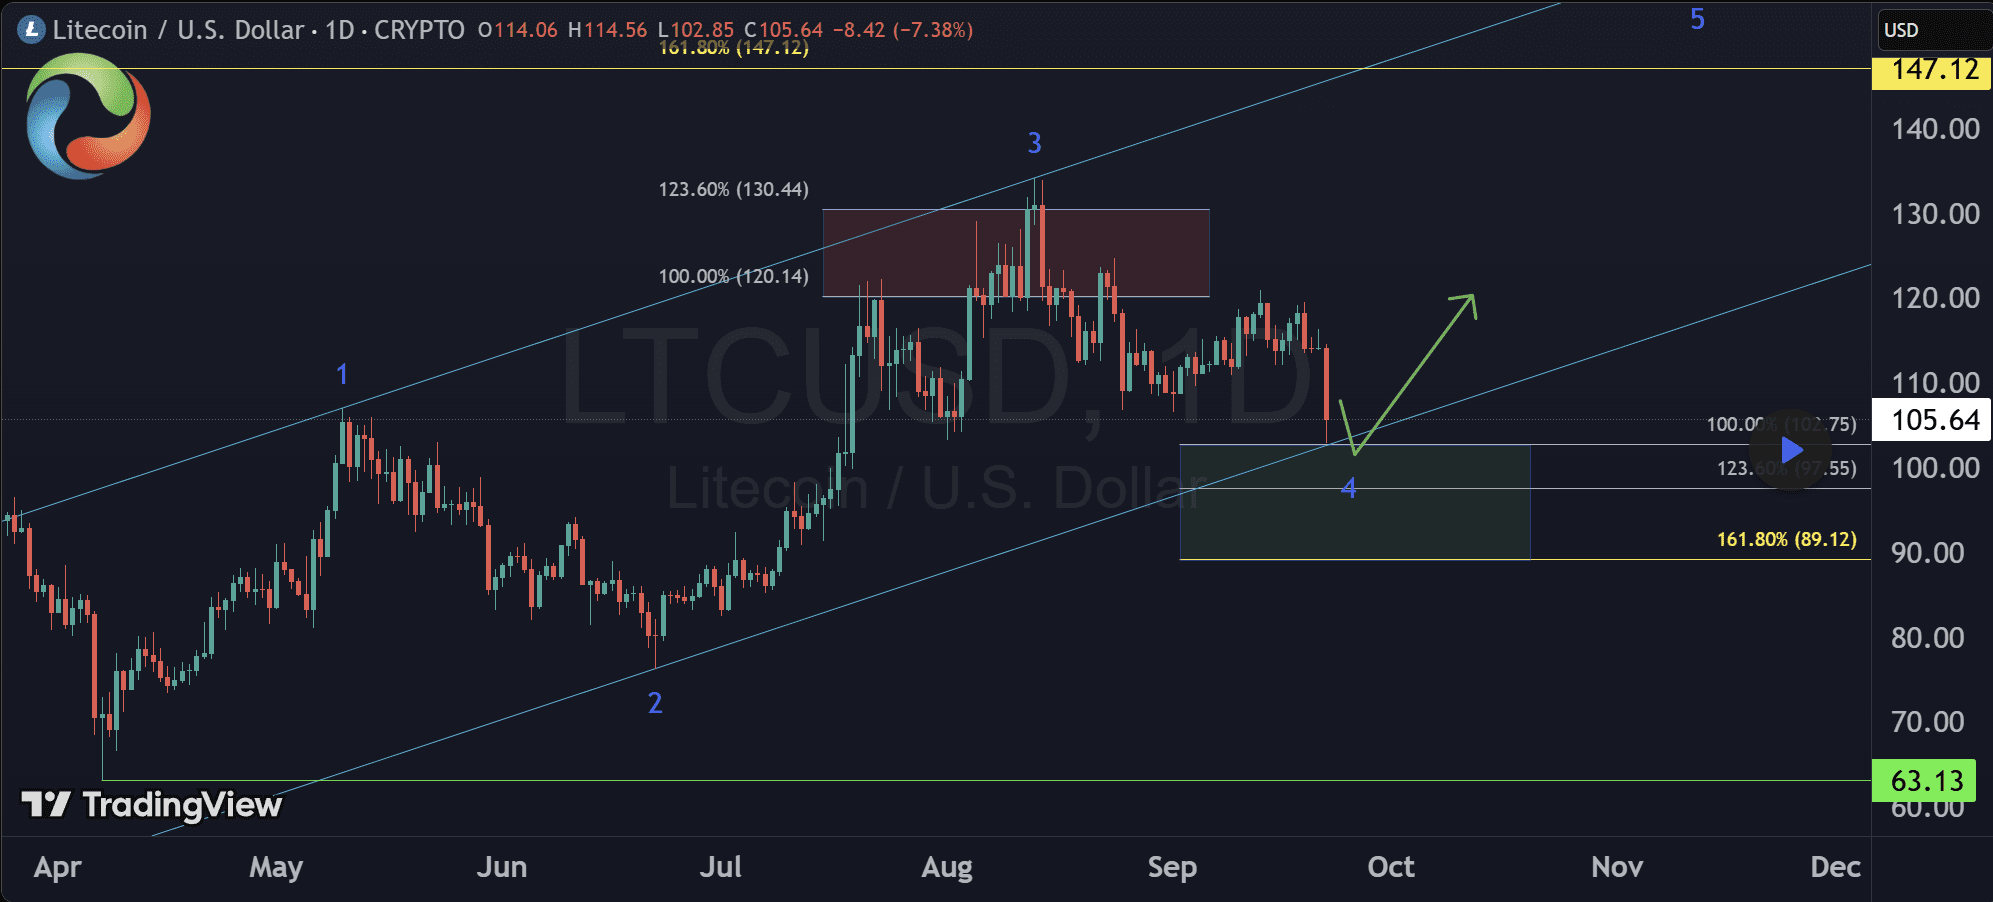
Wave-based outlooks reinforced the bullish bias. AlienOvichO argued that Litecoin completed a corrective phase into the $102–97 range, aligning with a broader uptrend channel. The trader set the next upside target at $147, describing it as a possible Wave 5 extension within an Elliott Wave cycle. The level coincided with the $148–153 resistance band, often highlighted as the first meaningful ceiling.
Clearing that zone would logically open the path toward $230 and $280, with higher cycle projections sitting above. Together, the forecasts largely converged on one hinge point: Litecoin needs to hold its $100 support. Maintaining that level kept the bullish ladder intact, while failure risked invalidating the broader cycle structure.
Moreover, with decision on a Litecoin ETF almost days away, a recovery towards higher price levels could very well be in the cards for LTC.
Falling Wedge Pattern Points Toward a Higher Breakout Target
Analysts’ forecasts found added weight in the technical structure now shaping Litecoin’s trend. The token moved within a falling wedge, a pattern defined by converging downward-sloping trendlines that compress price action until momentum shifts. The pattern signals weakening bearish pressure and often resolves in an upward breakout once resistance levels are tested and cleared.
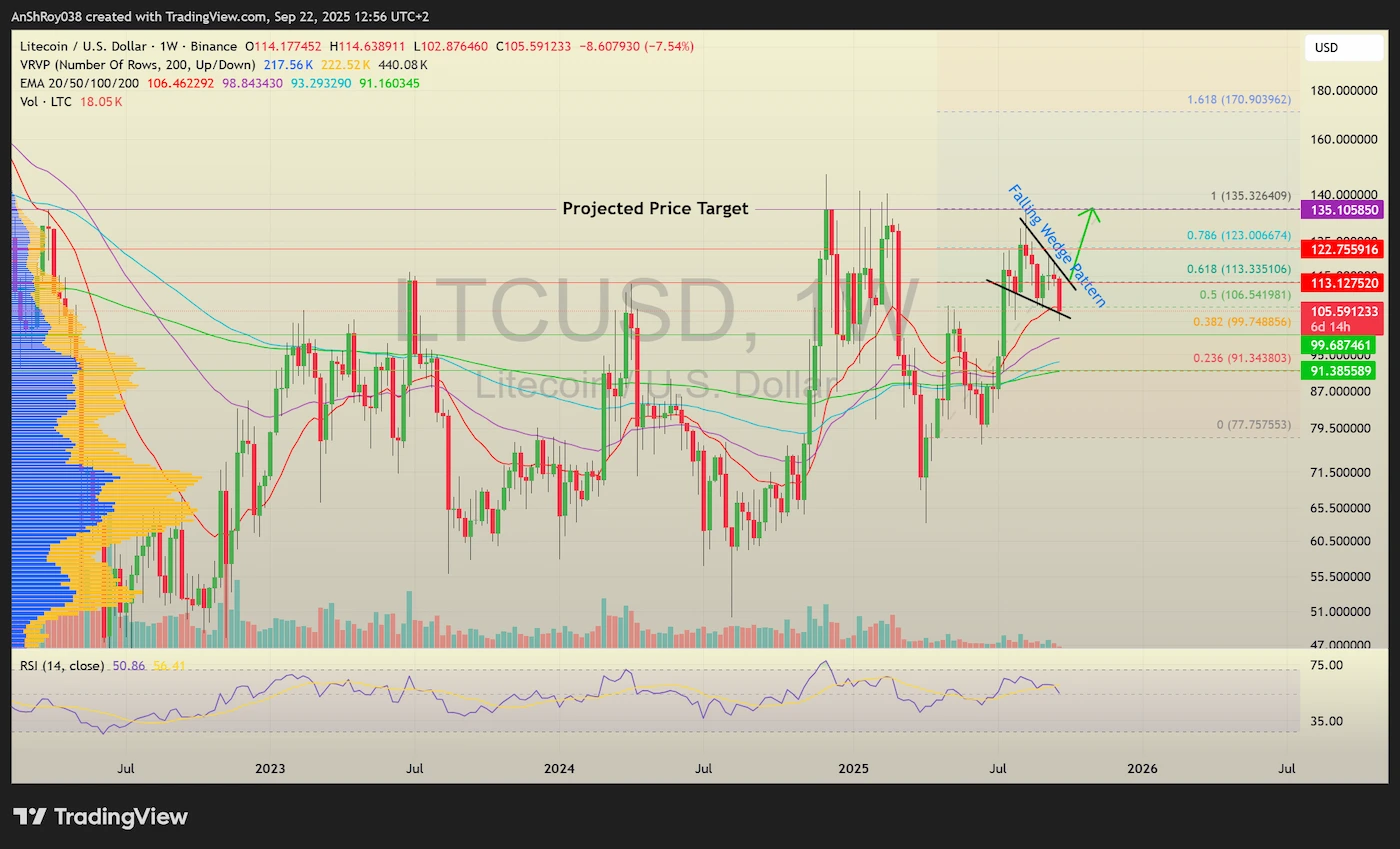
The wedge’s breakout path aligned with resistance at $113.13, right near the wedge’s upper trendline. A successful breach for the LTC USD pair there would put $123.00 as the next checkpoint, followed by the pattern’s projected price target near $135.10. Traders calculate the pattern’s theoretical price target by measuring its height at its widest point and applying that distance from the breakout level.
Support zones remained crucial in preserving the wedge’s validity. The first cushion sat at $99.7, with deeper reinforcement near $91.38. Holding these levels would help LTC price keep the hopes of a bullish rebound alive. Meanwhile, the RSI held neutral territory, scoring near 50.8, suggesting that neither overbought conditions nor selling extremes dictated near-term flows.
Overall, the falling wedge setup ties into broader cycle projections. Specifically, clearing each resistance ceiling in sequence would build the foundation for higher cycle targets flagged by earlier analyses. Failure to hold the highlighted support, however, would disrupt the structure and leave the bullish scenario vulnerable.
Disclaimer: The views and analysis presented above are solely those of the author and should not be considered financial advice. Readers are strongly advised to conduct their own research before making any investment decisions. Neither the author nor CoinChapter will be held responsible for any financial losses arising from actions taken based on this analysis.