
Bitwise filed to list a spot Avalanche ETF with the US Securities and Exchange Commission, as REX Shares and Osprey Funds prepare XRP and Dogecoin ETFs to begin trading this week. The moves extend a busy US crypto-ETF pipeline beyond Bitcoin and Ethereum.
Bitwise’s AVAX Filing Sets Coinbase as Custodian
Bitwise submitted a Form S-1 on September 15 for the Bitwise Avalanche ETF. The preliminary prospectus lists Coinbase Custody Trust Company as the Avalanche custodian. The filing outlines cold-storage controls and a Prime Execution Agreement for creations and redemptions.
The document states Coinbase Custody will hold the trust’s Avalanche in segregated accounts and describes insurance and operational controls for private-key management. It also details processes for trading, whitelisting addresses, and audit trails tied to custody operations.
Bitwise is not alone in pursuing an AVAX product. VanEck filed its own Avalanche S-1 earlier this year, and Grayscale has an AVAX registration on file as well, signaling broader issuer interest in single-asset altcoin ETFs. SEC+1
XRP and Dogecoin ETFs Target This Week’s US Debut
Separately, REX Shares and Osprey Funds expect to launch US ETFs providing exposure to XRP and Dogecoin this week, according to multiple market updates. Coverage points to a Thursday start, pending final logistics.
Unlike the 1933-Act commodity-trust structure used by Bitcoin and many Ether products, these funds are organized under the Investment Company Act of 1940. Their prospectus allows each fund to gain exposure through a wholly owned Cayman subsidiary while also allocating to other XRP or DOGE exchange-traded products.
The SEC filings spell out mechanics such as direct spot purchases on exchanges, the Cayman subsidiary’s role, and aggregation rules for 1940-Act compliance on leverage and capital structure. The approach mirrors REX-Osprey’s earlier filings for other crypto exposures.
Avalanche transactions surge in 2025, lifting overall L1 activity
Avalanche on-chain transactions accelerated sharply this year, according to a chart shared by CryptosRus that tracks “Total Transactions – All Indexed L1s.” The visualization shows a steep climb beginning in early 2025, with cumulative transactions across indexed layer-1 networks reaching new highs as Avalanche volumes increased.
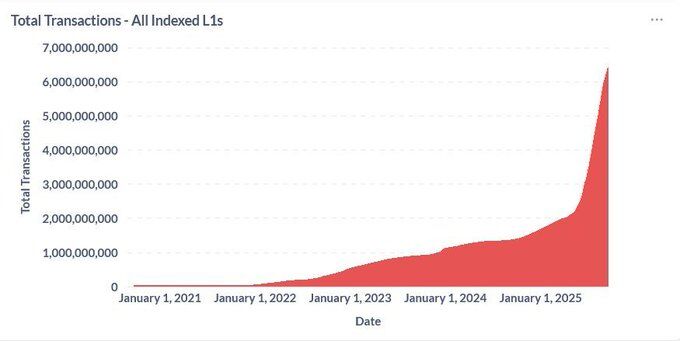
The chart points to a sustained rise rather than a single spike. Activity builds through late 2024, then turns higher in 2025, suggesting broader utilization of Avalanche’s network alongside other layer-1s. While the post does not break out chain-level shares, it credits Avalanche with fueling the jump, indicating that AVAX-network throughput contributed meaningfully to the aggregate curve.
Context remains important. The graphic aggregates transactions across several base chains, so totals reflect combined usage, not Avalanche alone. Even so, the timing aligns with a period of visible deployment on Avalanche, including more active applications and experiments. As data providers publish granular splits, the relative contribution from Avalanche versus peers will become clearer.
AVAX breaks out of ascending triangle; measured target points to $39.06
September 17, 2025 — The AVAX/USDT (Avalanche/Tether) daily chart shows an ascending triangle that has already broken to the upside. An ascending triangle is a bullish continuation pattern formed by higher lows pressing against a relatively flat resistance line until price clears it. AVAX trades near $29.65 on the chart and sits above its 50-day exponential moving average (EMA), which is shown at $25.33 and now acts as dynamic support.
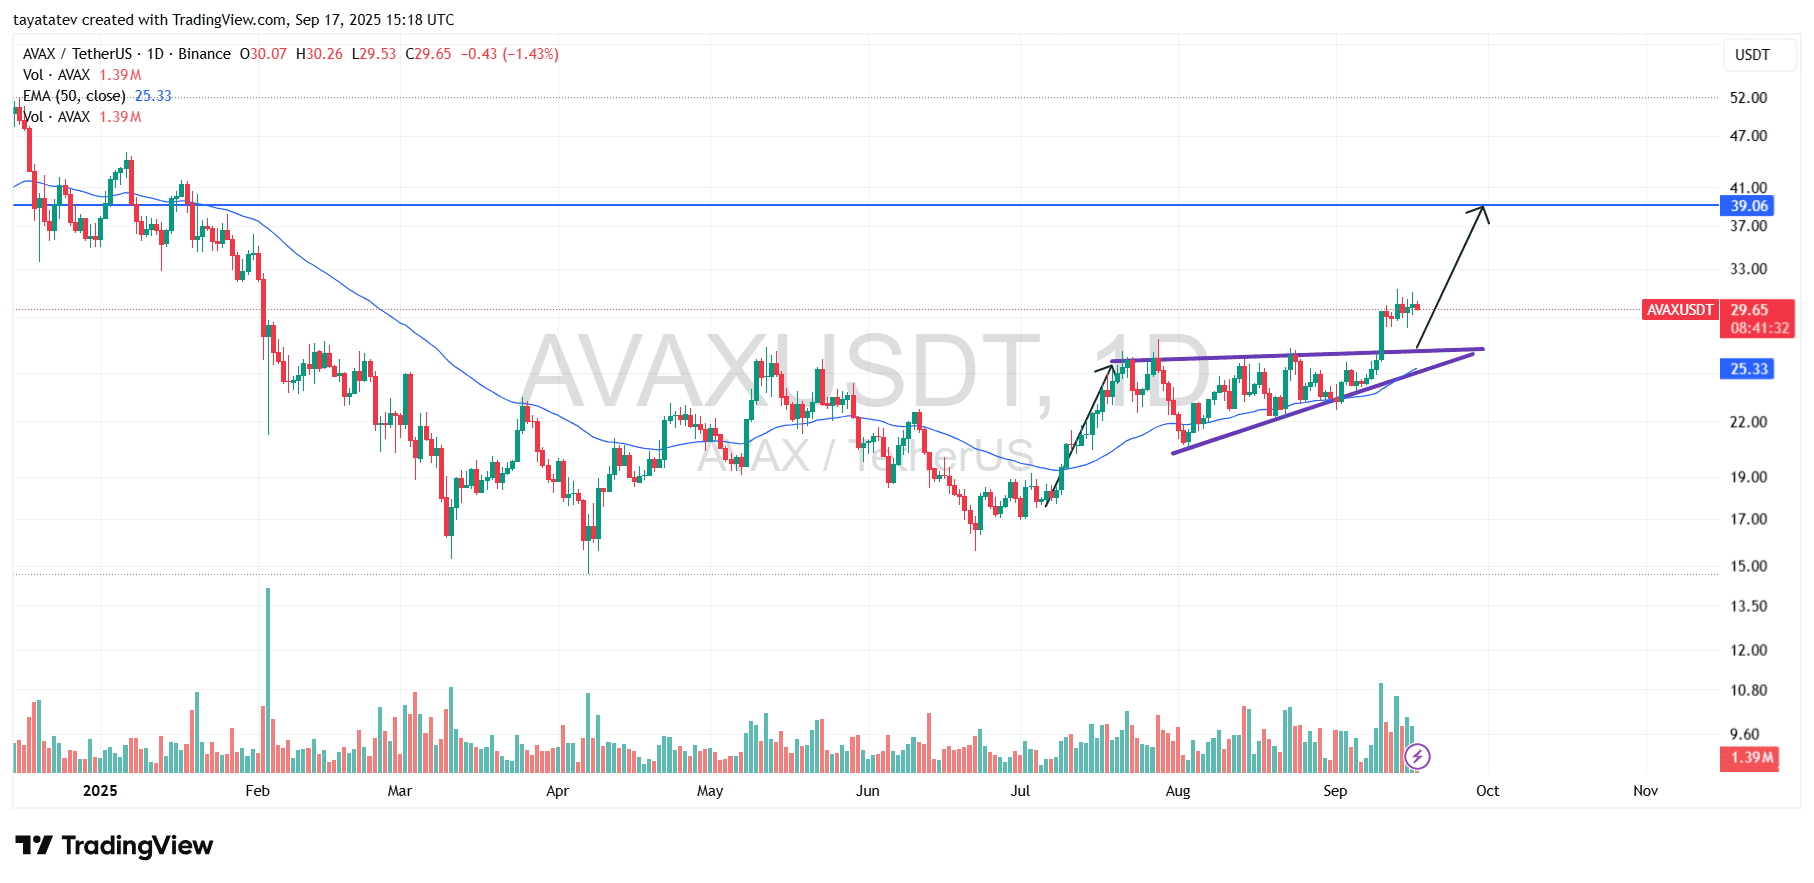
Price has advanced roughly 9% from the breakout zone around $27.20–$27.30, confirming buyers in control. The prior consolidation compressed volatility and created a clear shelf of resistance that price has now reclaimed on expanding participation, as reflected in recent volume bars. With structure intact, the setup favors continuation while that former ceiling holds as support on any retest.
The measured move from the triangle’s height projects a destination near $39.06, which implies about 32% additional upside from the current print around $29.65. That objective aligns with the horizontal level highlighted on the chart. If AVAX sustains closes above the breakout band, momentum typically carries price toward the measured target before the market reassesses trend strength.
AVAX momentum stays strong as RSI holds above 60
September 17, 2025 — Avalanche’s daily Relative Strength Index (14) prints 64.18, above its signal average at 61.70. Momentum remains positive and in a “bull regime” while RSI holds above 50. The oscillator pulled back from the 70 area but stayed elevated, which shows buyers still control the tape.
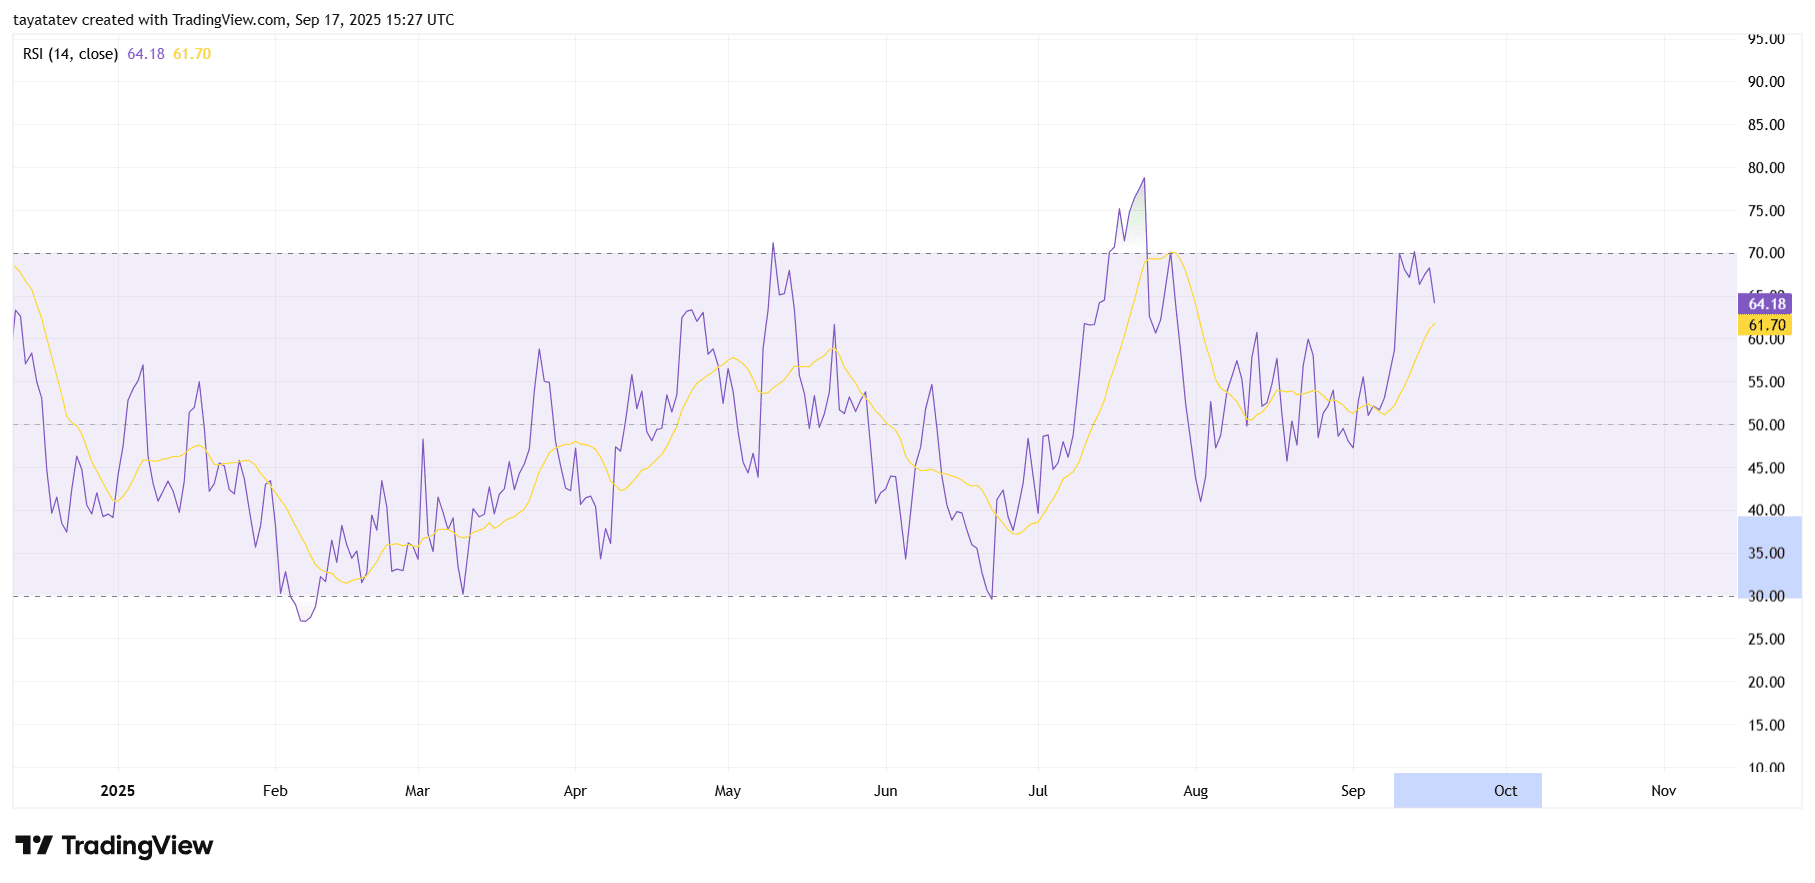
The RSI’s moving average has turned higher and now trails the RSI itself. That alignment often accompanies trend continuation. Moreover, recent dips found support near the mid-50s zone, keeping the series of higher momentum troughs intact.
Risk sits below 50 on the RSI, where bullish conditions typically fade. Conversely, a clean push through 70 would mark overbought territory and confirm strong trend strength. Until either trigger, the indicator signals constructive momentum rather than exhaustion.
AVAX momentum strengthens as MACD turns higher above zero
September 17, 2025 — Avalanche’s daily Moving Average Convergence Divergence (MACD) shows improving upside momentum. The MACD line reads 1.58, above the signal line at 1.22, while the histogram prints 0.36 in positive territory. The bullish crossover that began in early September has widened, indicating acceleration rather than a one day spike.
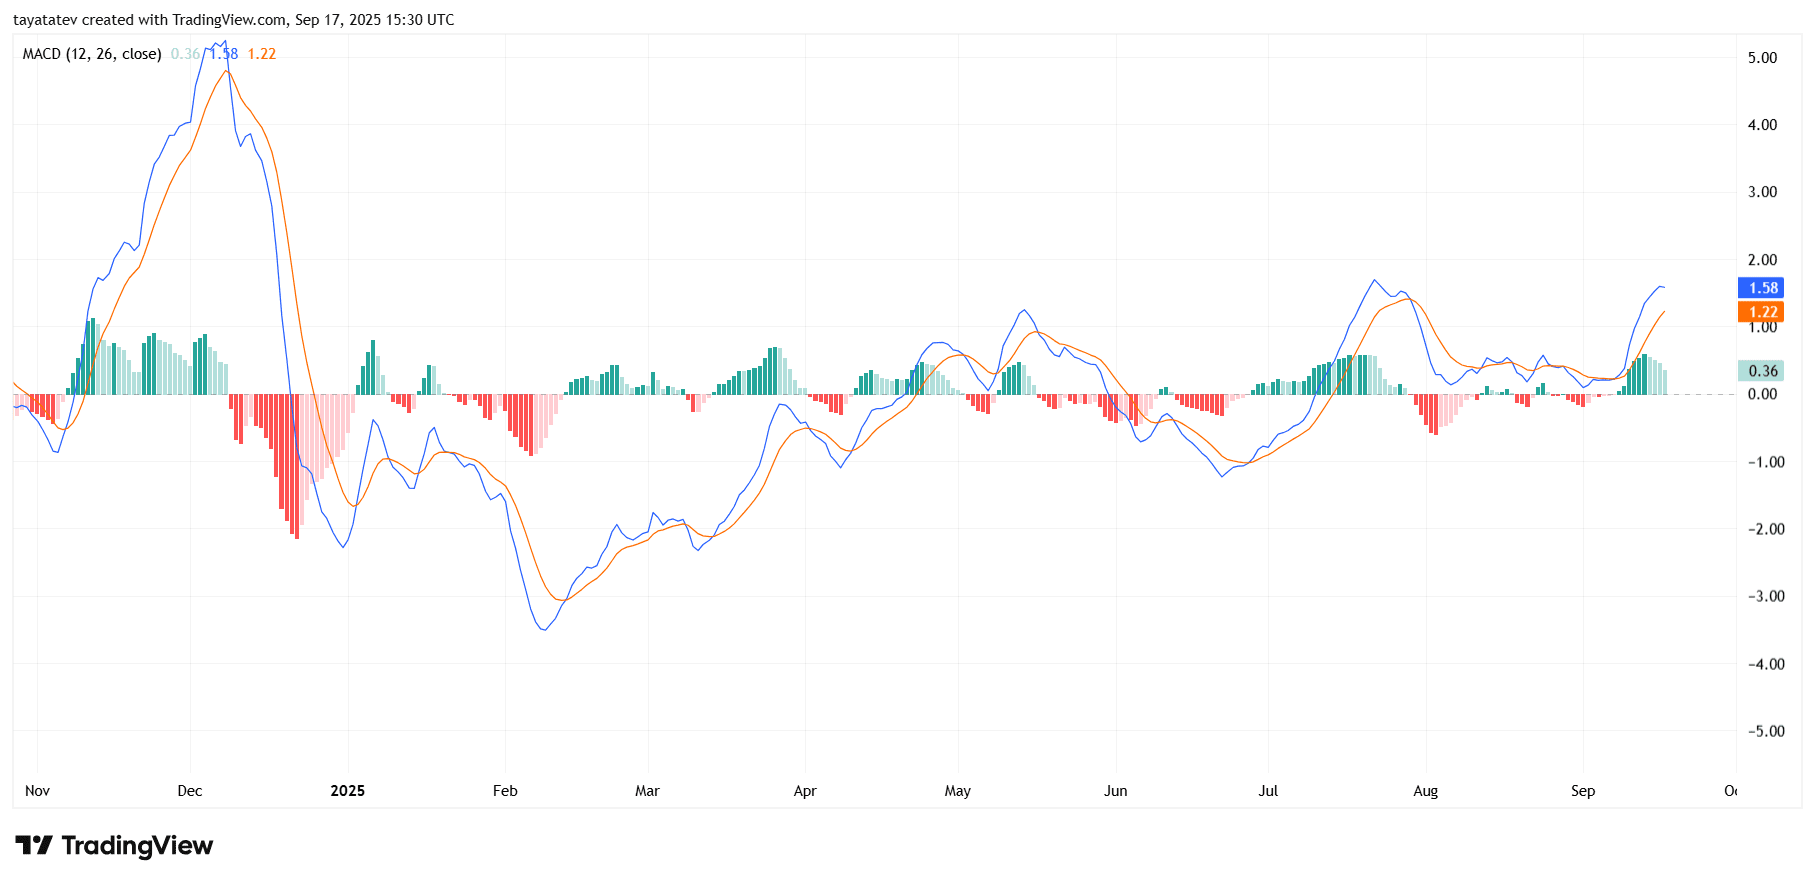
The Moving Average Convergence Divergence compares two exponential moving averages to gauge trend strength, while the signal line is a nine period average of the MACD. The histogram displays the difference between the two lines. With both lines above the zero baseline, the indicator places the current trend in a constructive phase.
Looking ahead, momentum typically remains favorable while the histogram expands and the MACD line stays above the signal line. However, if the histogram begins to contract or the MACD curls beneath the signal line, it would warn that momentum is fading and a pause or retest could follow. For now, the alignment supports the recent breakout context seen on price.