
The U.S. Securities and Exchange Commission extended two Hedera-linked ETF timelines. It set November 12, 2025 as the new date to approve or disapprove Nasdaq’s plan to list the Grayscale Hedera Trust (HBAR). Separately, it designated November 8, 2025 for a decision on the Canary HBAR ETF.
The Grayscale matter sits under SR-NASDAQ-2025-021, with the SEC citing the need for more time under Exchange Act Section 19(b)(2). The Canary proposal proceeds as SR-NASDAQ-2025-018 and carries a similar 60-day extension. Both items remain under formal proceedings opened earlier this year.

Nasdaq’s public rule-filings dashboard shows both HBAR products as pending under Rule 5711(d) for commodity-based trust shares. The page lists multiple milestones for each file, including notices and prior extensions.
Grayscale files S-1 for Hedera Trust ETF
Grayscale filed a preliminary S-1 on September 9, 2025 for the Grayscale Hedera Trust ETF. The prospectus describes a Delaware statutory trust formed on August 12, 2025 to hold HBAR and track its value less fees and liabilities.
The filing outlines creations and redemptions in baskets of shares and says the vehicle will not use derivatives. It also details custody arrangements and tax considerations common to grantor-trust crypto products. SEC

Grayscale notes it may stake HBAR if specific conditions are met, with carve-outs for fees, redemptions, or regulatory concerns. The S-1 positions staking as additive while preserving the trust’s passive mandate. SEC
Archax launches “Pool Tokens” on Hedera
Archax, an FCA-regulated exchange and custodian, launched Pool Tokens on Hedera on September 10, 2025. The first token represents equal parts of money market funds from Aberdeen, BlackRock, State Street, and Legal & General.
The model lets issuers compose regulated baskets into a single transferable token and target institutional workflows. Archax emphasizes instant settlement, portfolio portability, and use as collateral within its network.
Archax frames Pool Tokens as infrastructure for on-chain portfolios beyond funds, including indices and structured products. The launch expands Hedera’s footprint in tokenized finance with a live, regulated venue.
HBAR 4h chart shows falling wedge; 92% target in view
As of September 11, 2025, 13:18 UTC, the HBAR-USD 4-hour chart on Coinbase displays a clear falling wedge bounded by two downward, converging trendlines. Price trades near the upper boundary after a steady grind from early September. It also sits above the 50-EMA, which the chart marks around $0.2266, showing short-term momentum improvement.
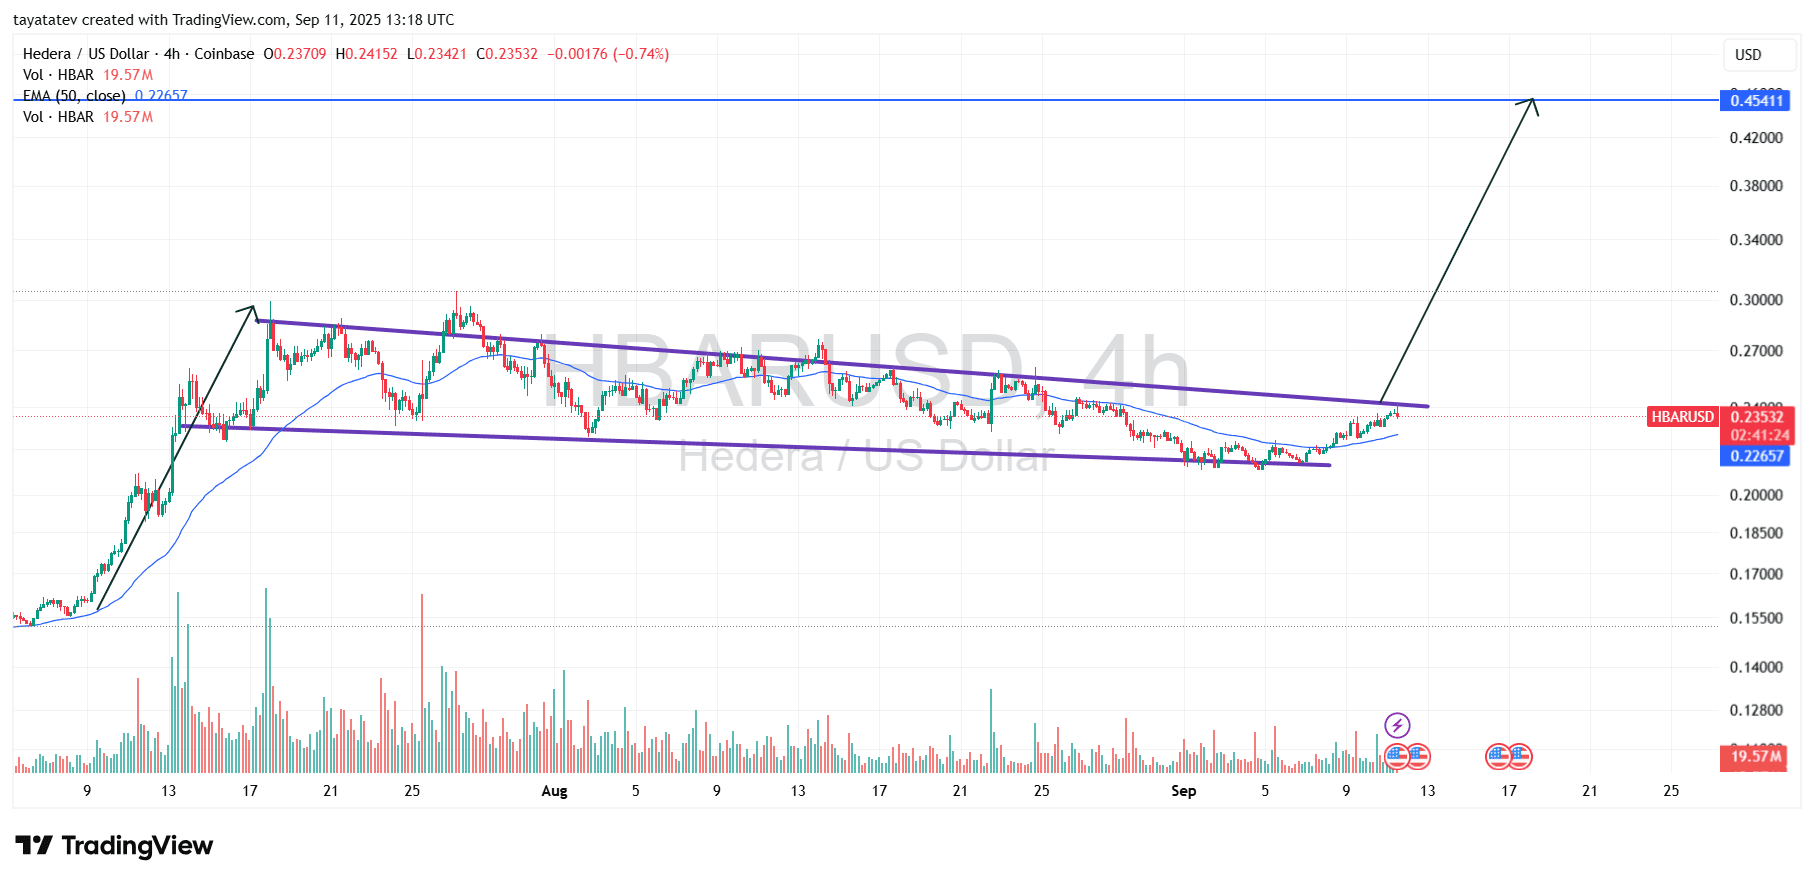
A falling wedge is a bullish reversal pattern made of two declining, converging trendlines that often precede an upside breakout. Here, candles press into resistance with tightening ranges and modest volume support. However, confirmation requires a decisive 4-hour close above the wedge’s upper trendline, ideally with stronger volume than recent sessions.
Using the stated scenario, a confirmed breakout implies a 92% advance from the current charted price of $0.2353. That projection sets a measured objective near $0.4518, which aligns with the horizontal level drawn close to $0.4541 on the chart. The confluence between the calculated target and the plotted line strengthens the relevance of that zone as the next destination.
In the meantime, structure remains constructive while price holds above the 50-EMA and continues printing higher short-term lows. The rising mini-base under resistance supports the pressure build needed for a clean break. Yet, without a close above the trendline, the setup stays unconfirmed and vulnerable to pullbacks toward the mid-channel area.
Therefore, the chart communicates a straightforward sequence. First, clear resistance on a 4-hour closing basis to confirm the falling-wedge breakout. Then, the pattern’s 92% measured move points toward $0.4518 (roughly $0.452–$0.454), consistent with the level highlighted on the graphic.
HBAR 4h RSI sits in a bullish regime
As of September 11, 2025, HBAR /USD 14-period RSI on the 4-hour chart reads 63.1, with its signal near 63.6. Momentum has stayed above the 50 baseline since early September and continues to rise. The slope of the RSI and its signal line points higher, which supports ongoing strength into resistance.
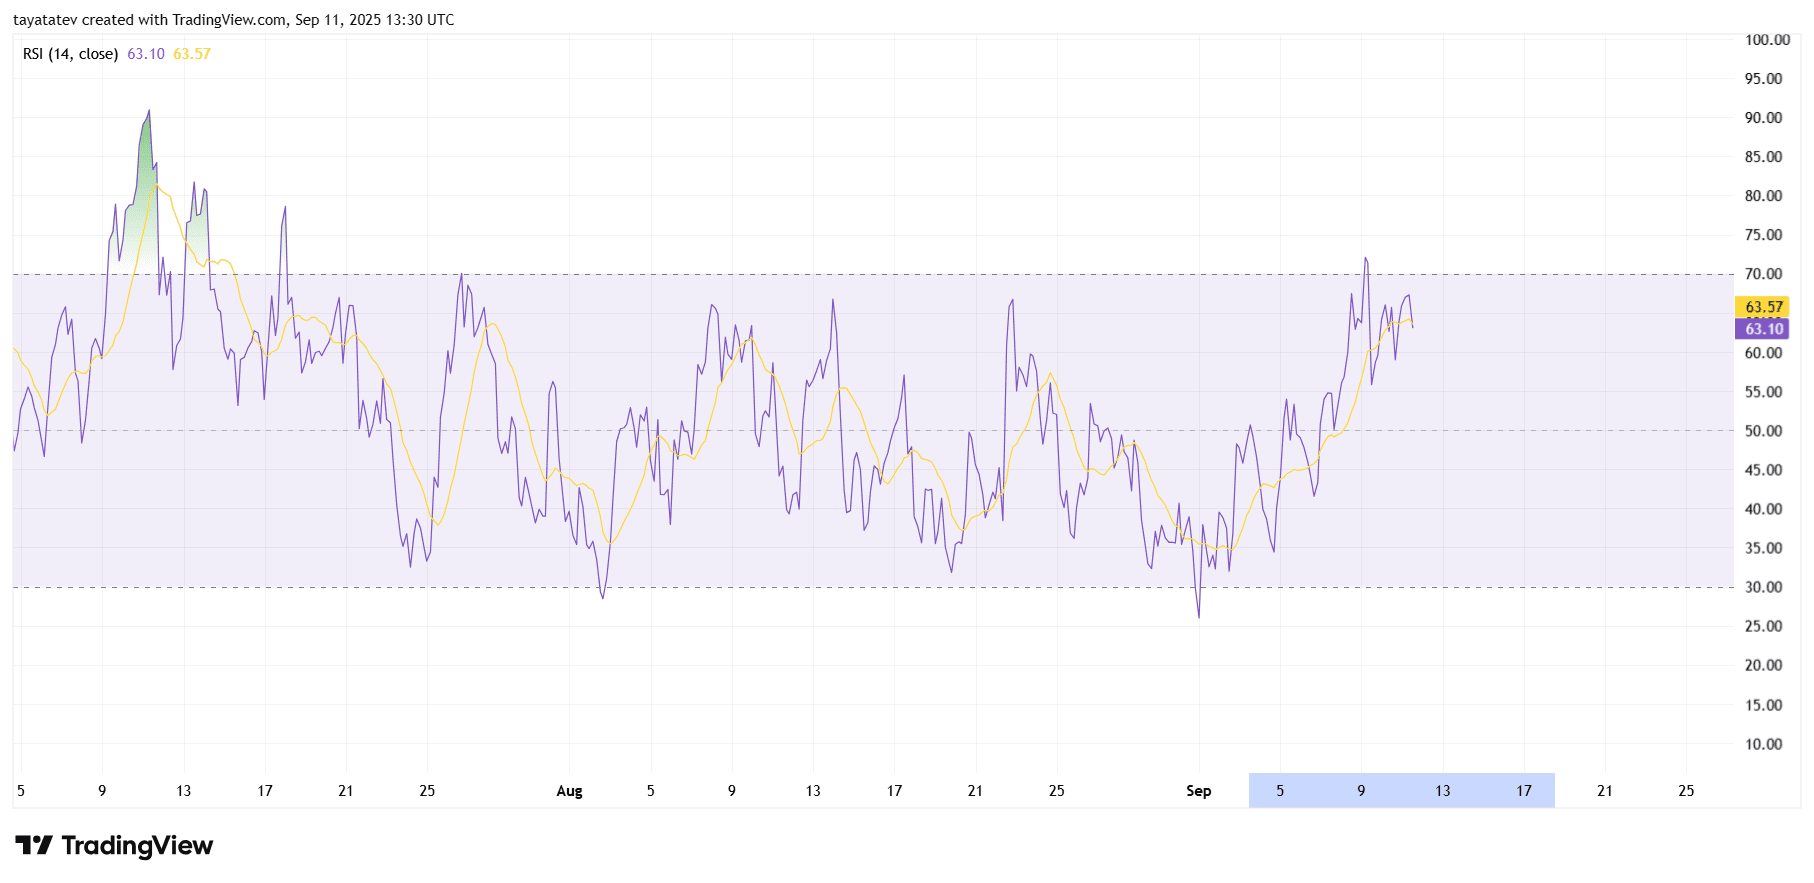
RSI measures the speed of gains versus losses on a 0–100 scale; readings above 50 favor buyers. Here, the oscillator reclaimed 50, retested it, and advanced toward 70. That sequence shows improving participation after weeks of range-bound movement. It also aligns with the recent push into the wedge’s upper boundary noted earlier.
Conditions remain constructive while RSI holds the 60–65 band. A clean move through 70 would confirm strong momentum into any breakout. However, a drop back below 50 would weaken the setup and invite a pause. Across the last two swing highs, the chart does not show a clear bearish divergence, which keeps the momentum profile supportive for continuation.
HBAR 4h MACD turns positive and builds momentum
As of September 11, 2025 at 13:37 UTC, the 4 hour MACD shows a clear bullish shift. The MACD line sits near 0.0039 and above the signal near 0.0035. The histogram is positive around 0.0004 and expanding, which confirms strengthening upside momentum.
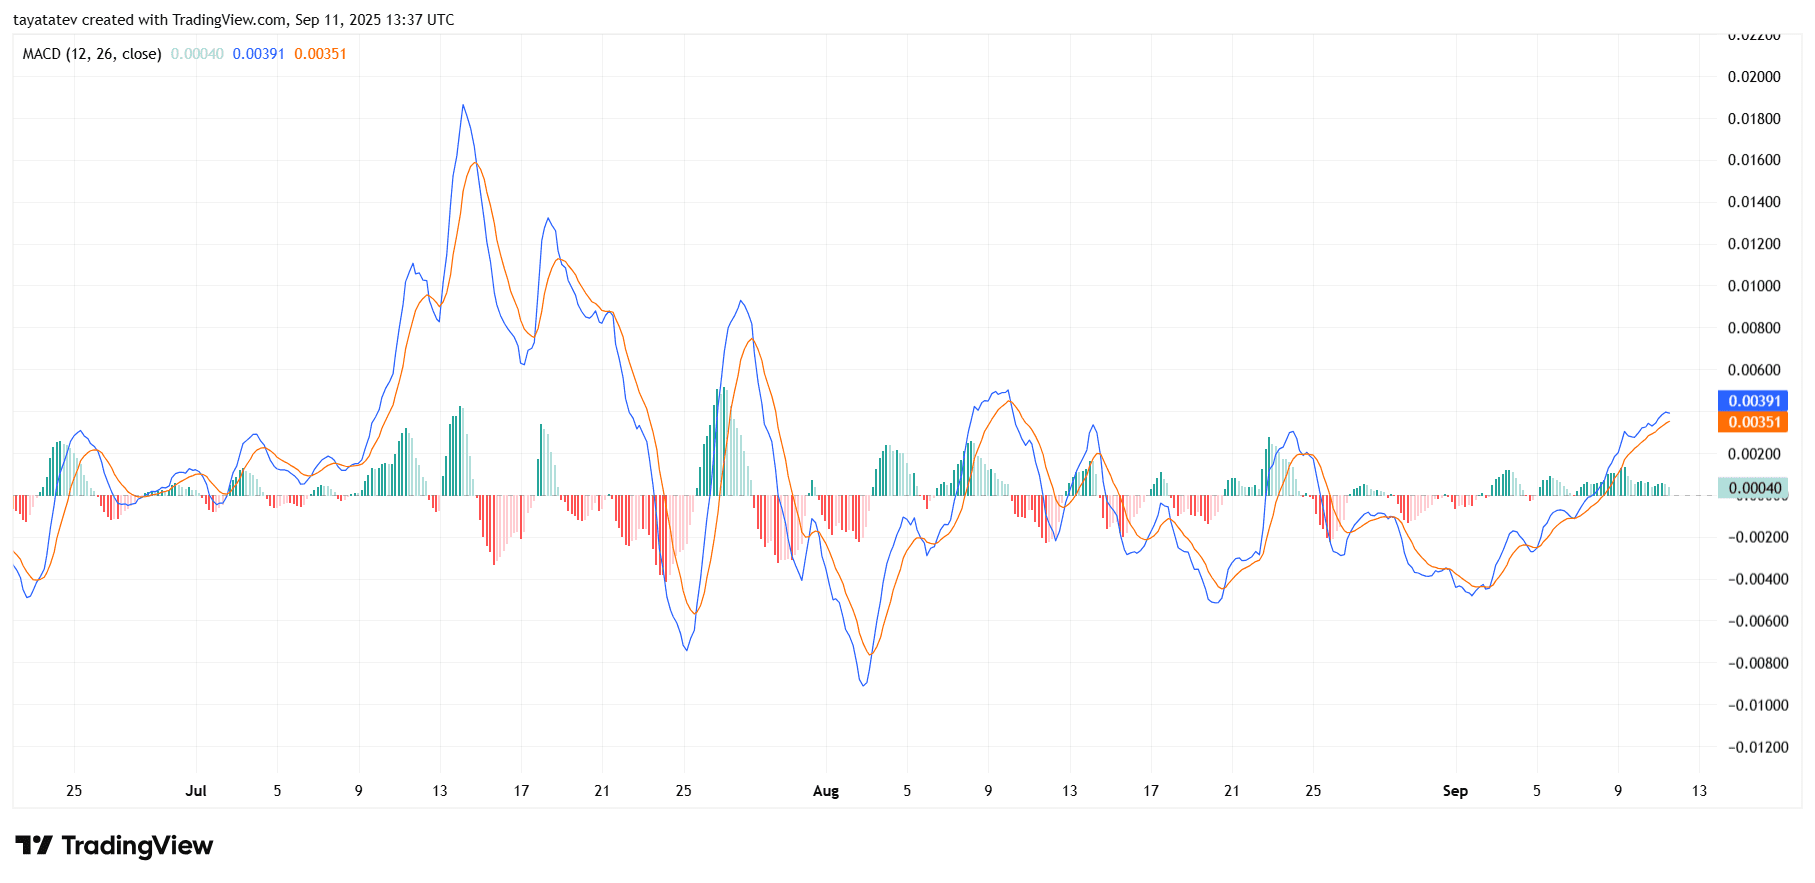
MACD compares two moving averages of price to show momentum and trend strength. Here, the bullish crossover formed around September 9 and has continued to widen. Both lines now hold above the zero line, which usually aligns with an advancing phase.
This profile supports the ongoing breakout attempt discussed on the wedge chart. Momentum looks constructive while the histogram rises and the MACD makes higher highs. However, a fading histogram, a bearish crossover, or a drop back below zero would warn of a stall.