
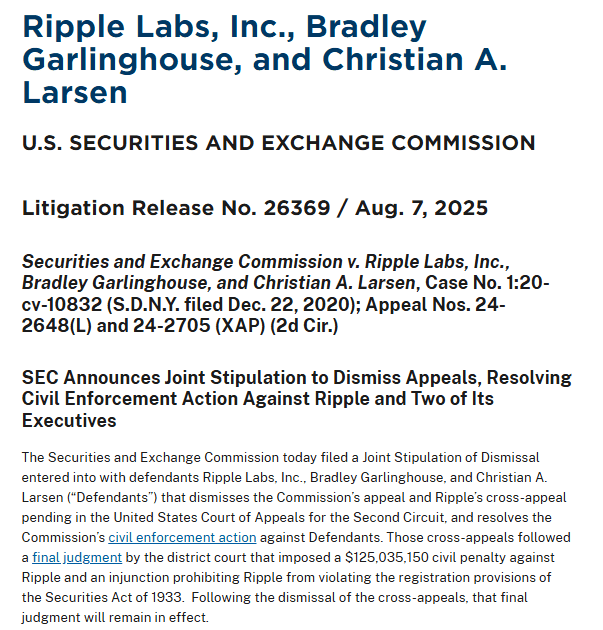
Ripple closed its lengthy battle with the U.S. Securities and Exchange Commission, bringing long-awaited regulatory clarity for XRP. The settlement ends years of uncertainty and allows Ripple to direct its efforts toward cross-border payments.
With the case behind it, Ripple is positioning its XRP Ledger and RippleNet as faster and cheaper alternatives to SWIFT. The company argues that blockchain technology can deliver real-time settlement and cost efficiency that legacy systems cannot match.

At the same time, SWIFT has tested blockchain solutions, including the XRP Ledger, but remains cautious. It stresses the importance of neutral, legally enforceable infrastructure instead of relying on one blockchain system.
Ripple Transfers 250 Million XRP Amid Escrow Releases
Ripple executed large transfers this week, moving 250 million XRP to an unknown wallet and nearly 49.9 million XRP to a wallet linked to FTX. The transactions drew attention across the market and raised questions about the company’s liquidity management strategy.
Ripple has historically released XRP from escrow each month and redistributed portions to various wallets. The latest movements appear consistent with that practice, reinforcing its long-term approach to controlling token supply while maintaining operational flexibility.

Although some observers highlighted the connection to an FTX-linked address, Ripple has not provided public details on the purpose of the transfers. Market participants continue to monitor on-chain flows for further clarity.
XRP Positions for Institutional Expansion
The combination of regulatory clarity and strategic escrow management strengthens Ripple’s institutional case. By eliminating the legal overhang and continuing structured token distribution, Ripple is aligning itself with financial institutions seeking compliant blockchain solutions.
Industry analysts note that Ripple’s strategy now targets the same territory SWIFT dominates. With the global payments market under review for efficiency and transparency, XRP’s role as a bridge asset faces its biggest institutional test yet.
XRP Chart Signals Bullish Flag Breakout Toward $5.04
The XRP/USD chart created on September 7, 2025, shows XRP trading near $2.83 on the four-hour timeframe. The price action forms a clear bullish flag pattern, a structure that typically emerges after a strong upward move. In this setup, the market rallies sharply, consolidates within a downward-sloping channel, and then prepares for another breakout in the same direction.
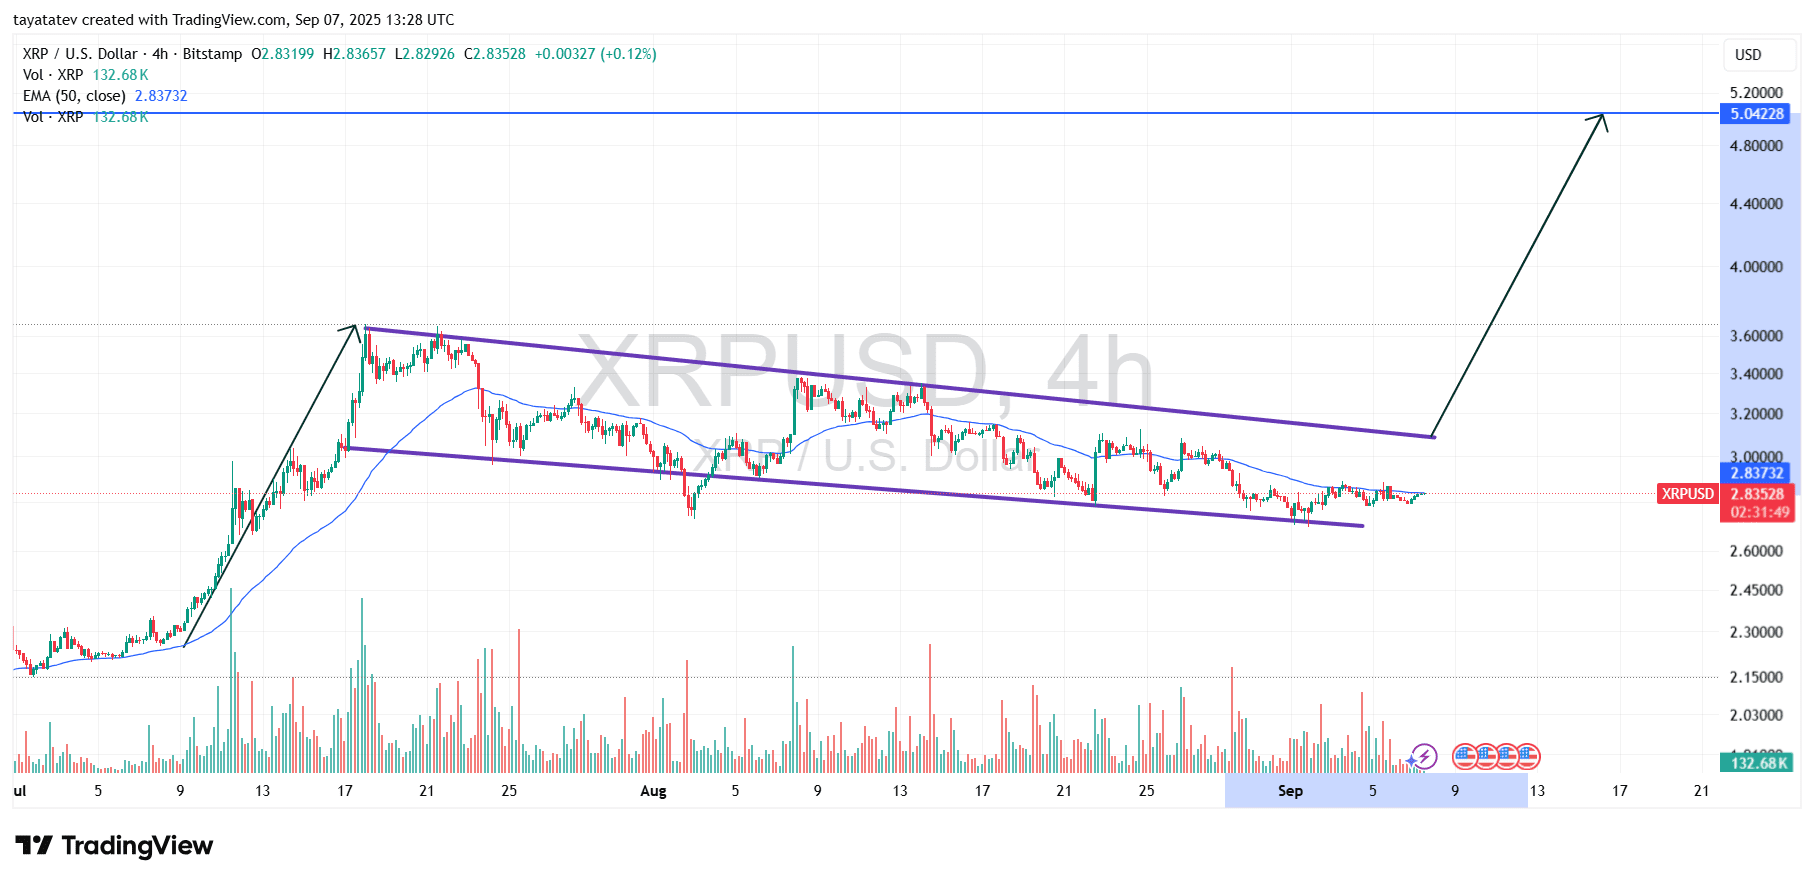
A bullish flag often signals continuation rather than reversal. The flagpole represents the initial surge, while the consolidation channel reflects temporary profit-taking. Once momentum rebuilds, the breakout tends to mirror the magnitude of the previous rally. In XRP’s case, the projected move suggests a potential 78% rise from the current level, aiming for a target near $5.04.
The chart also shows that XRP is testing the 50-period exponential moving average (EMA), which sits almost flat at $2.83. Holding above this EMA strengthens the bullish outlook. At the same time, the breakout direction remains critical—confirmation requires XRP to close above the upper boundary of the flag channel with increasing volume. If this occurs, momentum traders are likely to target the $5.04 level, which aligns with the measured move projection from the flagpole.
In short, XRP’s current formation highlights a decisive moment. The bullish flag points toward continuation, and technical projections indicate a substantial upside if the breakout confirms. The structure suggests that XRP could leave behind its consolidation phase and push into higher ranges, with $5.04 as the immediate objective.
XRP RSI Analysis Shows Neutral Momentum
The chart you shared, created on September 7, 2025, tracks XRP’s Relative Strength Index (RSI) on the four-hour timeframe. The RSI line (purple) currently sits near 52.67, while the signal line (yellow) is close at 49.58.
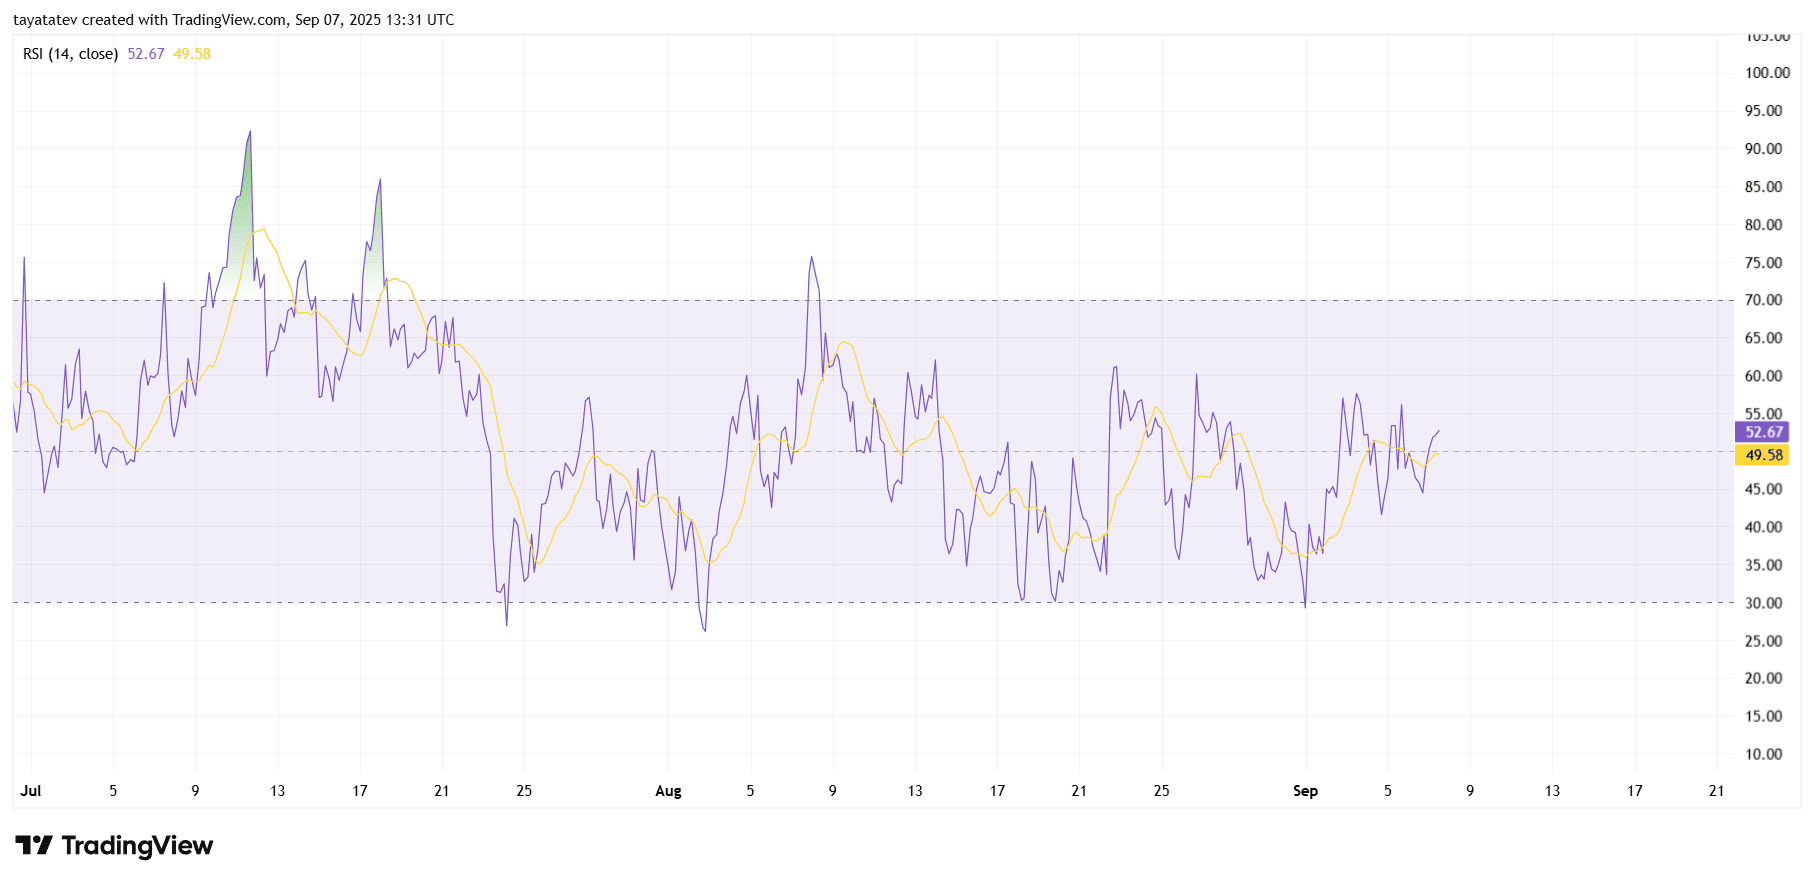
This level places XRP in the neutral zone, between 30 and 70, which indicates that the market is not yet overbought or oversold. The sideways oscillation in recent weeks shows traders remain undecided, with momentum failing to establish a strong direction.
At the same time, the RSI’s movement above the 50 mark signals a gradual tilt toward bullish momentum. If the RSI continues to climb and breaks above 60, buying pressure could accelerate, supporting a breakout from the ongoing consolidation. However, repeated rejections near the 55–60 zone would suggest lingering resistance and possible hesitation before the next trend forms.
Overall, the RSI confirms that XRP is in a balanced state, neither overheated nor weak. The indicator aligns with the bullish flag setup from the price chart, suggesting that a confirmed breakout could shift momentum decisively upward.
XRP MACD Indicator Points to Emerging Momentum Shift
The chart you shared, created on September 7, 2025, shows the MACD (12, 26, close) for XRP on the four-hour timeframe. The MACD line (blue) is currently at 0.00253, while the signal line (orange) is at -0.00272. The histogram shows small positive green bars, suggesting early bullish pressure.
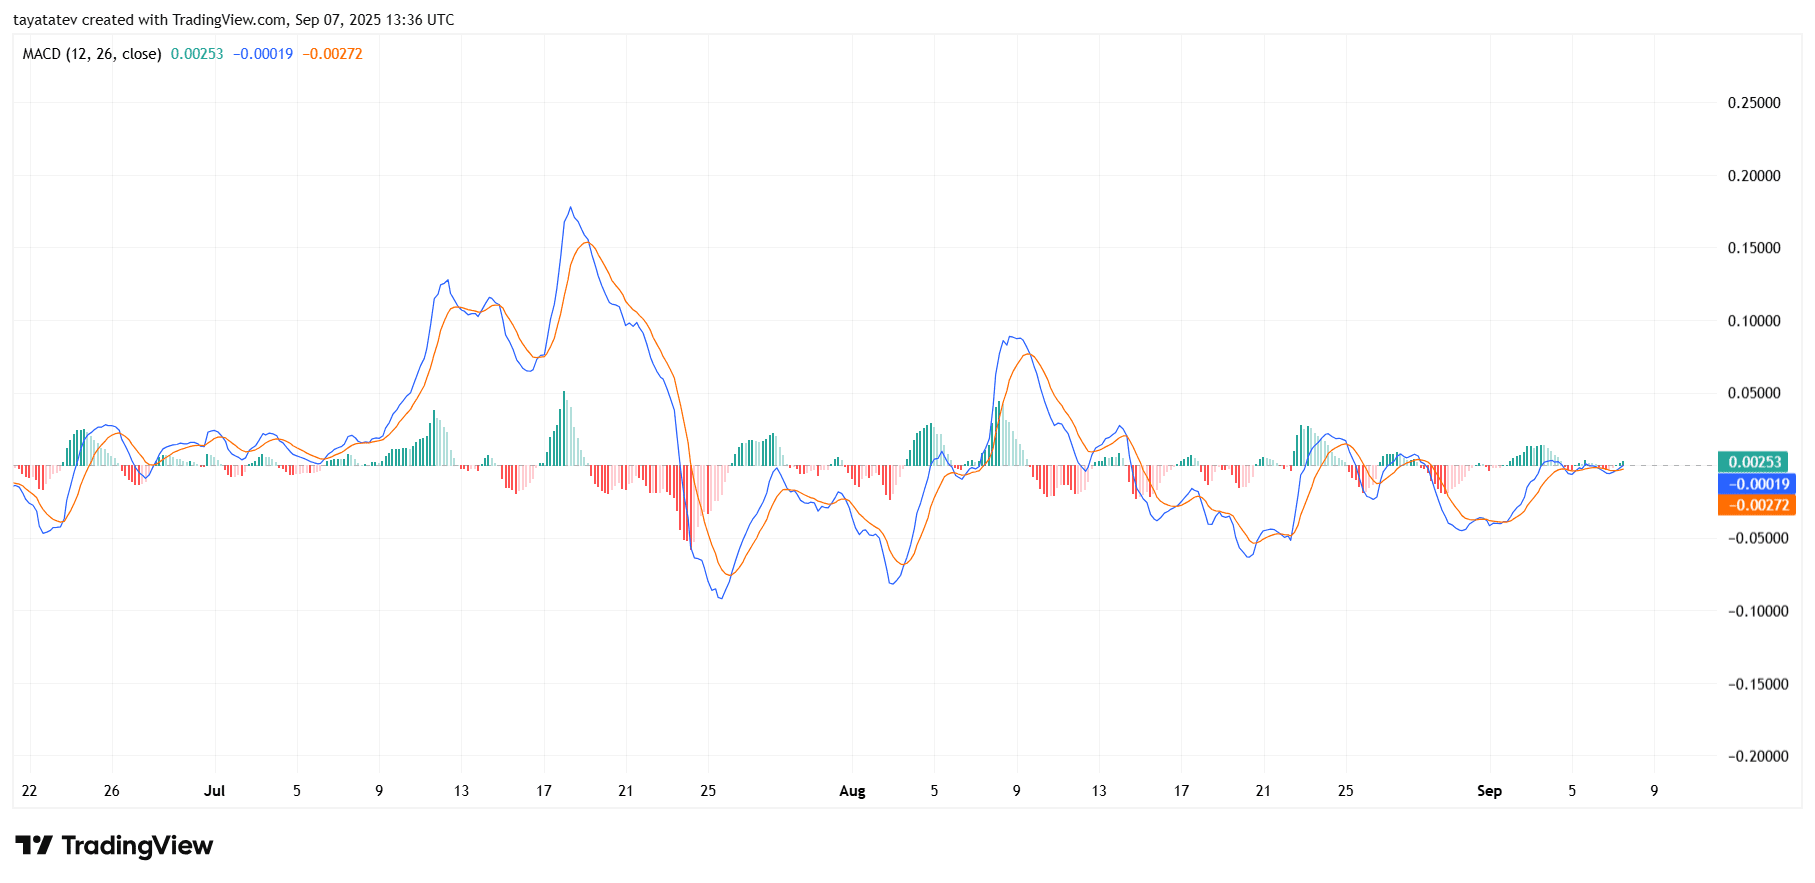
This alignment indicates that XRP is attempting a momentum crossover. The MACD line crossing above the signal line generally reflects the start of renewed buying strength. At the same time, the histogram’s transition from red to green confirms that bearish momentum is weakening and buyers are regaining control.
However, the crossover remains close to the zero baseline, which means momentum is still fragile. For a stronger signal, the MACD needs to rise decisively above the zero line with expanding green bars on the histogram. If this occurs, it would align with the bullish flag pattern on the price chart and the neutral-to-bullish tilt in the RSI, reinforcing the probability of a breakout.
In summary, the MACD highlights a potential shift toward bullish momentum, but the signal requires confirmation with stronger follow-through. This indicator adds weight to the broader technical case for XRP’s next upward move.