
Dogecoin is moving closer to mainstream institutional finance as speculation around a dedicated exchange-traded fund (ETF) intensifies. Reports indicate that a Dogecoin ETF could launch as early as next week, placing the meme-inspired cryptocurrency in the same category as Bitcoin and Ethereum, which already have active ETF markets. The development signals an expanding appetite among traditional financial players to package and trade digital assets once dismissed as internet jokes.
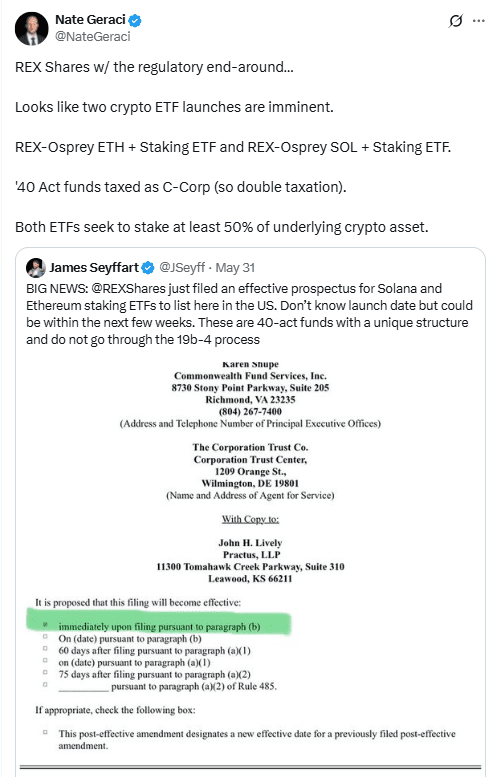
The timing of the potential launch underscores a wider push to provide structured exposure to retail and institutional investors alike. While regulators have previously resisted Dogecoin’s entry into formalized products, the market’s increasing maturity appears to have paved the way. A Dogecoin ETF would allow investors to gain access without directly holding the token, further bridging the gap between traditional finance and crypto assets.

Industry observers note that the ETF talks go beyond speculative price action. Instead, the focus has shifted to Dogecoin’s role in diversifying cryptocurrency investment vehicles. If approved, the product could validate Dogecoin as more than a cultural phenomenon and align it with the framework of institutional-grade investment products.
Cultural Role Expands
Alongside financial speculation, Dogecoin’s cultural significance continues to grow. Originally created as a parody, Dogecoin has transformed into a digital symbol that represents internet communities, humor, and decentralized participation. Analysts point to its unique ability to attract mainstream attention by merging online culture with financial experimentation, making it stand apart from most digital assets.
Over time, Dogecoin has evolved into a cultural touchstone that embodies the intersection of meme culture and financial inclusion. Its community-driven narrative keeps it relevant in broader conversations about technology and finance. While other cryptocurrencies often rely on utility-driven arguments for survival, Dogecoin thrives on social momentum and its ability to resonate with new generations of internet users.

This enduring cultural footprint has also influenced decision-making in financial markets. The combination of humor, community, and accessibility reinforces Dogecoin’s staying power, ensuring its relevance even in moments when price activity remains muted. The possibility of an ETF only strengthens this narrative, presenting Dogecoin as both a financial product and a cultural marker.
Whale Activity Raises Questions
At the same time, large-scale Dogecoin transfers have captured the attention of analysts. Recent whale activity saw the movement of hundreds of millions of DOGE, sparking speculation about changing market dynamics. These transfers, often executed by early adopters or institutional players, can significantly influence liquidity and sentiment, even when the overall market price holds steady.
The scale of such movements often serves as a barometer for investor confidence and strategic positioning. In the case of Dogecoin, the transfers suggest preparations for possible structural changes, such as the anticipated ETF introduction. Analysts emphasize that while price may not immediately reflect these activities, the underlying signals reveal ongoing shifts in market strategy.
Moreover, the whale transactions highlight the dual nature of Dogecoin as both a cultural asset and a financial instrument. The movement of large holdings underscores its presence in serious portfolios, contrasting sharply with its origins as a meme. This paradox remains central to Dogecoin’s identity, blending internet culture with institutional interest.
Dogecoin Chart Signals Bullish Triangle Breakout
The Dogecoin DOGE/USD chart created on September 6, 2025 highlights a developing bullish triangle pattern on the four-hour timeframe. A bullish triangle pattern occurs when the price consolidates between a series of lower highs and higher lows, compressing toward an apex before breaking upward. This setup often signals the continuation of an upward trend once resistance gives way.
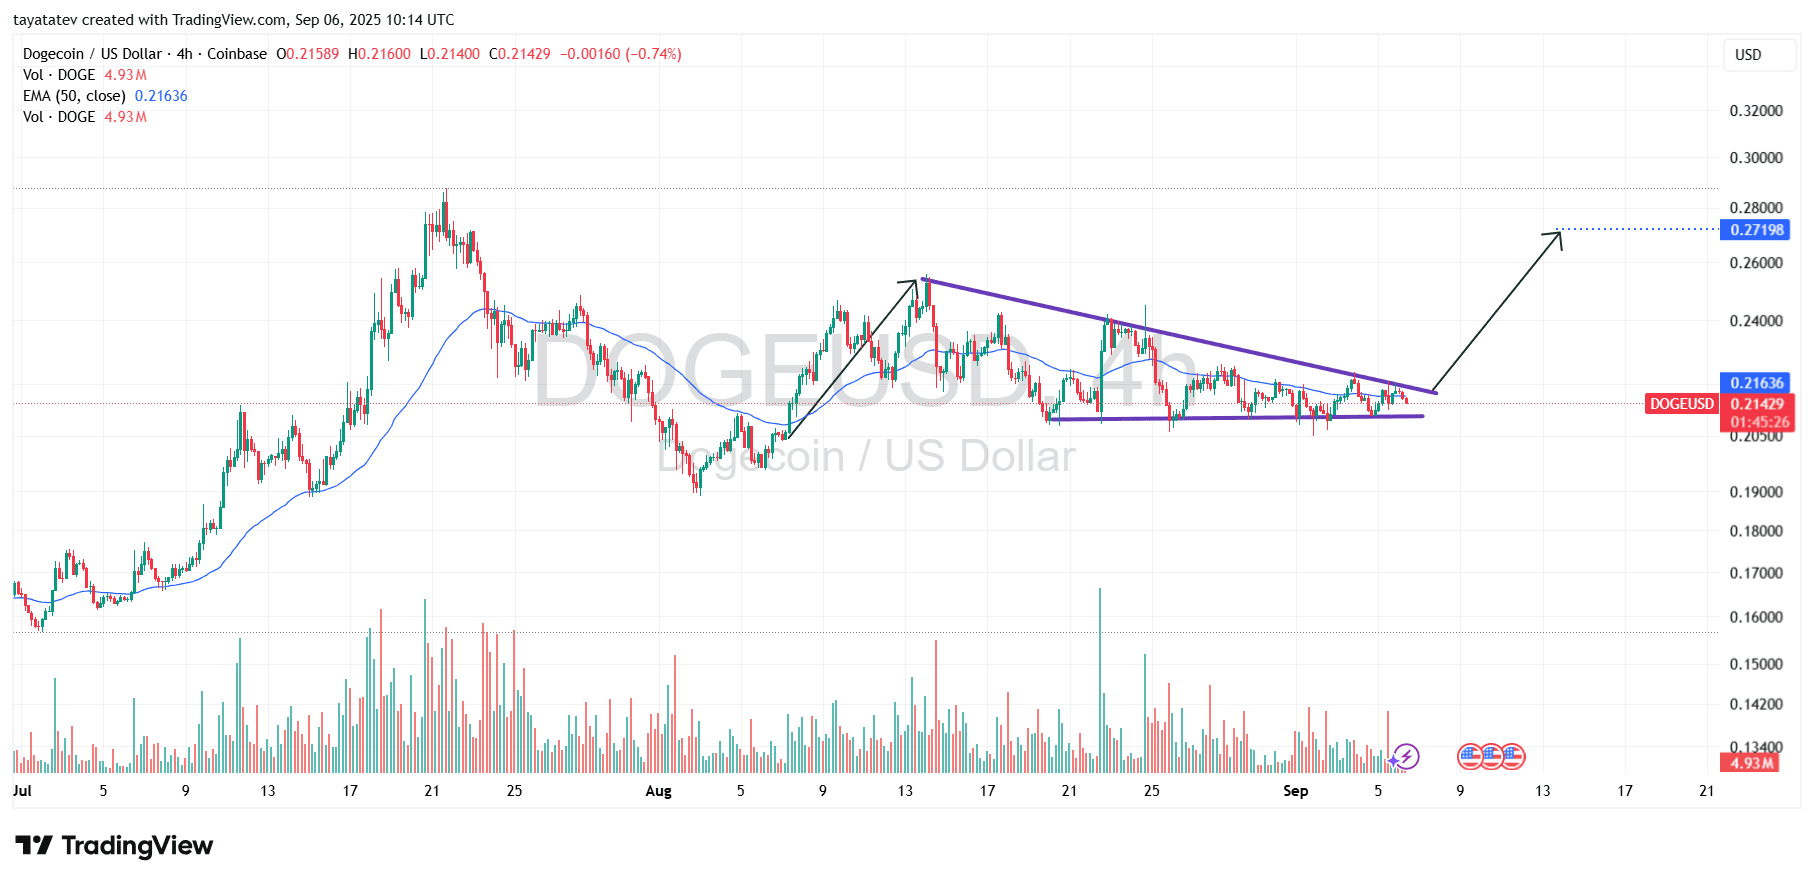
In the current chart, Dogecoin trades near $0.214 with the 50-period exponential moving average positioned at $0.216. The descending trendline that has capped rallies since mid-August is now converging with horizontal support around $0.205. This confluence creates the triangular structure that traders monitor for a potential breakout. Trading volume has remained relatively steady, yet several spikes suggest accumulating interest ahead of a decisive move.
If the bullish triangle confirms, the projected move could lift Dogecoin by roughly 27 percent from its current level. That calculation points toward a target near $0.272. The projection aligns with the measured-move principle, which estimates upside potential by applying the height of the triangle base to the breakout level. The chart itself reflects this possibility with an indicated path toward the $0.27 zone.
The technical backdrop strengthens the case for such a breakout. The price has respected the $0.205 support level multiple times, indicating strong demand at that zone. Moreover, the proximity of the 50-EMA to current price action shows consolidation rather than weakness. If buyers sustain momentum and push through the descending resistance line, Dogecoin could establish a higher trajectory and validate the bullish triangle outlook.
Analysts note that the structure suggests more than a short-term fluctuation. The breakout, if confirmed, may realign sentiment in favor of continuation, especially with market discussions around the upcoming Dogecoin ETF adding to speculative demand. As a result, the $0.27 price target emerges not only as a technical milestone but also as a potential marker for broader shifts in Dogecoin’s positioning within the crypto market.
Dogecoin MACD Suggests Building Momentum
The Dogecoin MACD chart created on September 6, 2025, at 10:20 UTC shows momentum tightening after weeks of swings. The MACD, or Moving Average Convergence Divergence, measures shifts in momentum by comparing two moving averages of price. On this chart, the MACD line and signal line have crossed multiple times since July, reflecting alternating phases of bullish and bearish pressure.
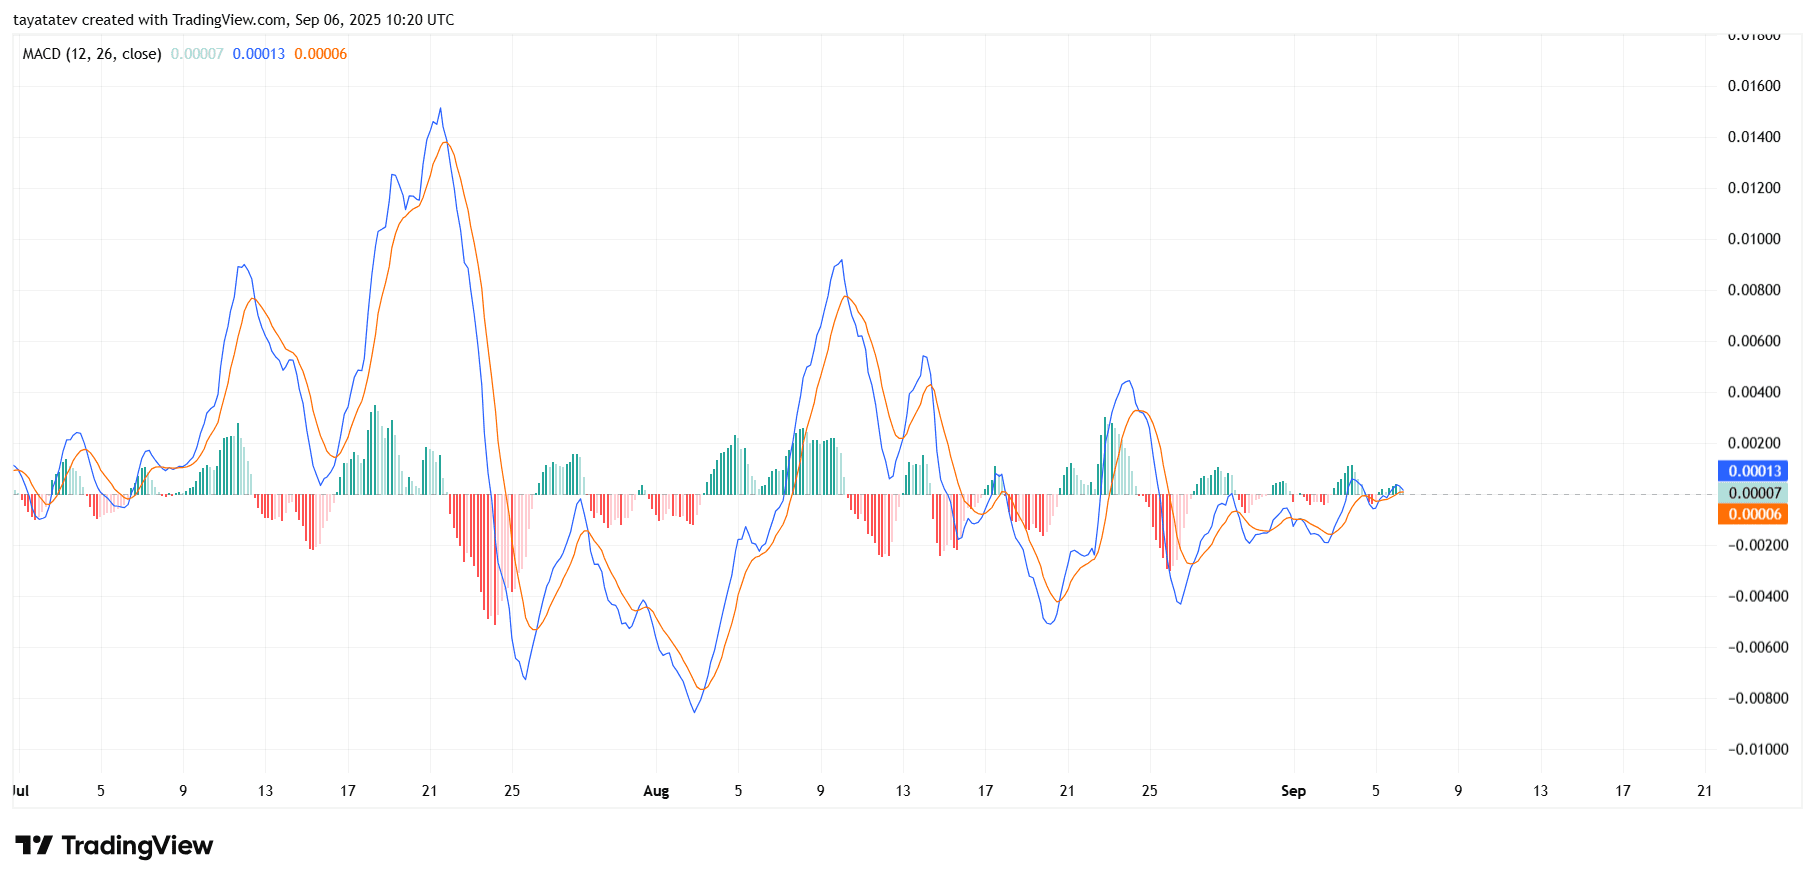
In late July, the MACD dropped sharply into negative territory, confirming a strong bearish wave that pushed prices lower. By early August, the MACD rebounded quickly, signaling a return of buyers. This recovery was followed by another deep decline in mid-August, underscoring volatility and the absence of clear direction. Since then, the indicator has narrowed, with both lines now flattening close to the zero axis.
The histogram bars support this observation. Large red bars in late July and mid-August marked intense selling phases. However, green bars in early August and late August reflected buyer attempts to regain control. Now the histogram shows smaller bars on both sides, suggesting balance between bulls and bears. This shrinking activity typically precedes a stronger move once momentum resolves.
The closeness of the MACD and signal lines points to indecision, but also to an imminent shift. If the MACD line crosses decisively above the signal line, the indicator will confirm fresh bullish momentum. With the lines positioned near zero, even a small uptick could translate into a significant directional push. For Dogecoin, this means the market is coiling energy for its next breakout phase, matching the bullish triangle pattern seen on the price chart.
Dogecoin RSI Shows Neutral Momentum
The Dogecoin RSI chart created on September 6, 2025, at 10:31 UTC reflects balanced momentum after a period of volatility. The Relative Strength Index (RSI) measures the speed and change of price movements on a scale of zero to 100, with levels above 70 signaling overbought conditions and below 30 signaling oversold conditions.
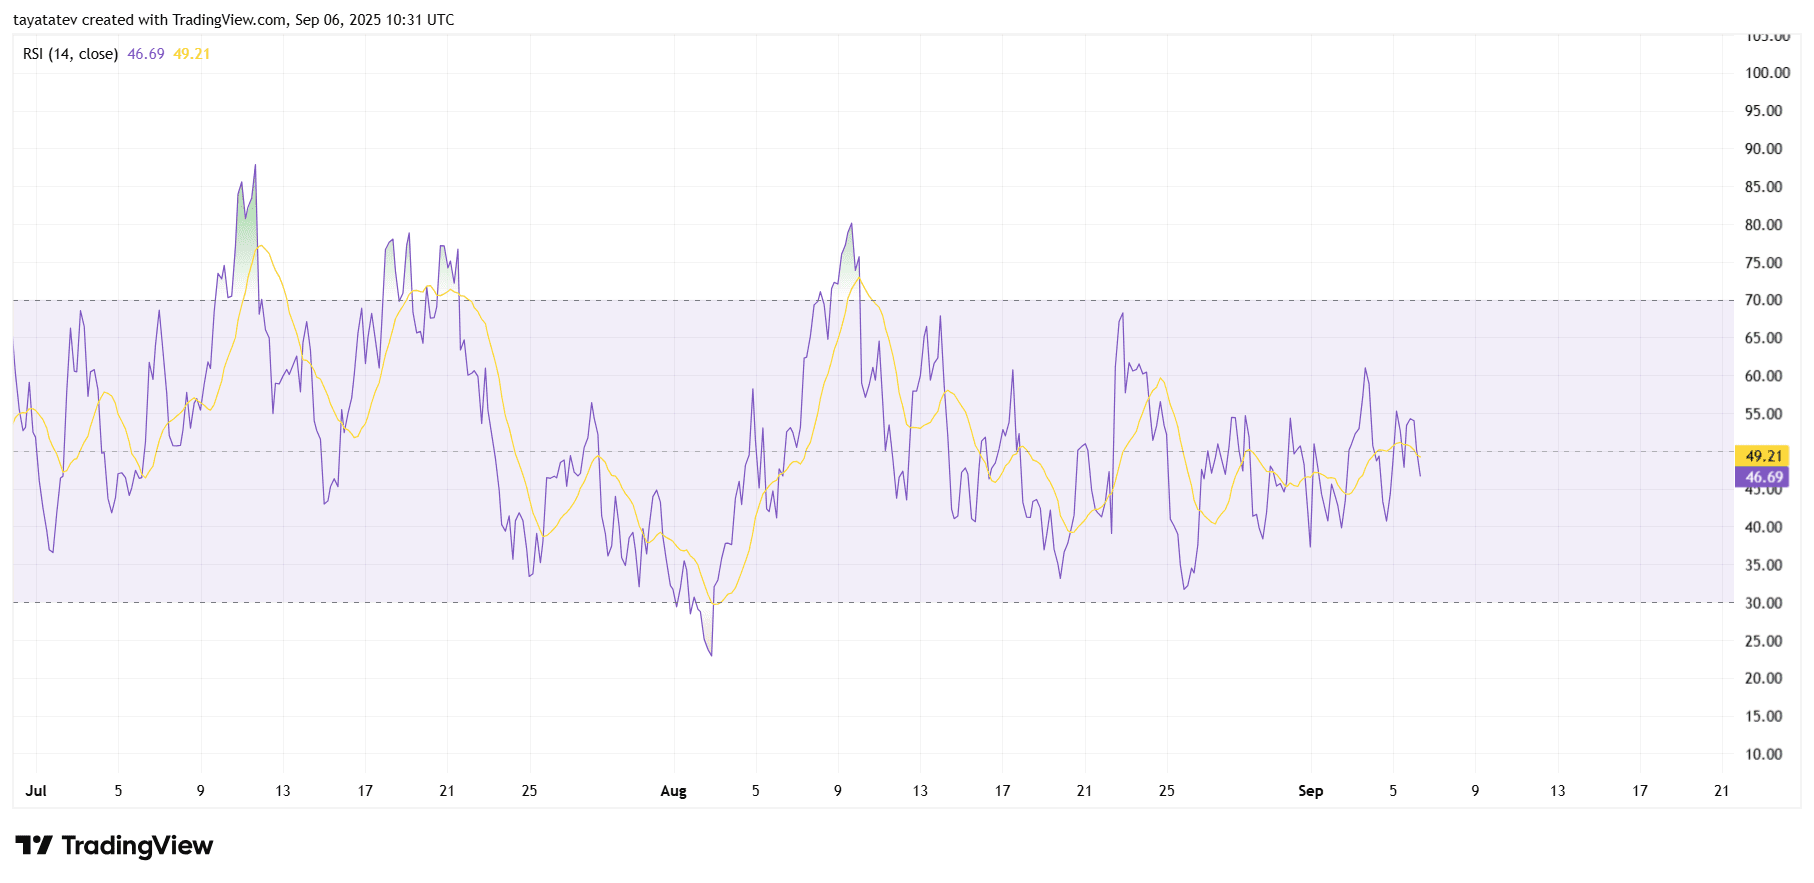
Currently, the RSI stands near 47, which sits almost at the midpoint of the scale. This position suggests neutral momentum, with neither buyers nor sellers showing clear dominance. Throughout July and August, the RSI moved sharply between overbought and oversold zones, highlighting the market’s alternating waves of demand and profit-taking. In late July, the indicator spiked above 70, confirming excessive buying, followed by a strong correction that drove it below 30.
Since mid-August, the RSI has flattened, mirroring the sideways consolidation seen in Dogecoin’s price chart. The steady movement around the midline indicates a market waiting for direction. Importantly, the lack of extremes shows that the asset is neither stretched to the upside nor pressured heavily to the downside. This stability often precedes decisive moves, especially when other indicators such as the bullish triangle pattern and tightening MACD suggest the potential for a breakout.
If RSI begins to climb above 55 while maintaining higher lows, it could confirm building bullish strength. Conversely, a drop below 40 would warn of renewed selling pressure. At this point, the RSI highlights equilibrium, setting the stage for momentum to align with the upcoming breakout decision visible in Dogecoin’s broader technical structure.